Tips
Tips of the Day#
Getting Started#
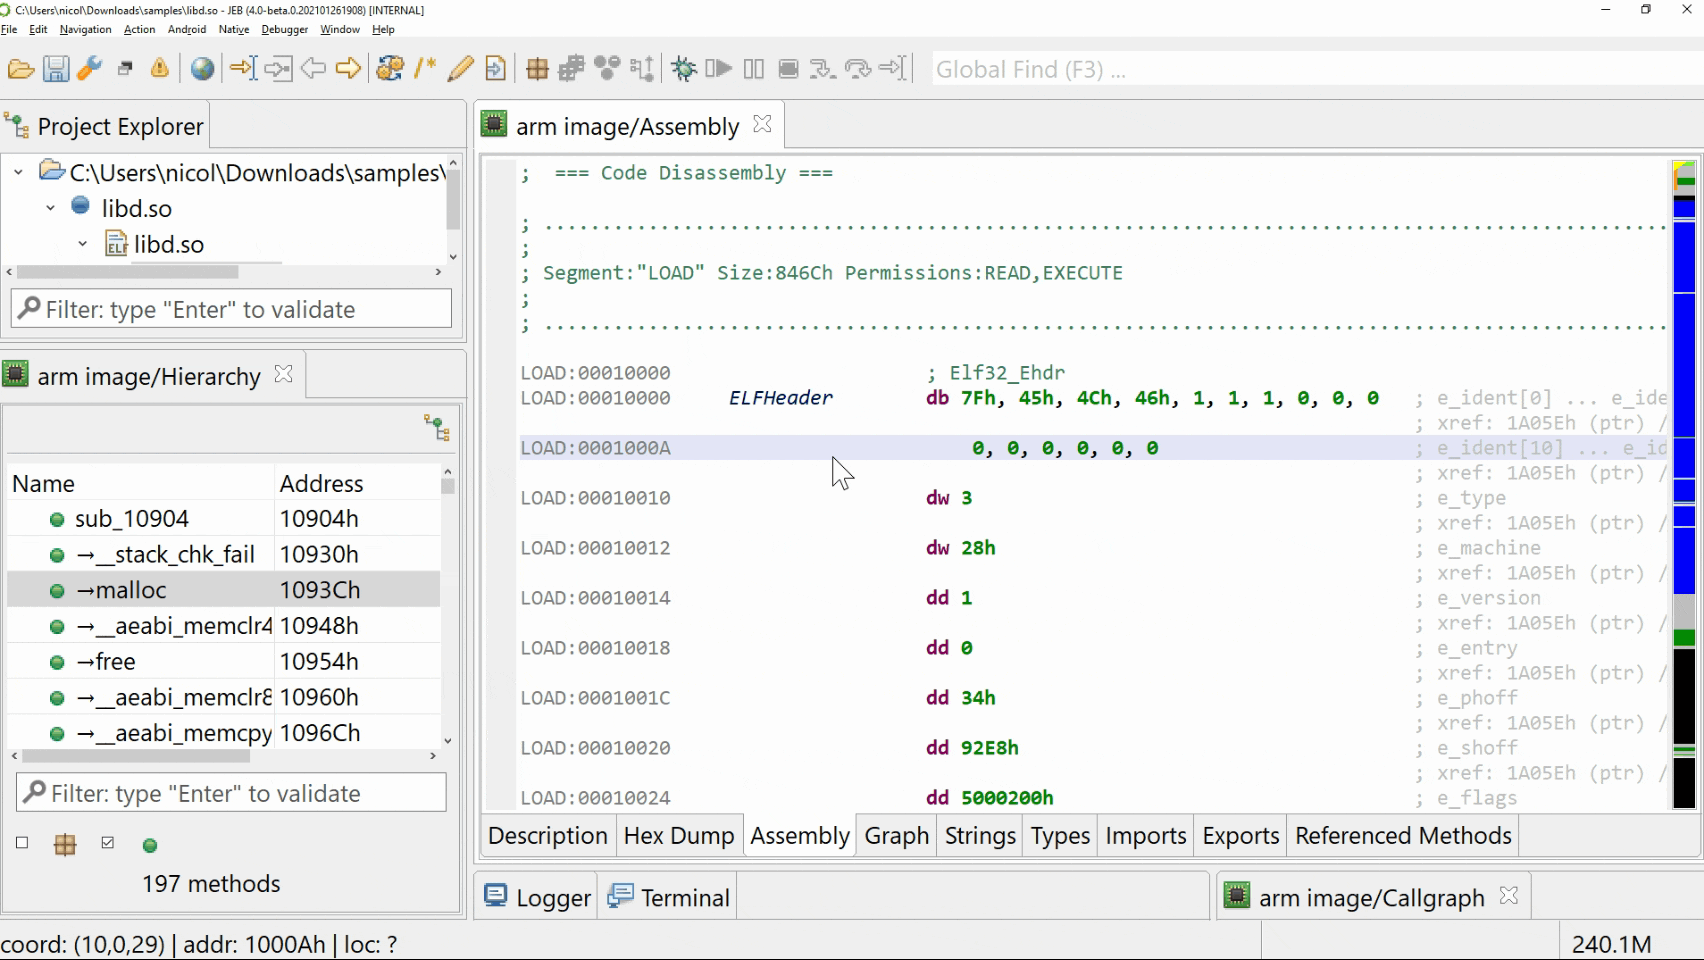
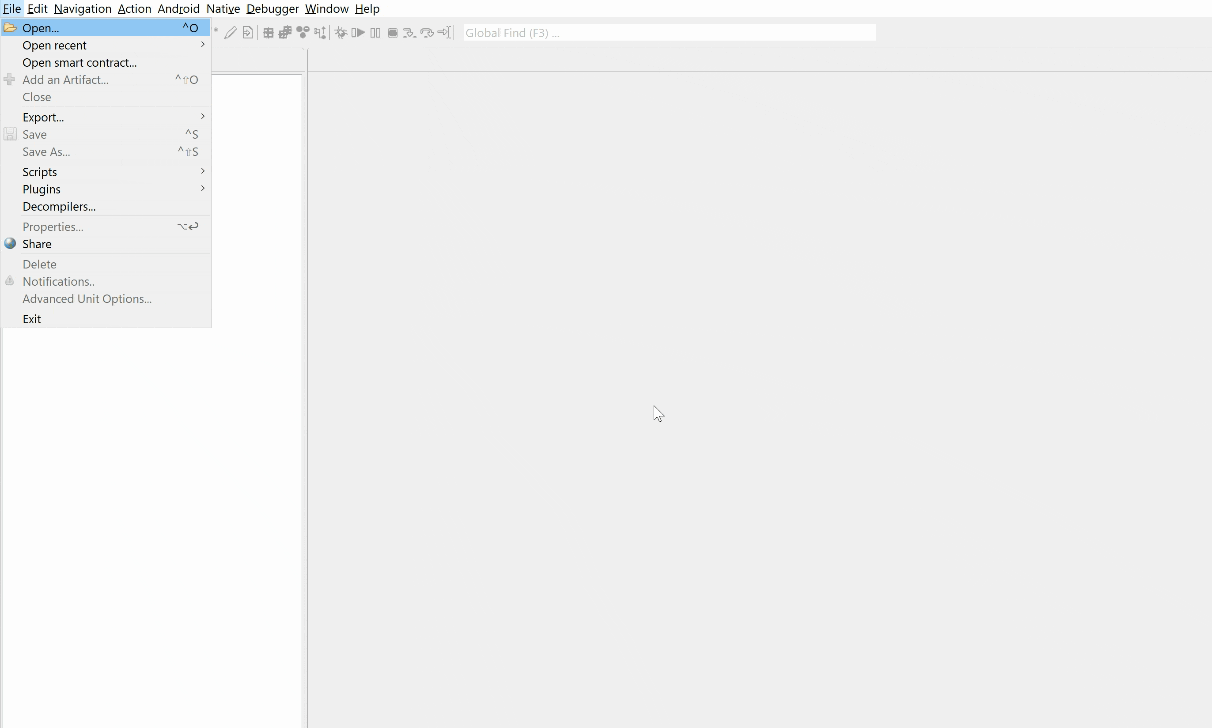
Welcome! If this is your first run, you should be presented with an empty JEB workspace. Create a new project by opening a file (menu File, command Open) to be analyzed: it can be a PE file, an ELF file, an APK or DEX file, or anything else that your JEB build has plugin support for.
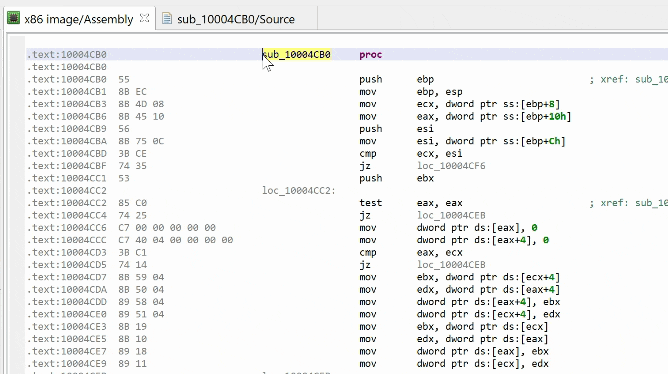
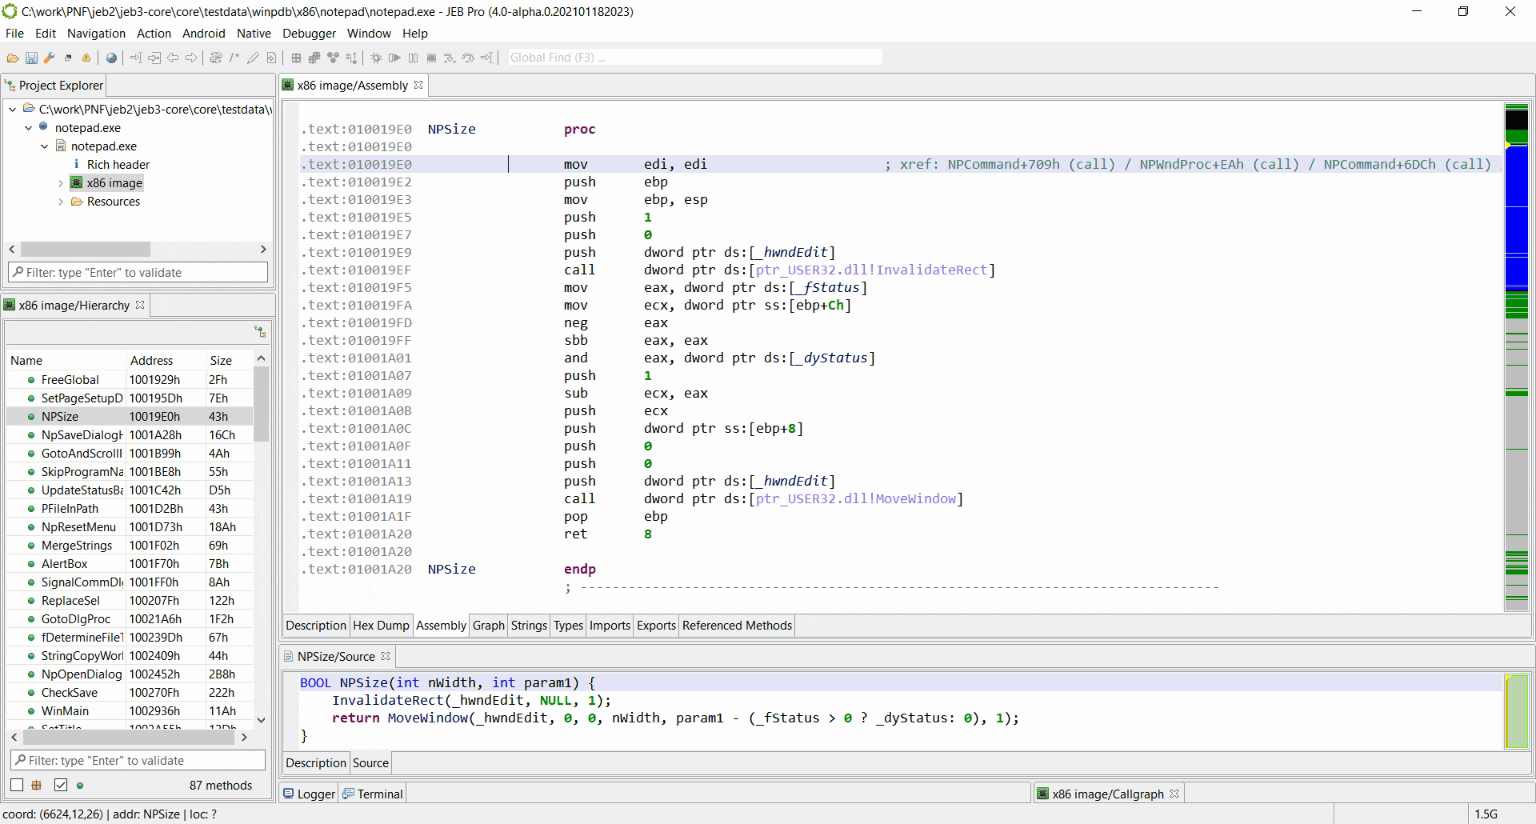
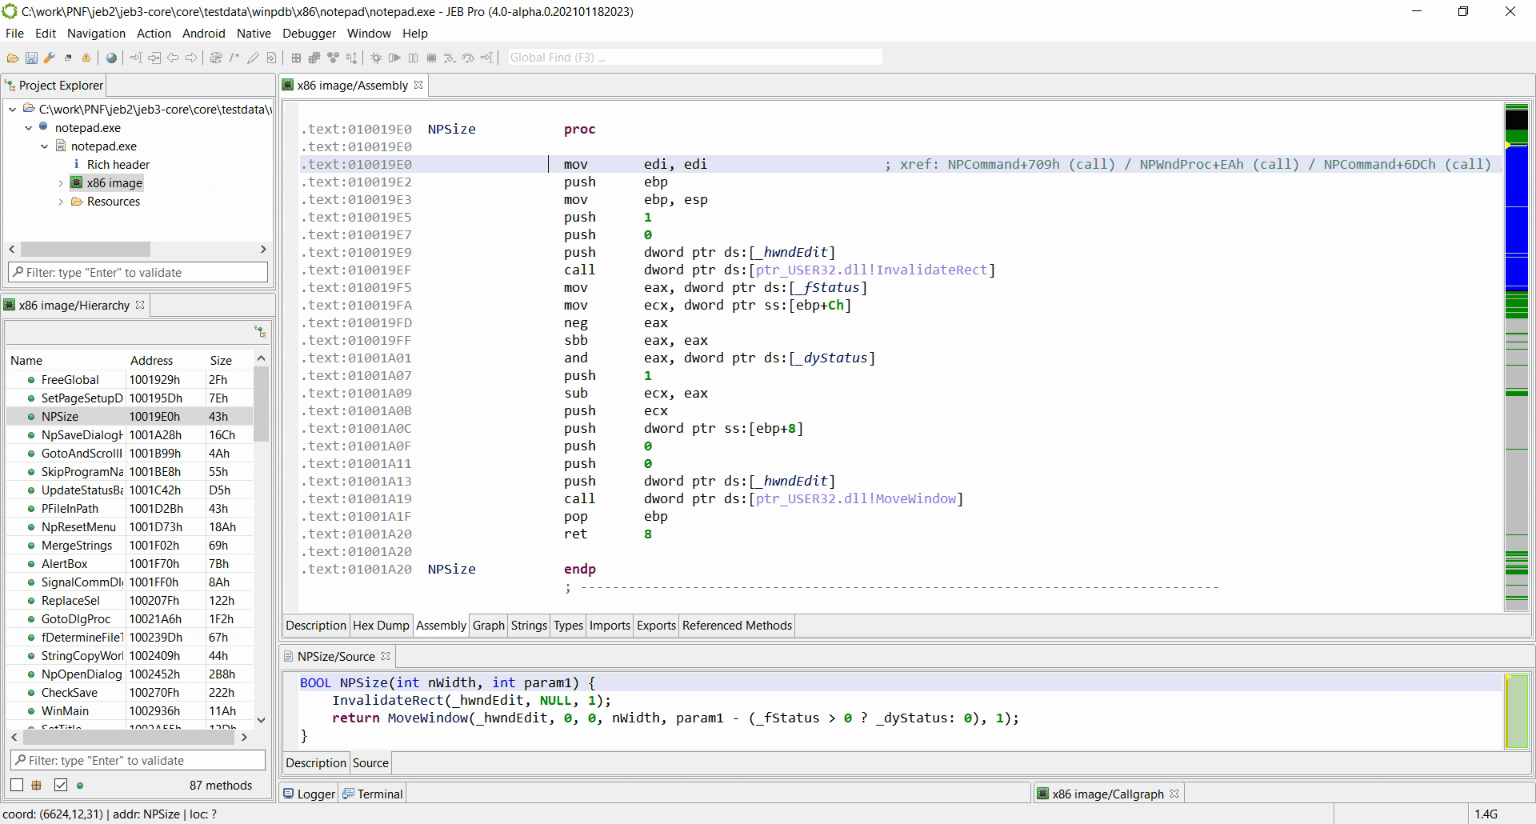
After an initial analysis pass, your main workspace will display an interactive disassembly listing, as well as a Project tree and a Code Hierarchy tree. You may navigate and modify your analysis via the Actions menu. If you are looking to decompile code, position yourself somewhere in the disassembly and hit the TAB key.
Decompiling#
In the Disassembly view, right-click and select Decompile, or use the Action menu, Decompile command. You can navigate back to the Disassembly in a similar way.
Check your Decompilers#
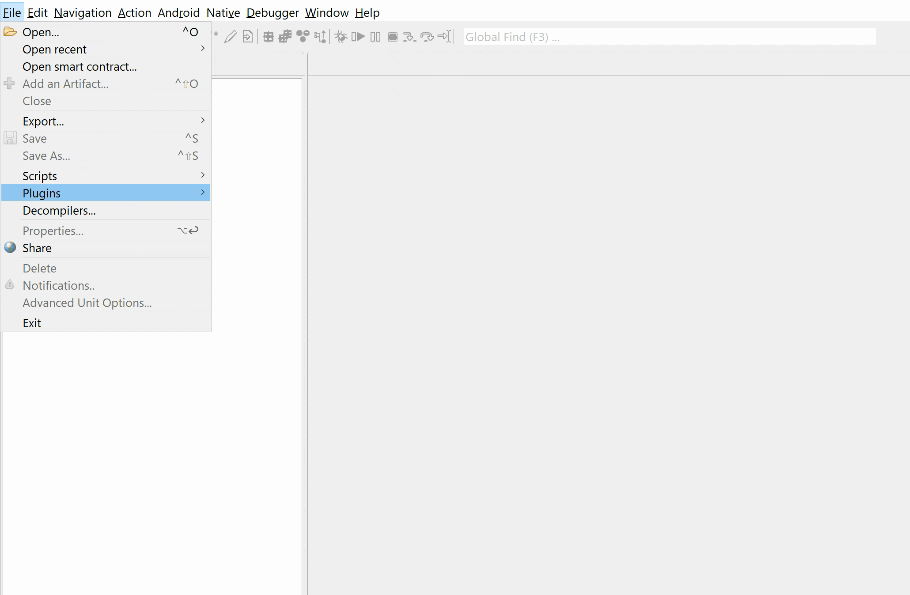
JEB decompilers are plugins. Check which decompilers ship with your build by using the File menu, Decompilers command. JEB Community Edition bundles the x86 decompilers. JEB Android ships with everything Android. JEB Pro ships withs everything. JEB Demo as well, but with several limitations.
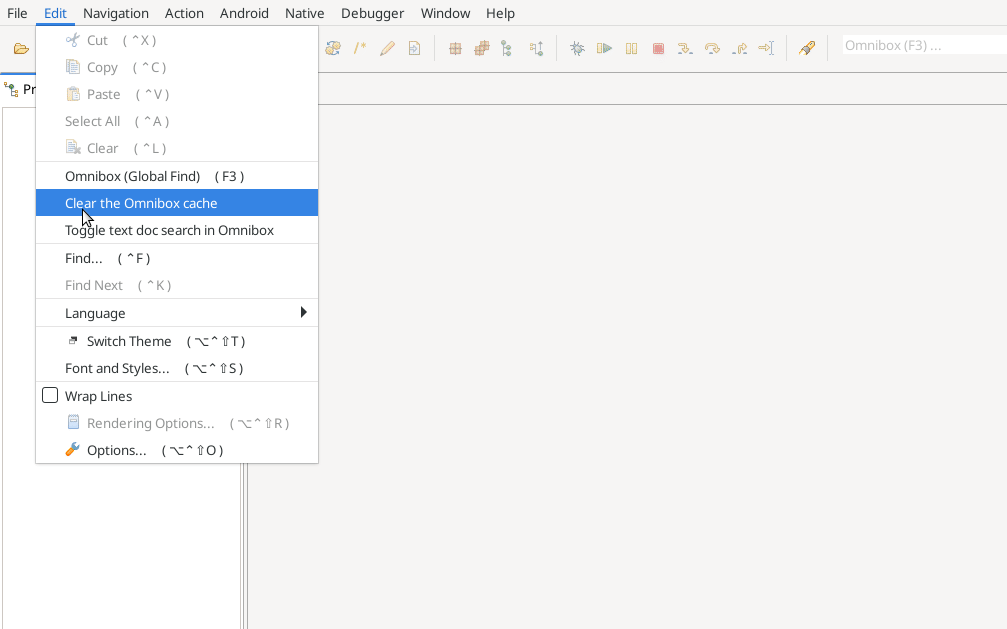
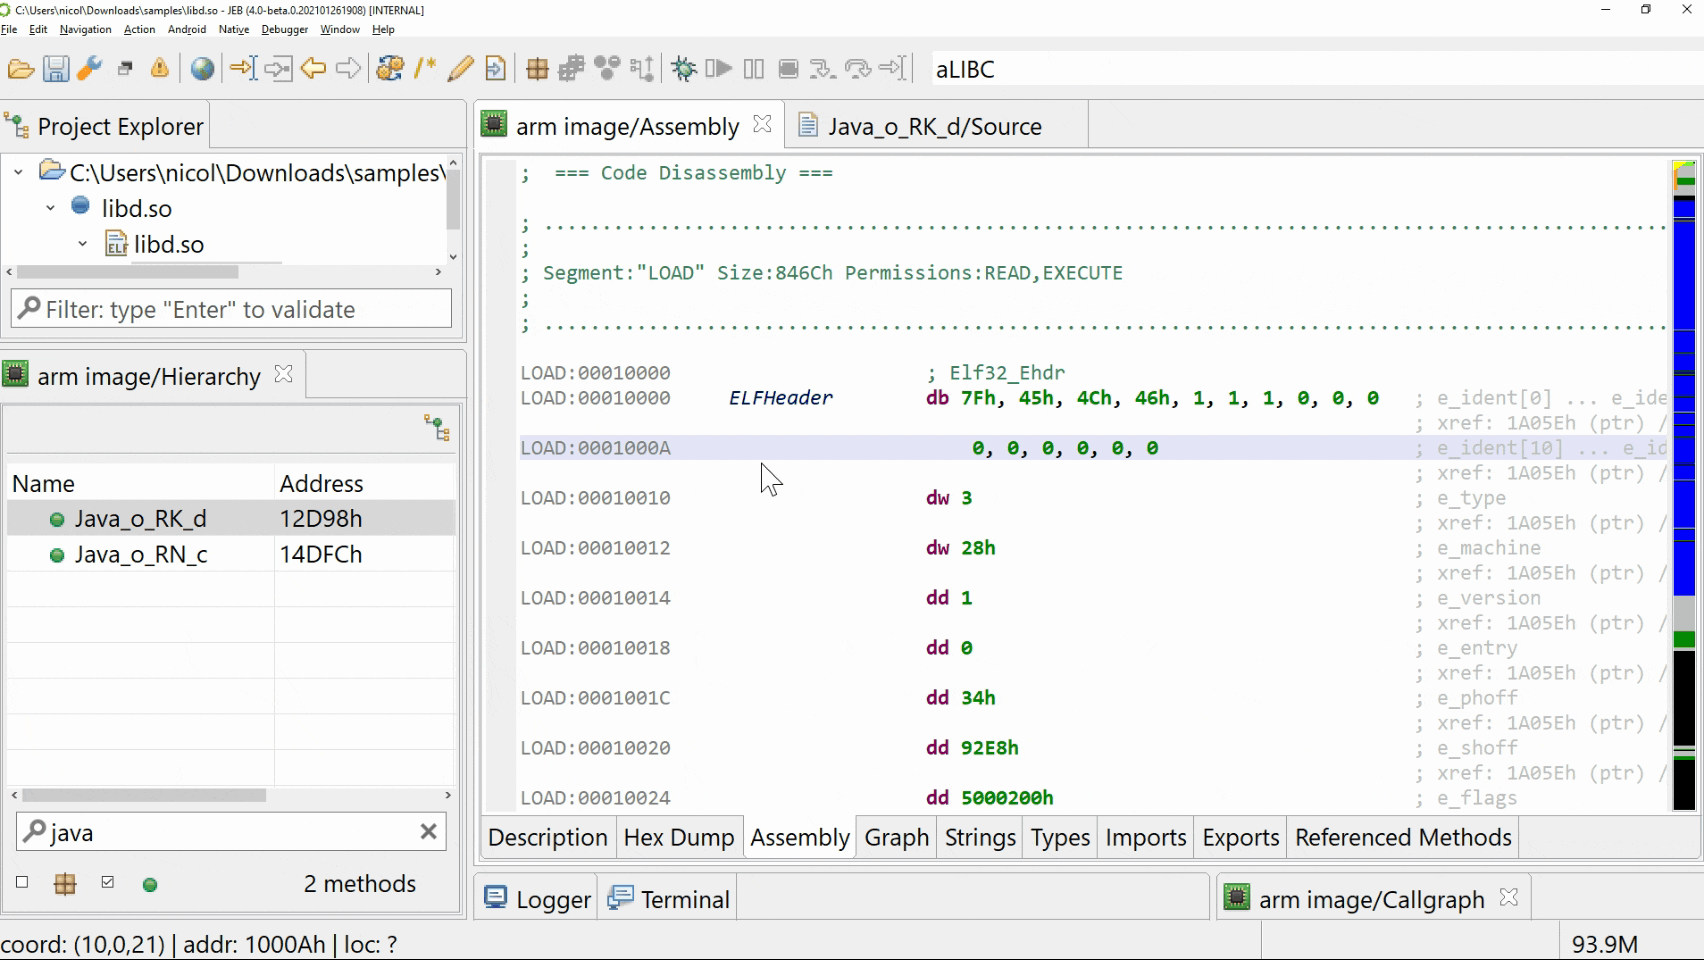
The Omnibox#
The omnibox is a text input box located on the right side of the toolbar (default hotkey: F3). It allows users to search and quickly visualize (and navigate to) any type of item referenced in your JEB project. From strings to code, comments, bookmarks, command names, and text contents. Type anything you can think of in this box.
Bookmarks#
Bookmark your favorite locations using the Control+F12 hotkey (Command+F12 on macOS). Your project-wide list of bookmarks is accessible with F12. These commands are also accessible from the Navigation menu.
Basic Reversing Actions#
Common analysis actions are located in the Action menu. They include decompiling, renaming items, viewing cross-references, adding comments, etc. Other actions, specific to a given class of files or analysis, are located in other menus (e.g. Android, Native, Debugger).
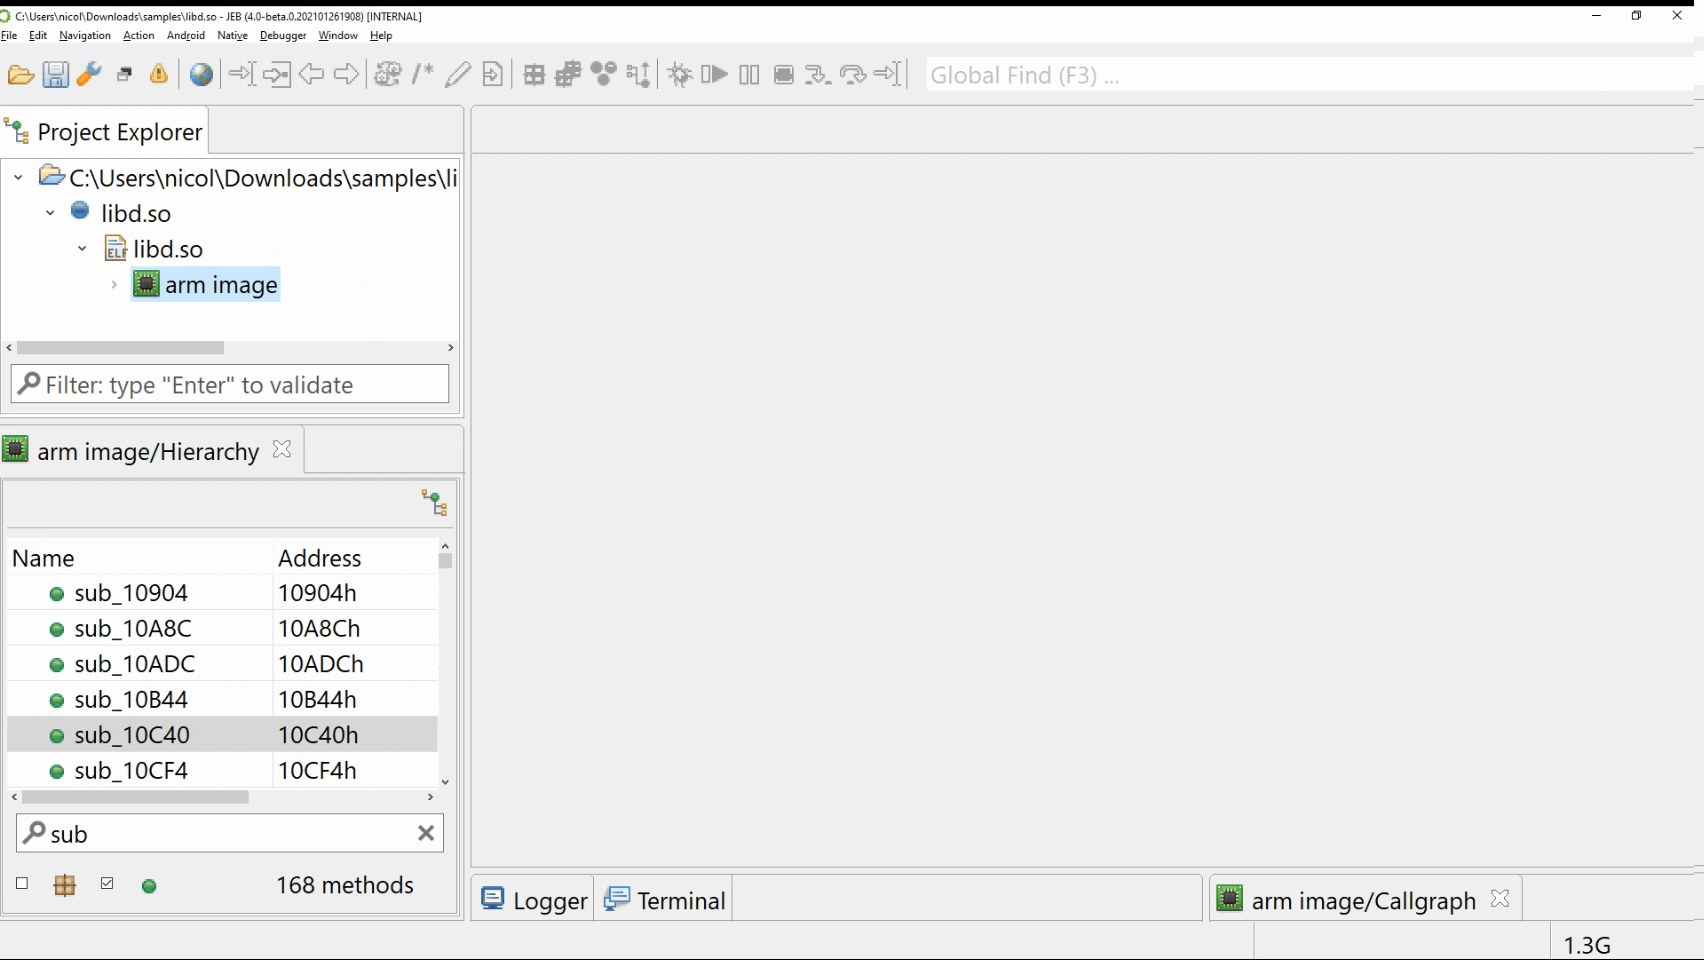
Units and Documents#
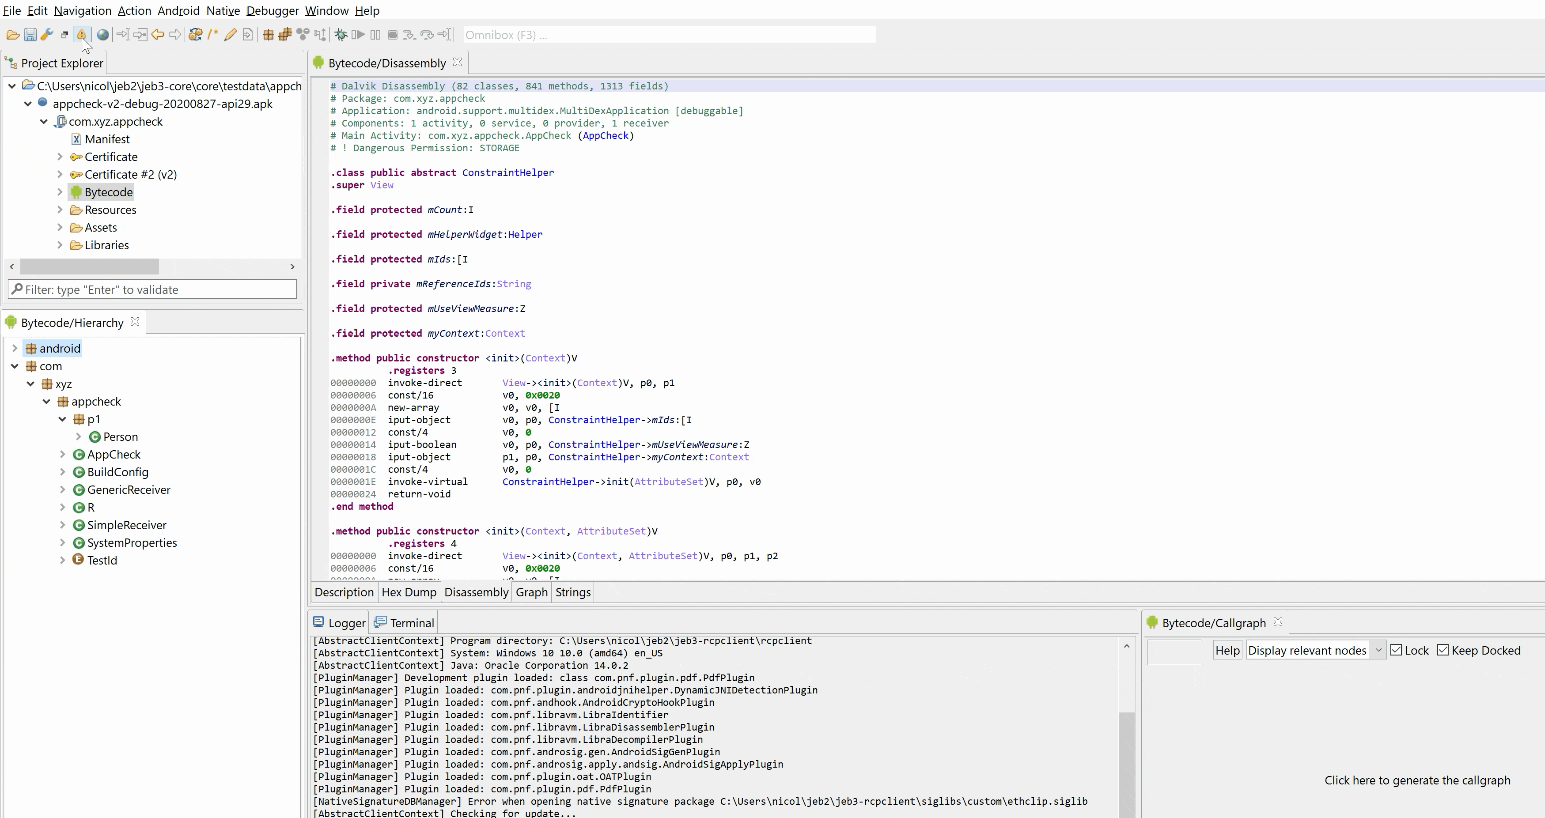
In JEB, the analysis of an artifact (typically, an input file) yields objects called "units". An artifact usually produces a tree of several units, including code units. Units can be rendered as documents, including text buffers, tables and trees. A code unit will generate a Disassembly document, among many other documents.
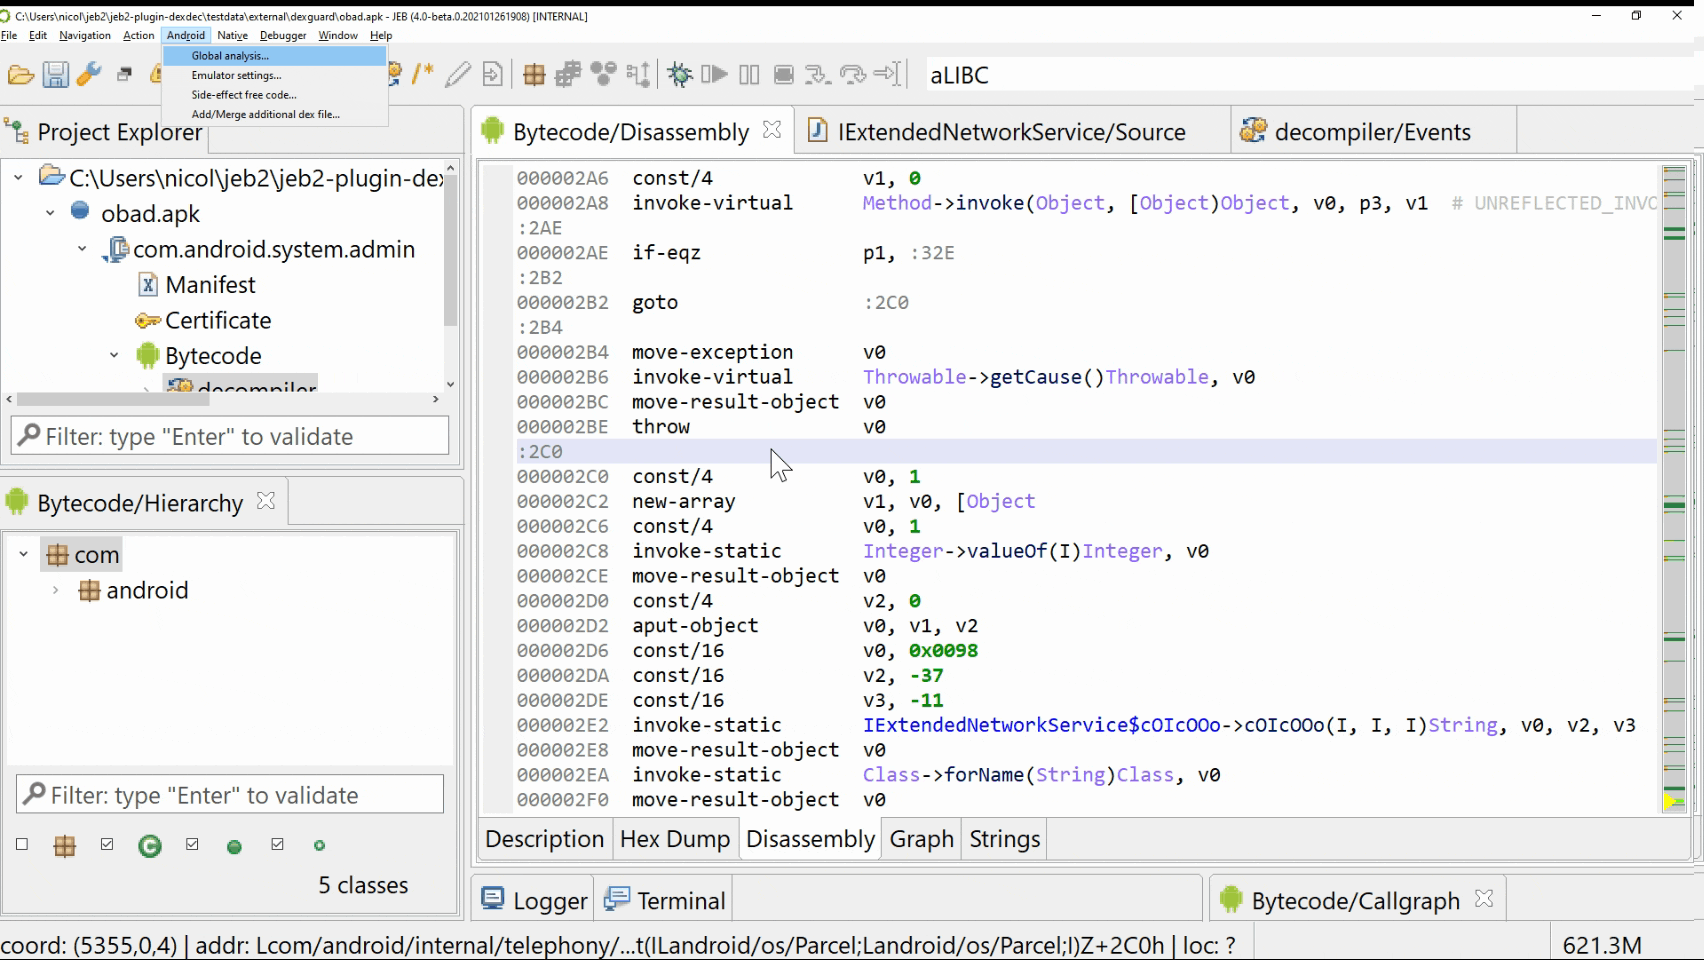
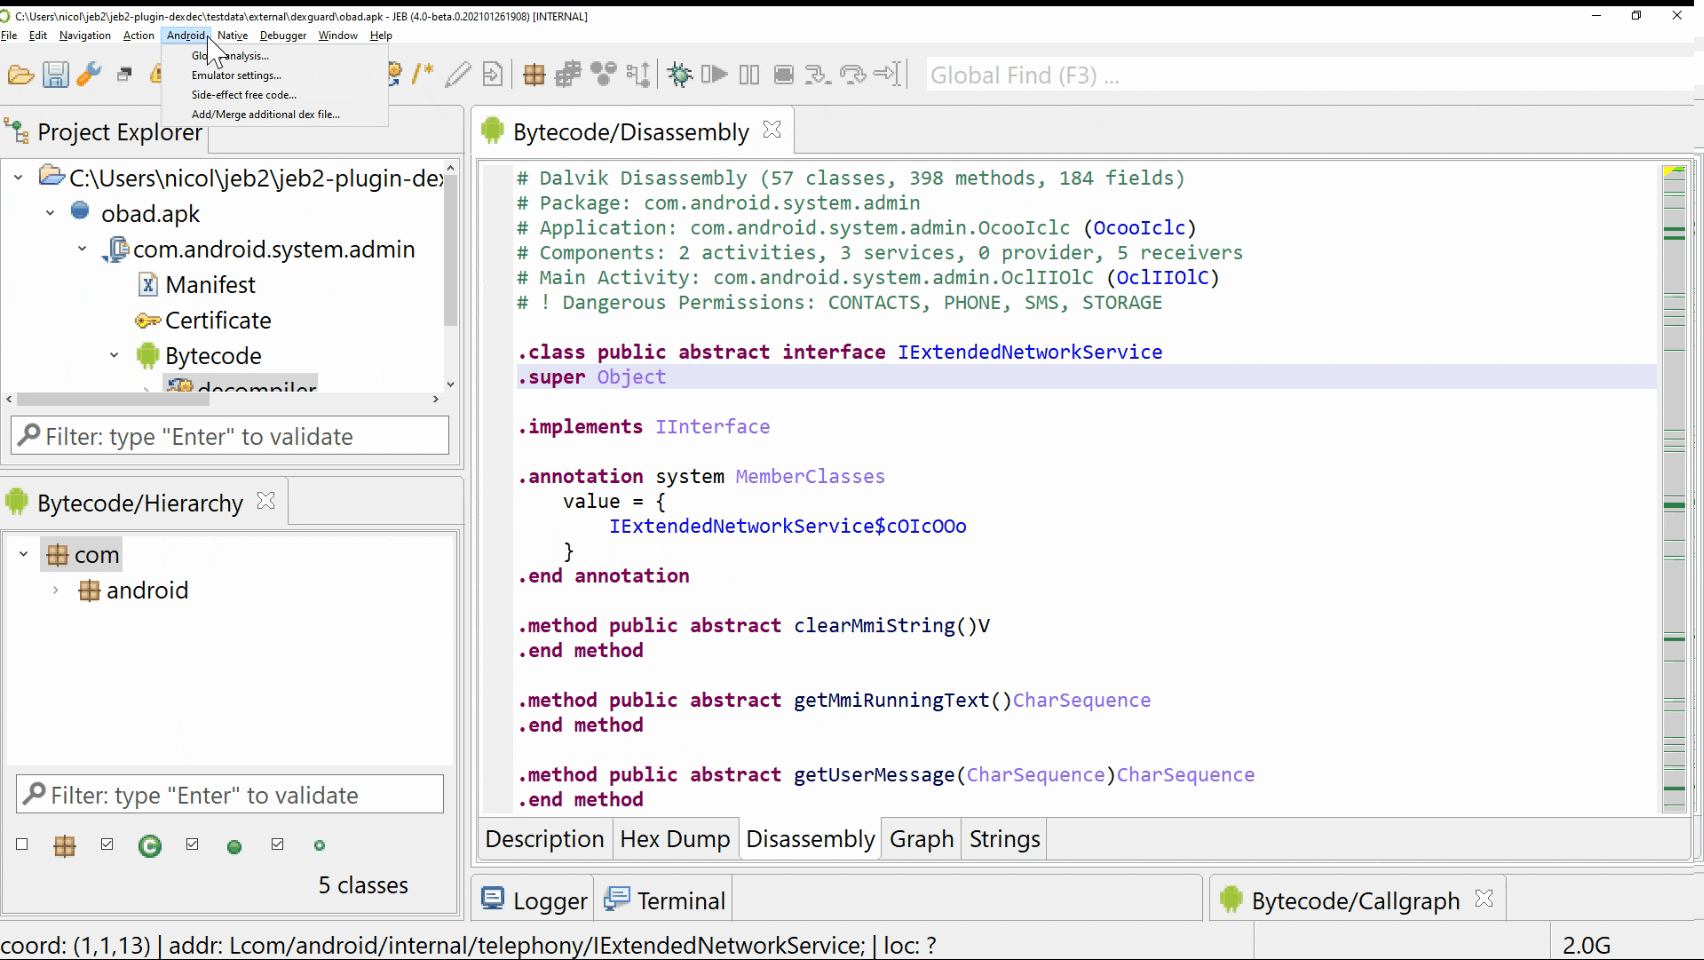
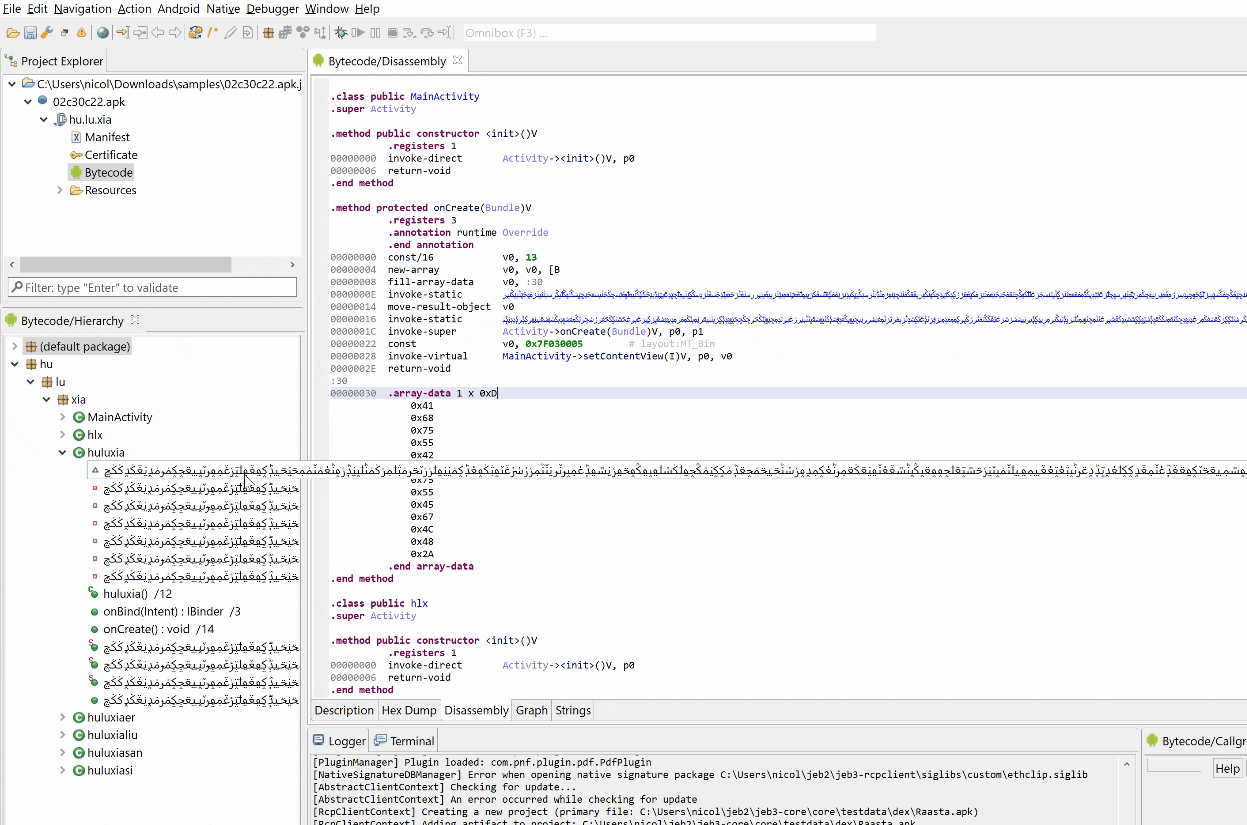
Android Global Analysis#
If you are analyzing an APK or Dex file, it is usually a good idea to run a Global Analysis pass. This analysis will use the decompiler, emulator, and sandboxing engine to find interesting things in the code, such as encrypted strings and constants or reflected accesses.
Customizing the Emulator used by the Android Global Analysis#
Check out the Emulator Settings command in the Android menu to customize the emulator and sandboxing engine policies and time-outs.
Android and Side-effect-free code#
This Android analysis setting allows you to specify a list of methods which are guaranteed to have no side-effect (e.g. no field update, directly or indirectly) outside of providing a return value. This list is used by some code optimizers to further enhance decompilations.
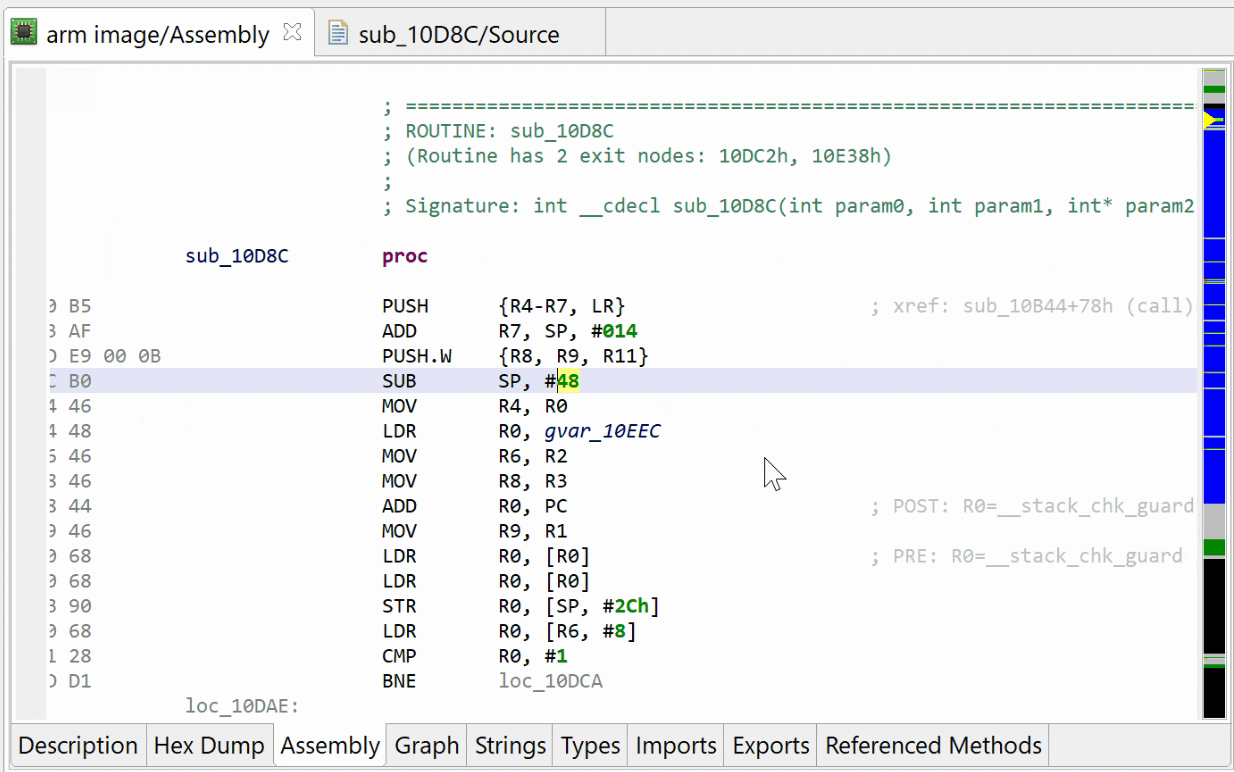
Control Flow Graph (CFG) View#
When located on a disassembled method, press the Space bar to switch from a flat listing to a CFG view of the method. Press Space to switch back to the listing view.
Multi-file Projects#
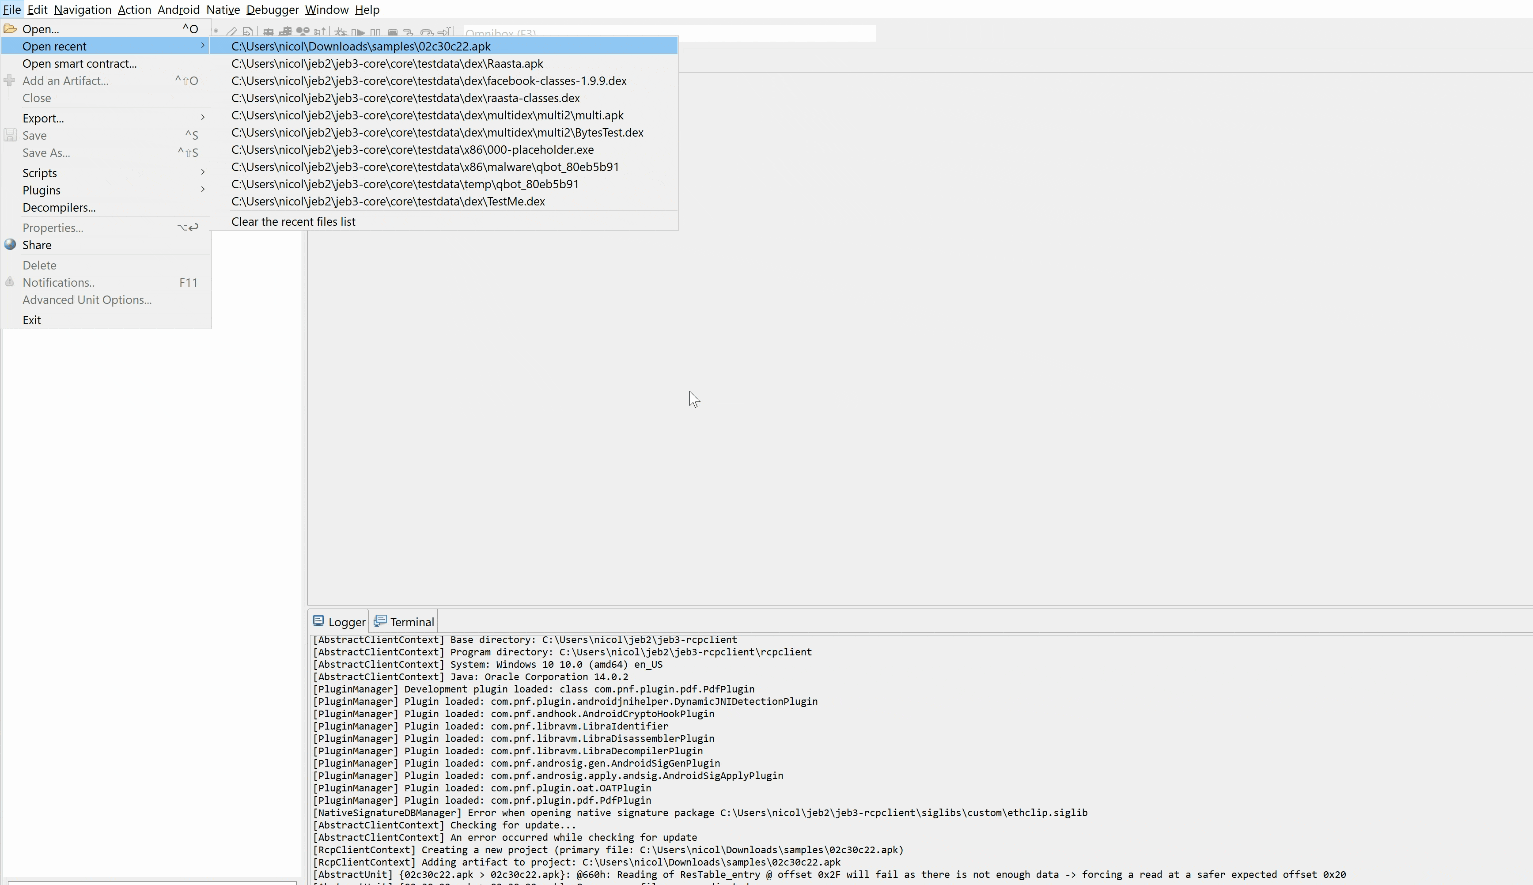
JEB can handle more than one file in a single project. The first artifact will determine your project name, but other artifacts can be added whenever needed via the File menu, Add an Artifact command.
Multi-format Support#
JEB handles any type of file, from raw bytes to PE to ELF to APK to DEX, but also archives, documents, etc. You can explore a file, its structure, and analyze its constituents using the Project Explorer panel.
Rebasing Constants#
Immediates can be rebased using the B hotkey (or via the Action menu, Convert command). Depending on the code unit, different bases will be offered, including decimal, hexadecimal, octal, character, or binary string.
Reopening a View#
If you ever close an important view, you can always reopen it by clicking on its corresponding unit in the Project Explorer view, right-click, then Open View command.
Exotic Decompilers#
Did you know that JEB can decompile all sorts of formats? From Android dex to the classic x86 and Arm, less classic Mips, but also more exotic ones like Ethereum smart contracts compiled to EVM bytecode, or WebAssembly modules.
Type Hierarchies#
When on a type object (class or interface), use the Action, Type Hierarchy command (hotkey H) to view the selected type hierarchy, such as super-types, sub-types, and implemented interfaces.
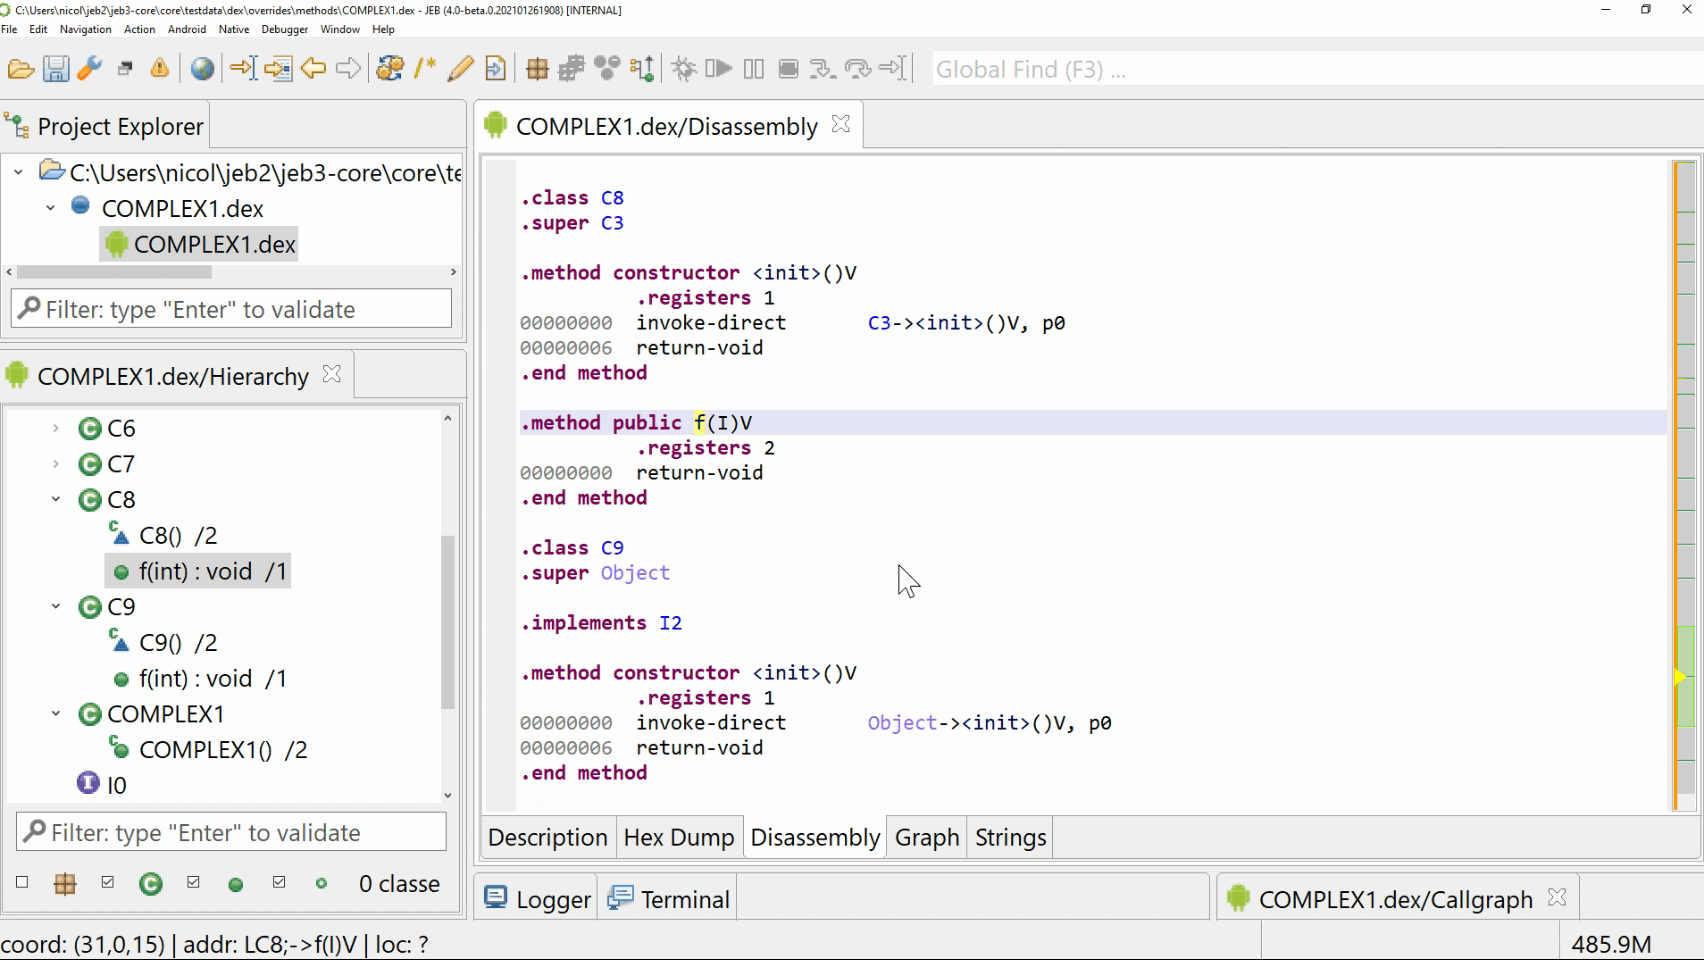
Method and Fields Overrides#
When on a method object, use the Action, Overrides command to check the implementations in sub-classes, as well as parent implementations in super types. The command also works for fields to see overrides (by name) in sub-classes.
Organize your Code#
JEB supports packages and namespaces. Create packages, move code objects (methods, classes, etc.) to them by drag-and-dropping inside the Code Hierarchy panel, or use the Action menu, Create a Package / Move to a Package commands.
This command, like all actions located in the Actions menu, is available for native code as well as dex code.
Analyzing Ethereum smart contracts#
The Ethereum plugins currently support the analysis of EVM bytecode contracts (ewasm contracts are also supported, with the help of the wasm plugins for JEB). Open a contract using the File menu, Open Smart Contract command. The contract node will be named "DecompiledContract".
Blanket Renaming#
The action "Auto-Rename All" allows the renaming of all or a selection of the items in a project. This action is very handy when analyzing an obfuscated file whose meaningless names create confusion.
One Decompilation, One Tab#
The "Do not replace Views" command, located in the Navigation menu, instructs the GUI client to keep tabs holding a similar view type to stay open when a different view of the same type is opened (else, the tab contents would simply be updated). It is handy when you need to have multiple decompilations opened in separate views.
Bulk decompilations#
If you need to decompile all code and export it to disk, check the File menu, Export Decompilation command. You will be able to select which part of your project should be decompiled and where it should be written to.
Notifications#
All plugins can issue sticky notifications that will be saved in the project (as opposed to pure log messages, which are not persisted). The notifications dialog can be opened from the toolbar or File menu. Double-click an entry or click Navigate to jump to the appropriate unit document and address (if the notification has an address attached to it).
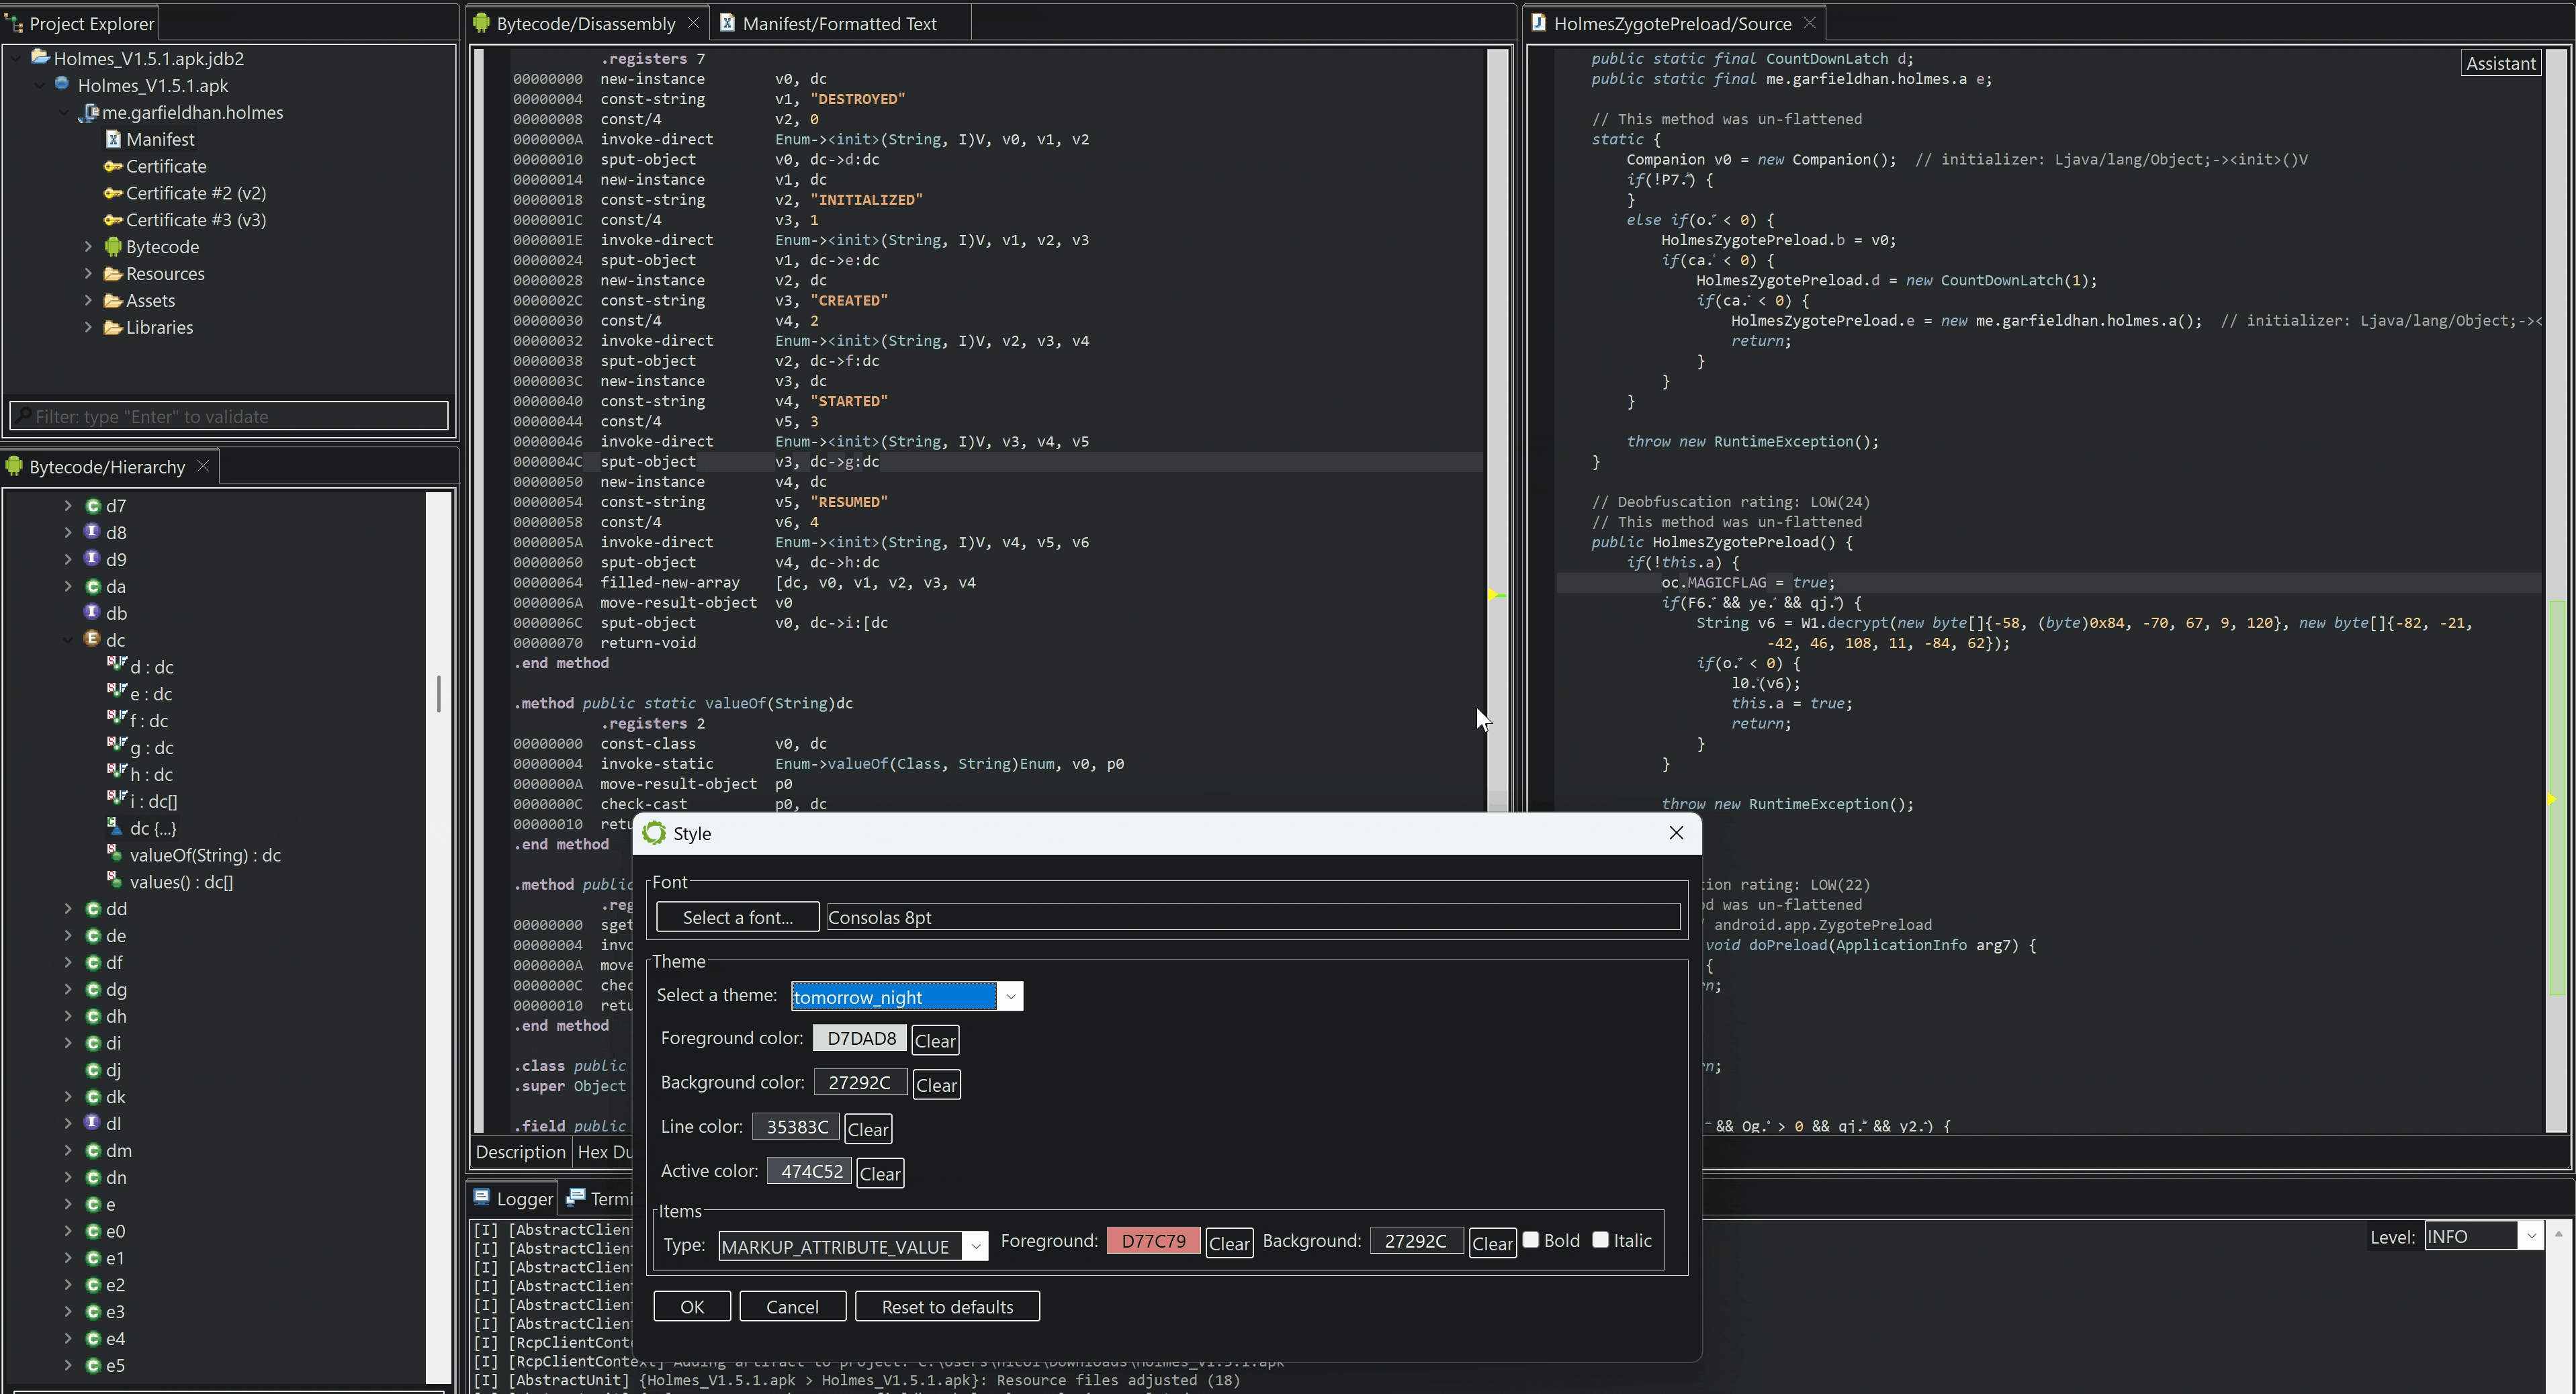
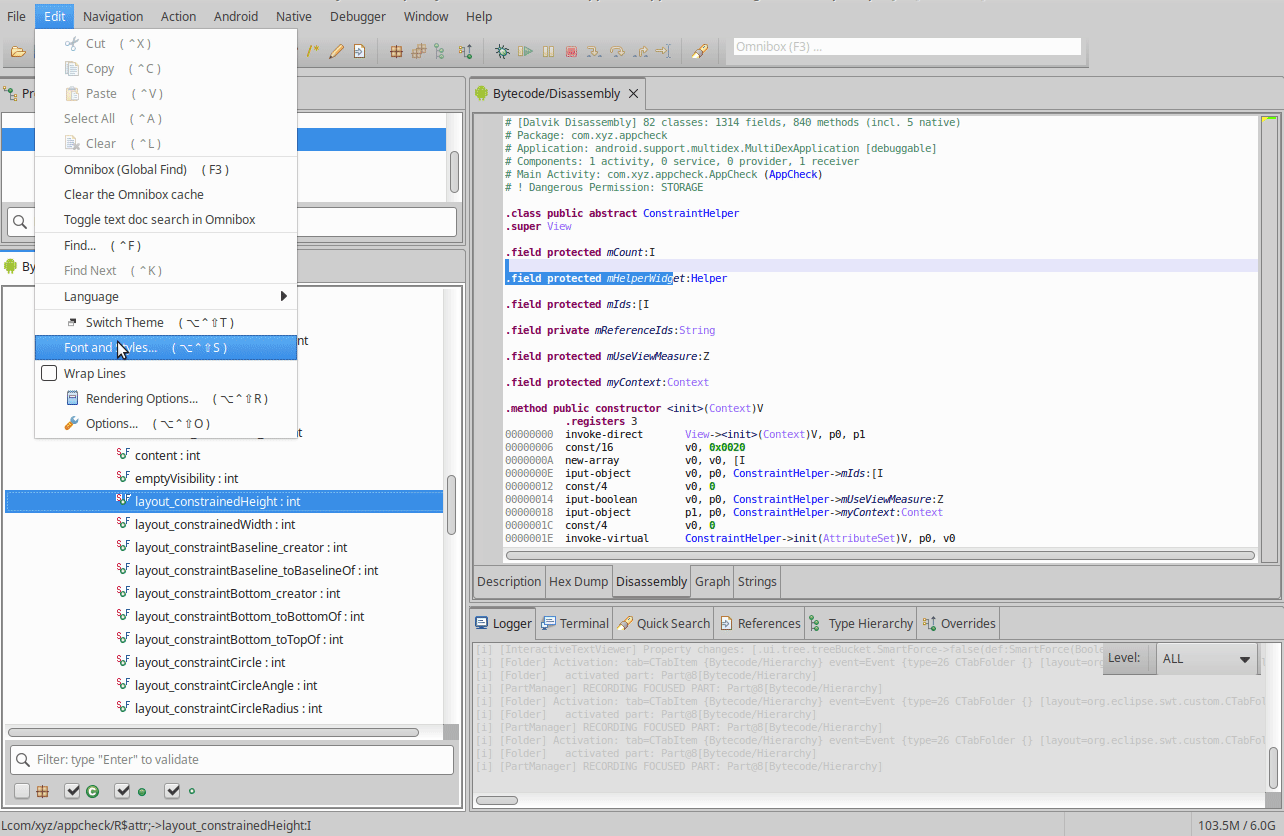
Dark Theme vs Light Theme#
You may switch themes via the Edit menu, Font and Theme handler. Several light and dark themes are available and can be customized.
Scripting in Python#
The JEB API is a comprehensive application programming interface used by JEB clients (including the main GUI program) to communicate with the back-end. Power-users can write JEB extensions that make use of the API to script tasks, have custom plugins, etc.
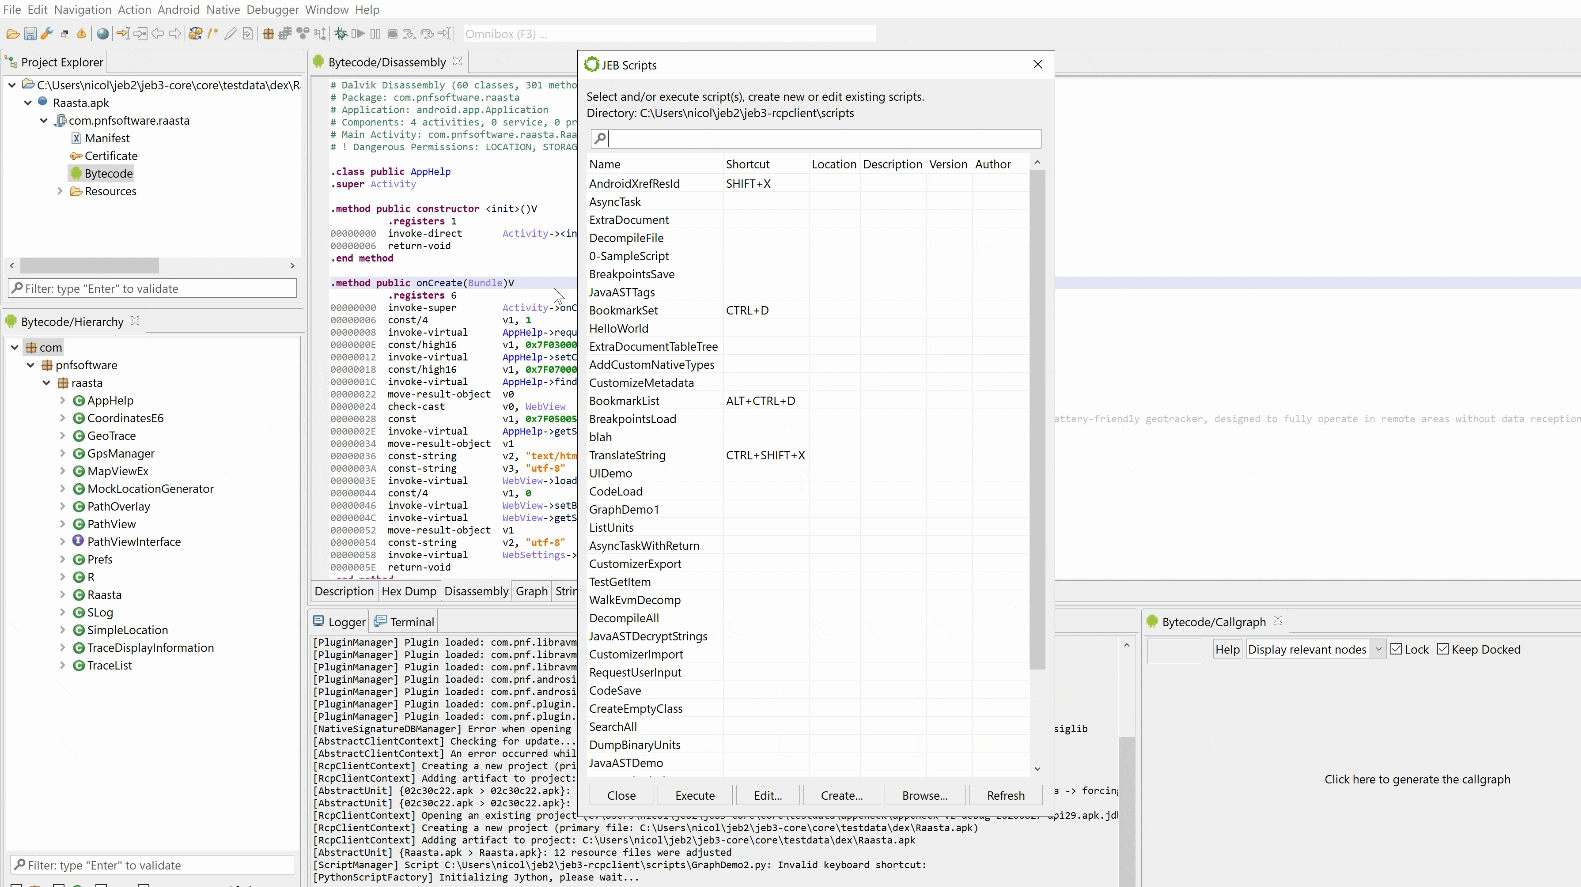
To get accustomed to the API, it is best to start writing Python script (2.7 syntax) doing relatively simple things. JEB ships with many samples, located in the scripts/samples/ folder. Bring up the Scripts selector dialog with F2. You can execute, create, or edit existing scripts.
In the example below, the UI API is used to create a custom graph object showing relationship between various code items in a code object.
Writing extensions in Java#
The JEB API is a comprehensive application programming interface used by JEB clients (including the main GUI program) to communicate with the back-end. Power-users can write JEB extensions that make use of the API to script tasks, have custom plugins, etc.
Unlike JEB Python scripts (see the previous tip), extensions written in Java can be loaded as full JEB plugins, that will live alongside other JEB plugins for as long as needed. Our GitHub repository provides several open-source plugins, such as a diem VM (move) decompiler or PDF parser.
Need more Tips?#
Press F1 at any time to consult the full Manual, either offline (it is bundled along with the API reference in your JEB's doc folder) or online if your workstation is connected to the Internet.
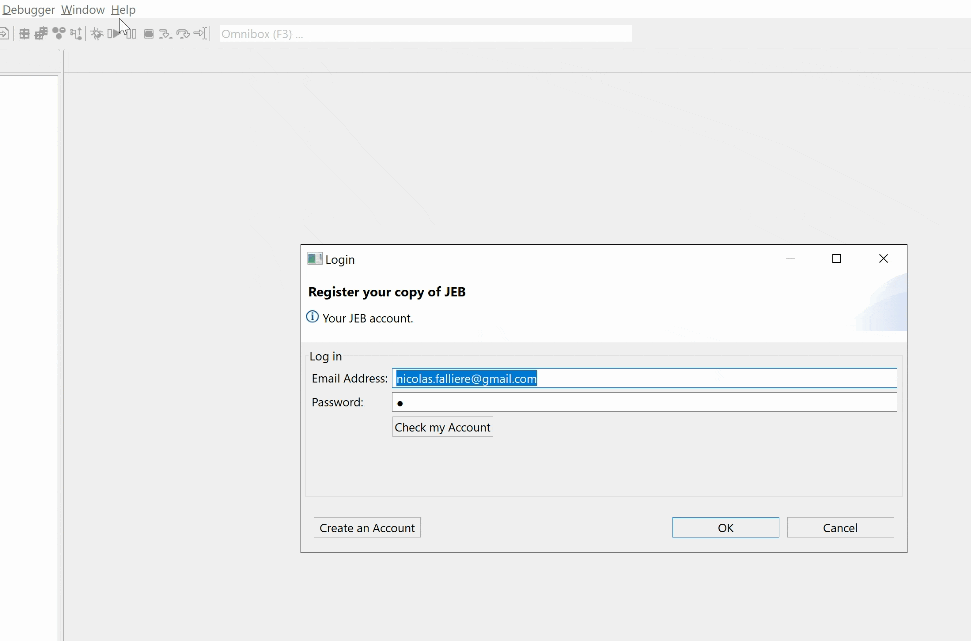
Register your Copy#
If you want to receive individual software update emails, make sure to register your software. The only piece of information we'll be storing is an email address. See the Help menu, Register command. (If your licensed build is an indivudual build, e.g. JEB Pro single-user, you may not need to register since you will be receiving email updates automatically.)
Getting the Preview builds#
We sometimes publish Release Preview builds, such as Beta builds, that will contain early fixes or features. If you wish to receive them, make sure to switch to the BETA or ALPHA update channel (located in the Help menu, Update Channel sub-menu).
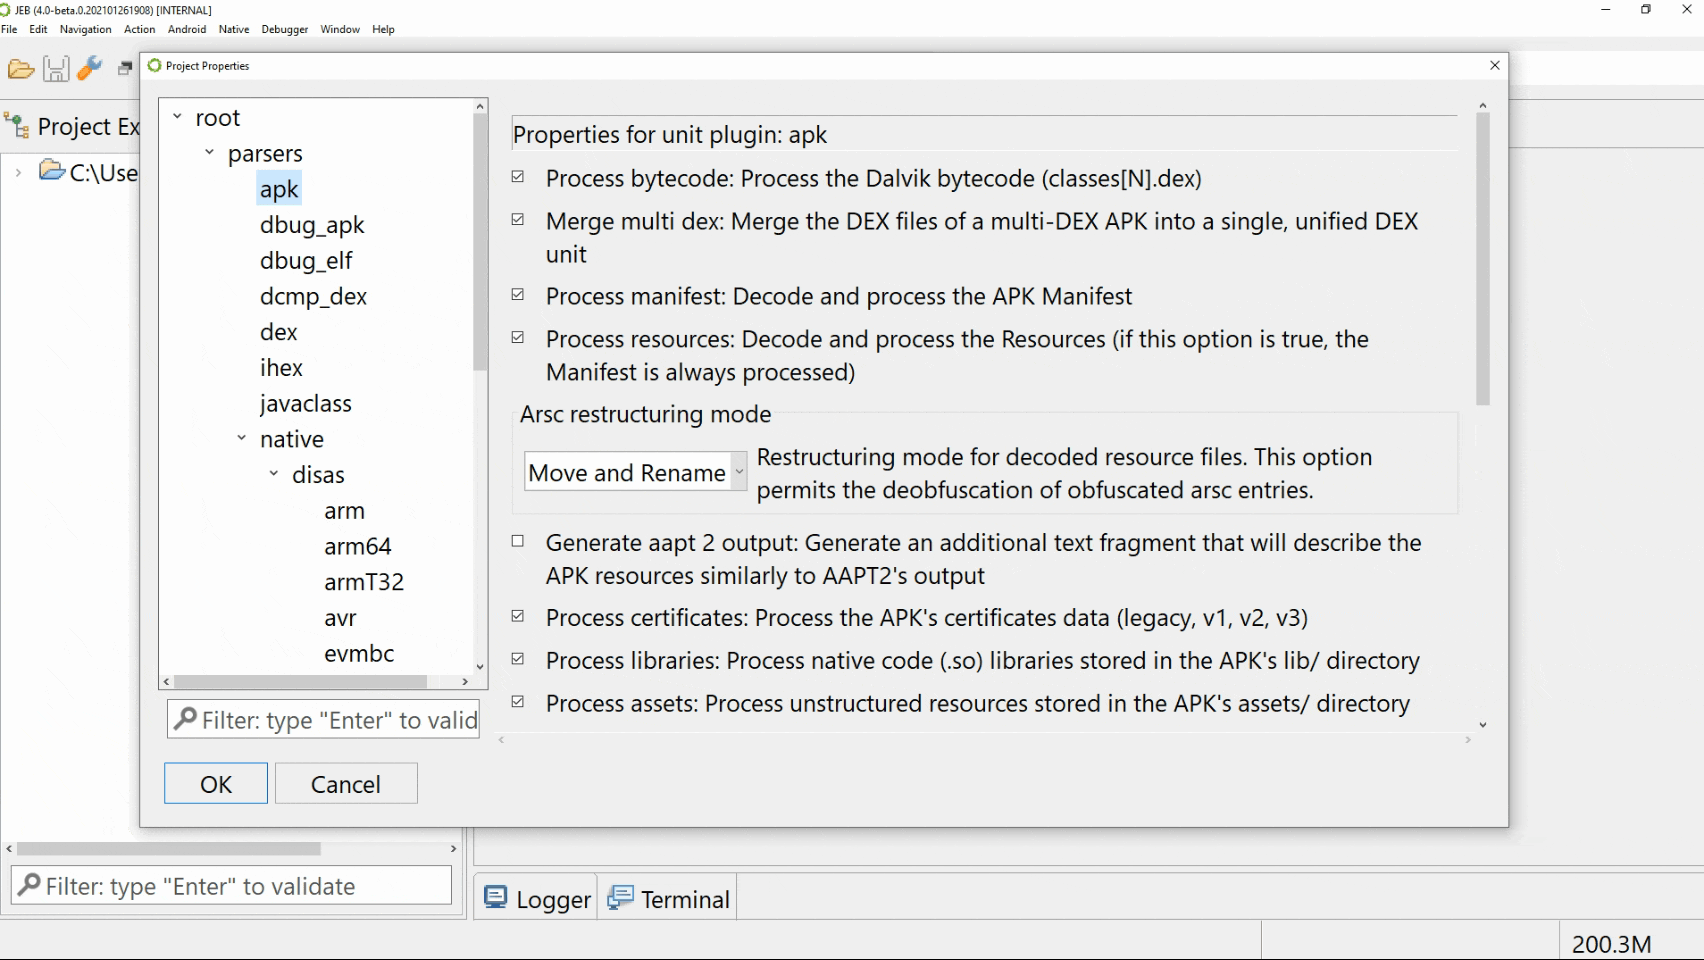
Set your Settings#
When you open a file for analysis, a Core Settings panel will open up. Advanced users should get familiar with that panel as it allows customizing many settings before kicking in the analysis of the file. The initially-selected tree node depend on your input file type, but you may customize any other settings.
Native Code Analysis Settings#
When analyzing native executables, you can customize JEB processing through "Engine Properties" panel. For example, you can provide a specific memory base address, or select which tail calls' detection method should be used.
Rendering Options#
In JEB's code views (assembly code, C code, ...) you can customize many rendering options on the fly with "Rendering Options" widget (available from "Edit" menu, or from contextual menu).
Signing Native Routines#
You can create signatures for native routines you analyzed, such that they will be automatically identified when you encounter them again (by loading the corresponding signature package). All modifications you made to the original routines will then be imported (names, comments, labels). Such signatures can be created from "Native" menu, or using default shortcut "S".
Replacing Immediates Constants by Field Constants#
Immediate can be replaced by fields using Action, Replace... You may use existing field constants, or create or attach values to existing fields.
Making a class anonymous#
Often times, obfuscators remove annotations and other hints indicating that a class is an anonymous member of a method. Dex units support manually anonymizing classes, either via scripting or using the GUI client.
To make a class anonymous using the GUI client: in the code hierarchy, drag the class item node and drop it onto the target method item node. If it is deemed possible, the class will be made anonymous. Make sure to redecompile the target method (or its containing class) to see the updated result in decompiled code.
Highlighting interesting code#
Use the Action menu, Toggle Highlight command (hotkey: Ctrl+M on Windows/Linux, Command+M on macOS) to toggle line highlights on and off. Like everything else, highlights can also be accessed programmatically (they are stored in unit metadata groups) and can be set via scripts, e.g. to automatically highlight areas of interest and make them pop-out during a quick visual pass.
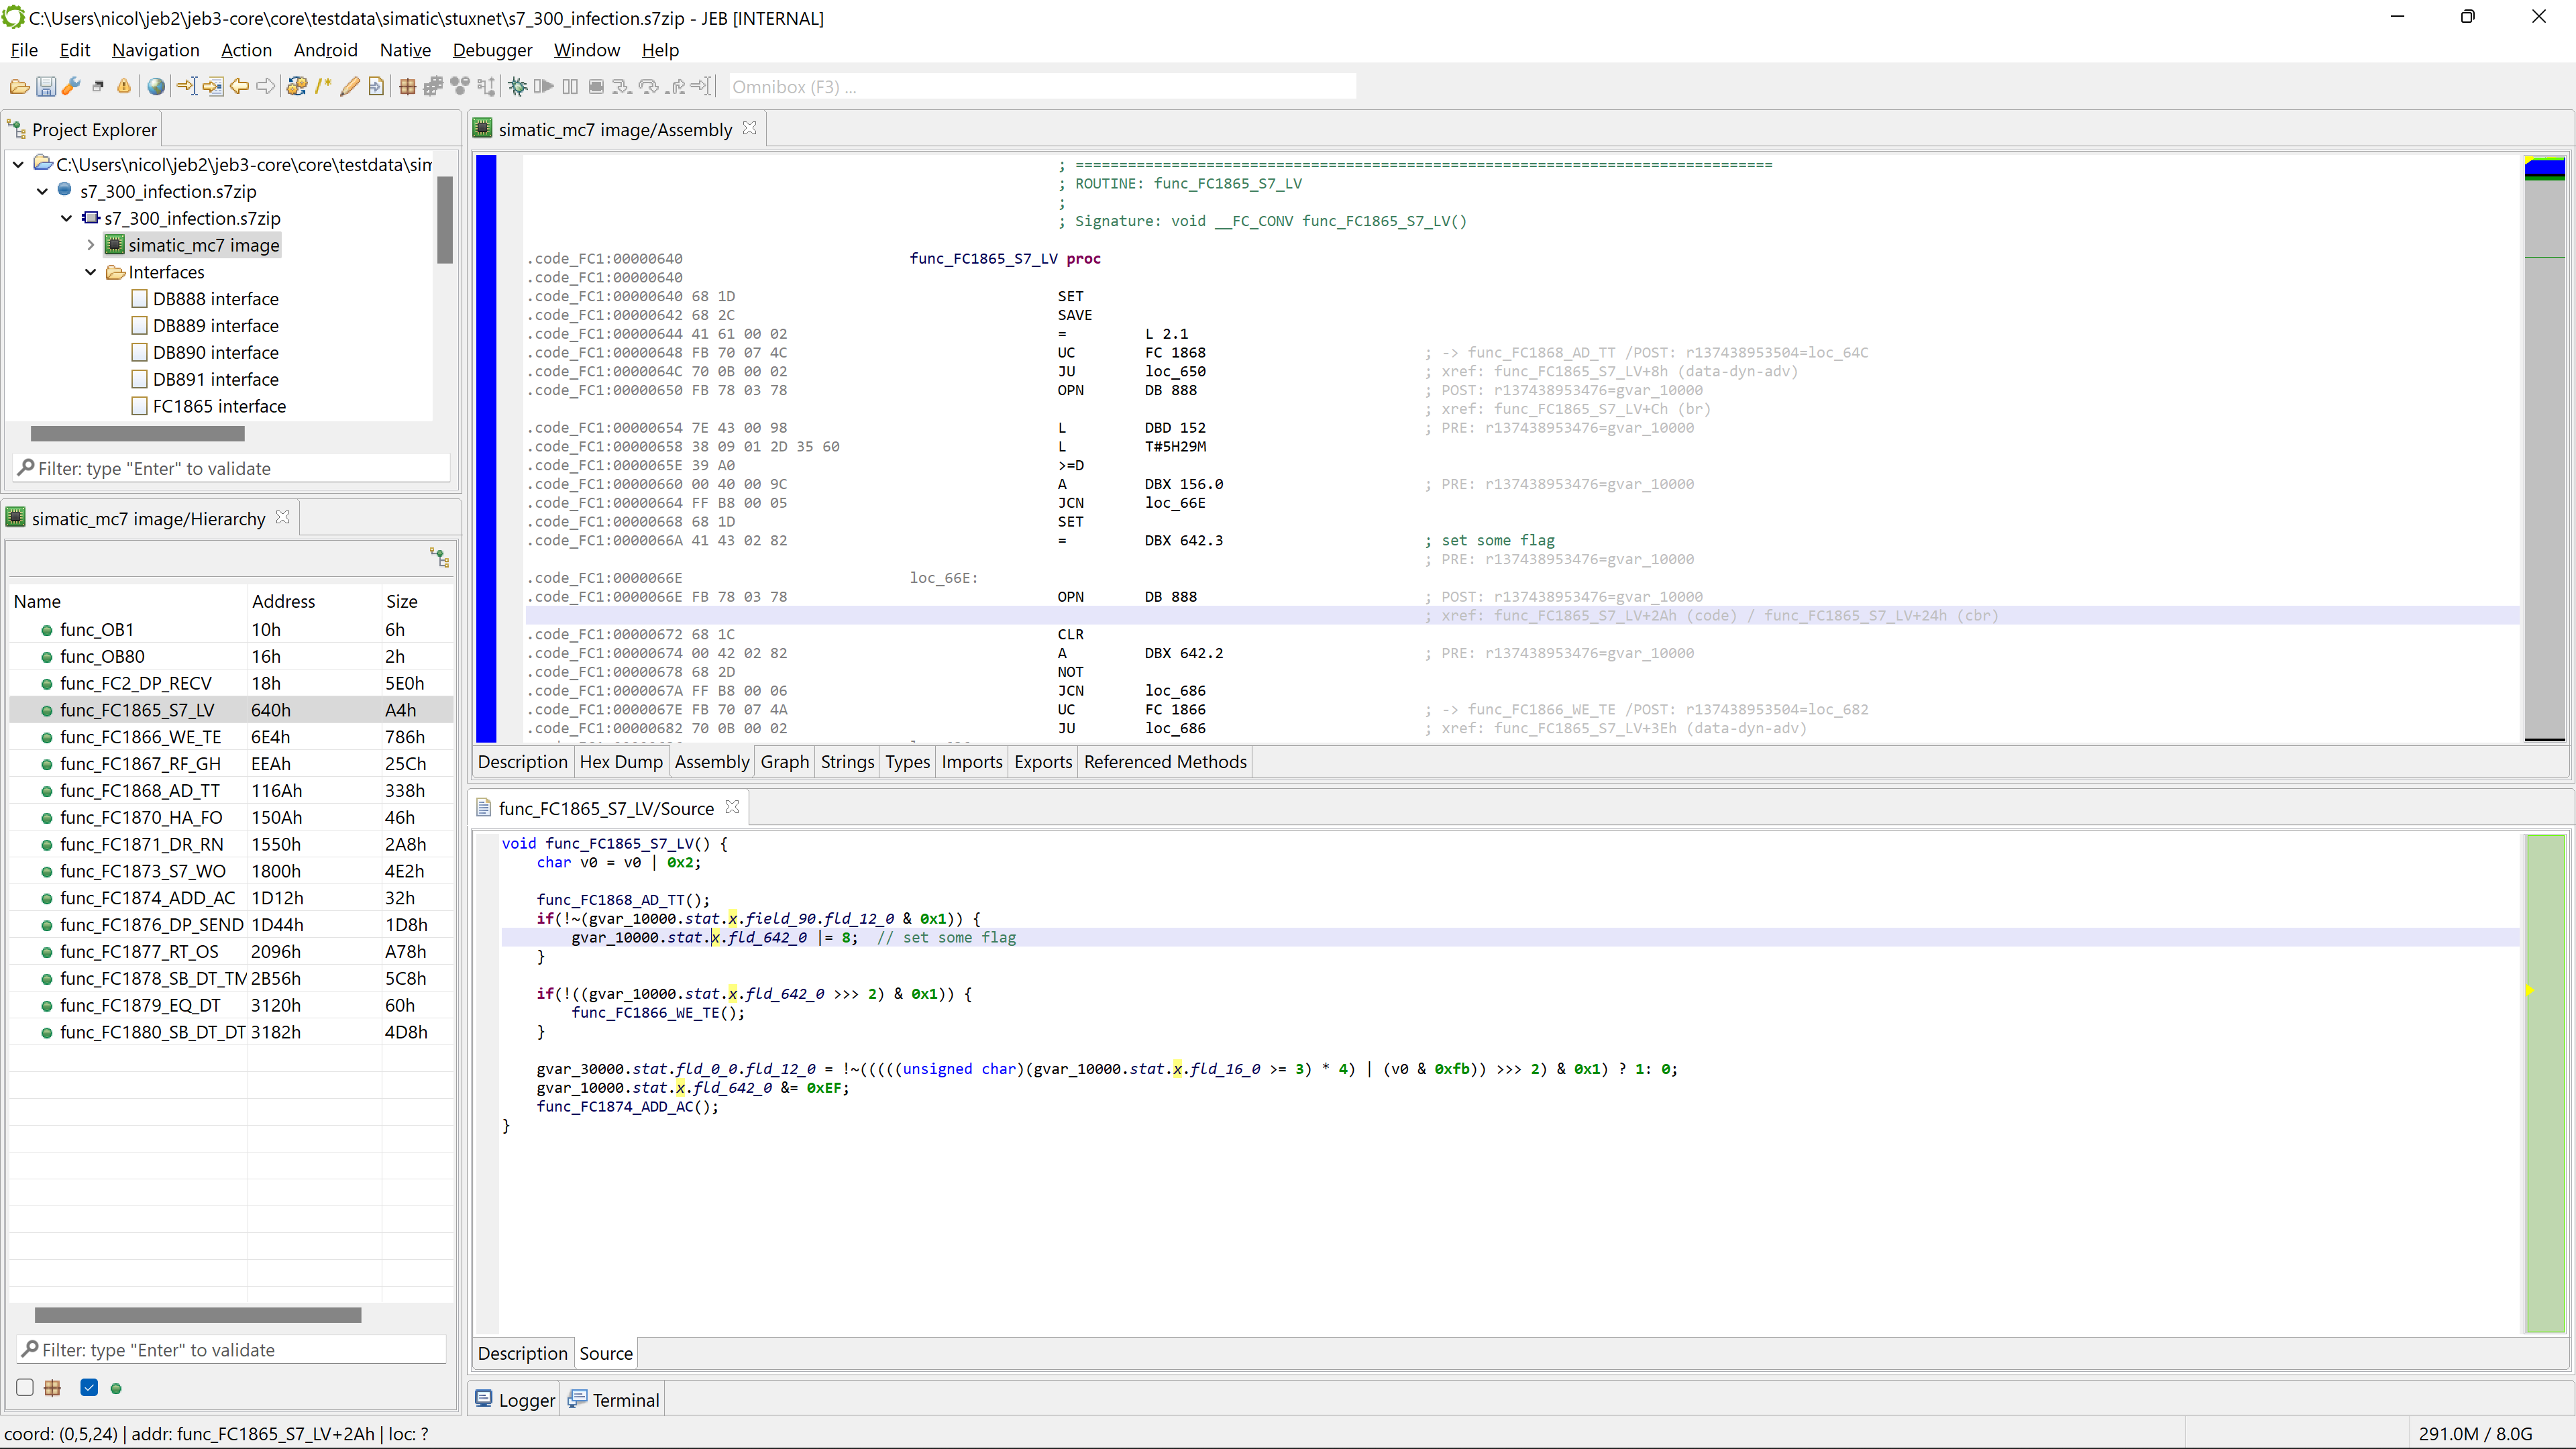
Reversing Simatic S7 PLC Programs#
JEB Pro ships with extensions to acquire, analyze, disassemble, and decompile S7-300/S7-400 PLC programs. Acquire blocks via File, Acquire Simatic S7 Blocks or pack PLC blocks in a zip archive with the '.s7zip' extension. We encourage users to visit our blog to read up on reverse-engineering S7 blocks and learn about how to use this JEB extension: https://www.pnfsoftware.com/blog/reversing-simatic-s7-plc-programs
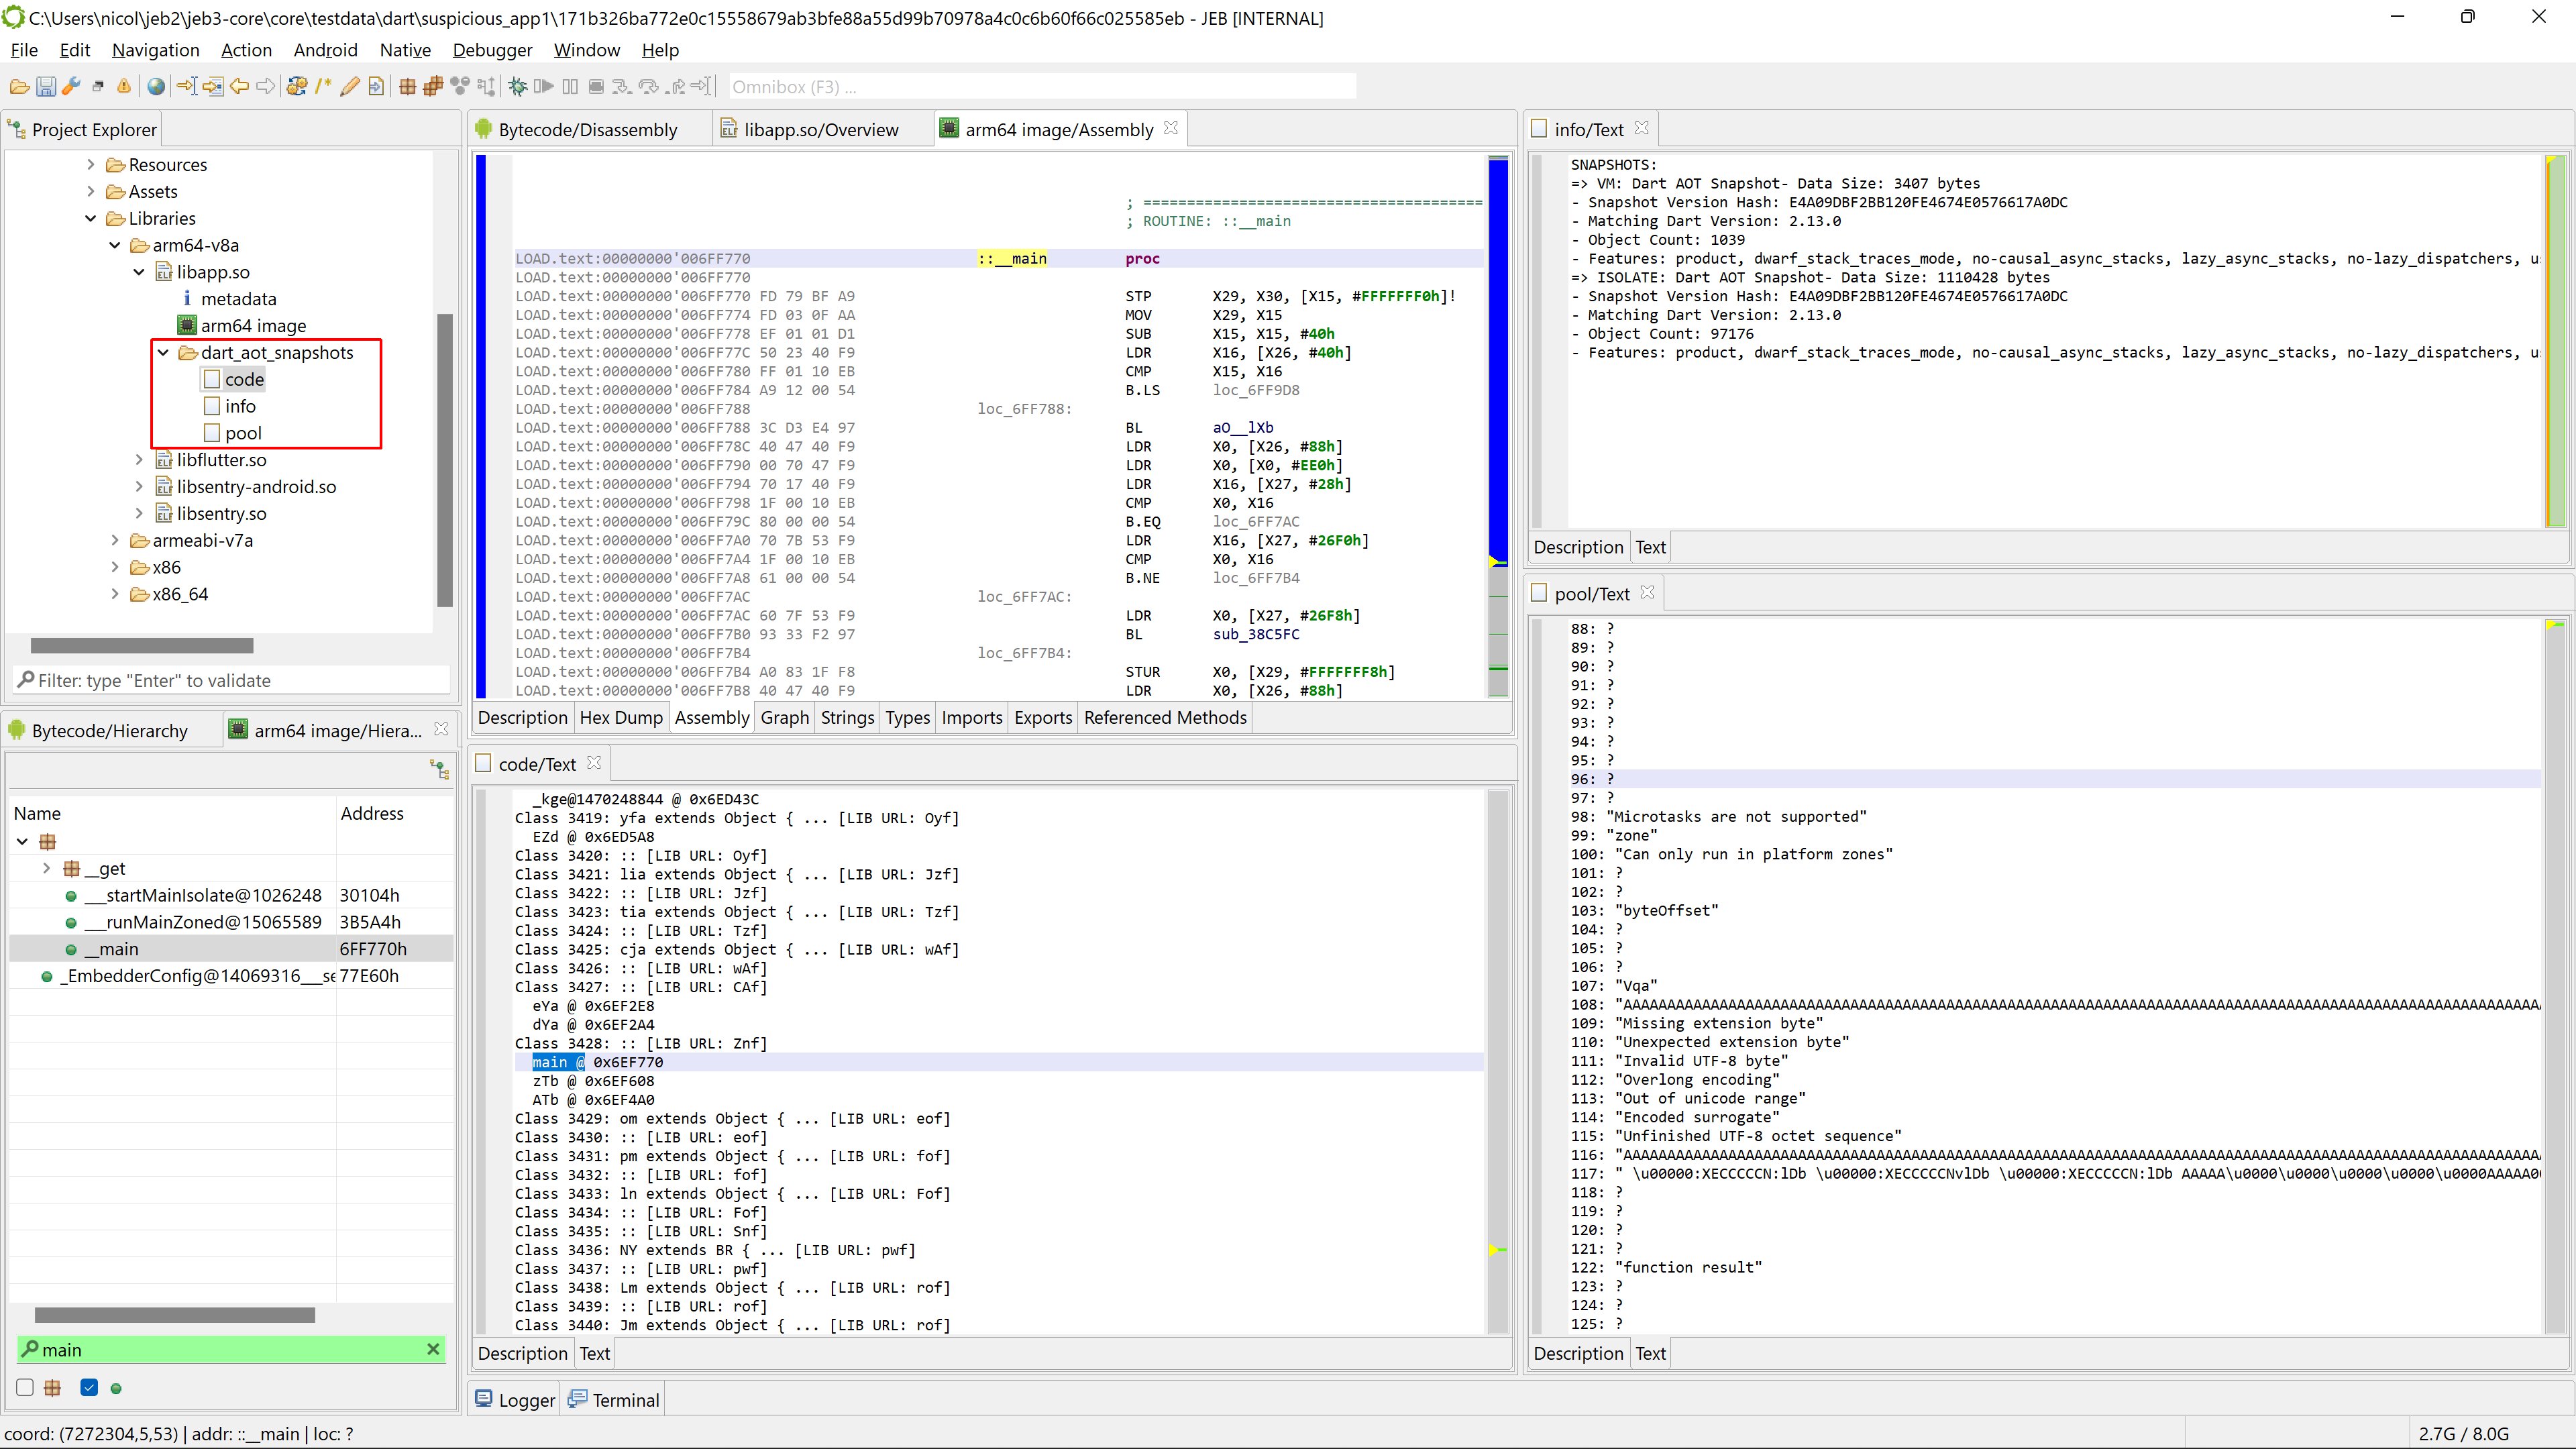
Reversing Dart AOT Snapshots and Flutter apps#
JEB 4.17 ships with a Dart AOT (ahead-of-time) binary snapshot helper plugin to help with the analysis of pre-compiled Dart programs. A common use case for it may be to offer directions when reverse engineering Flutter apps compiled for Android x86/x64 or arm/aarch64 platforms. See our blog for more details.
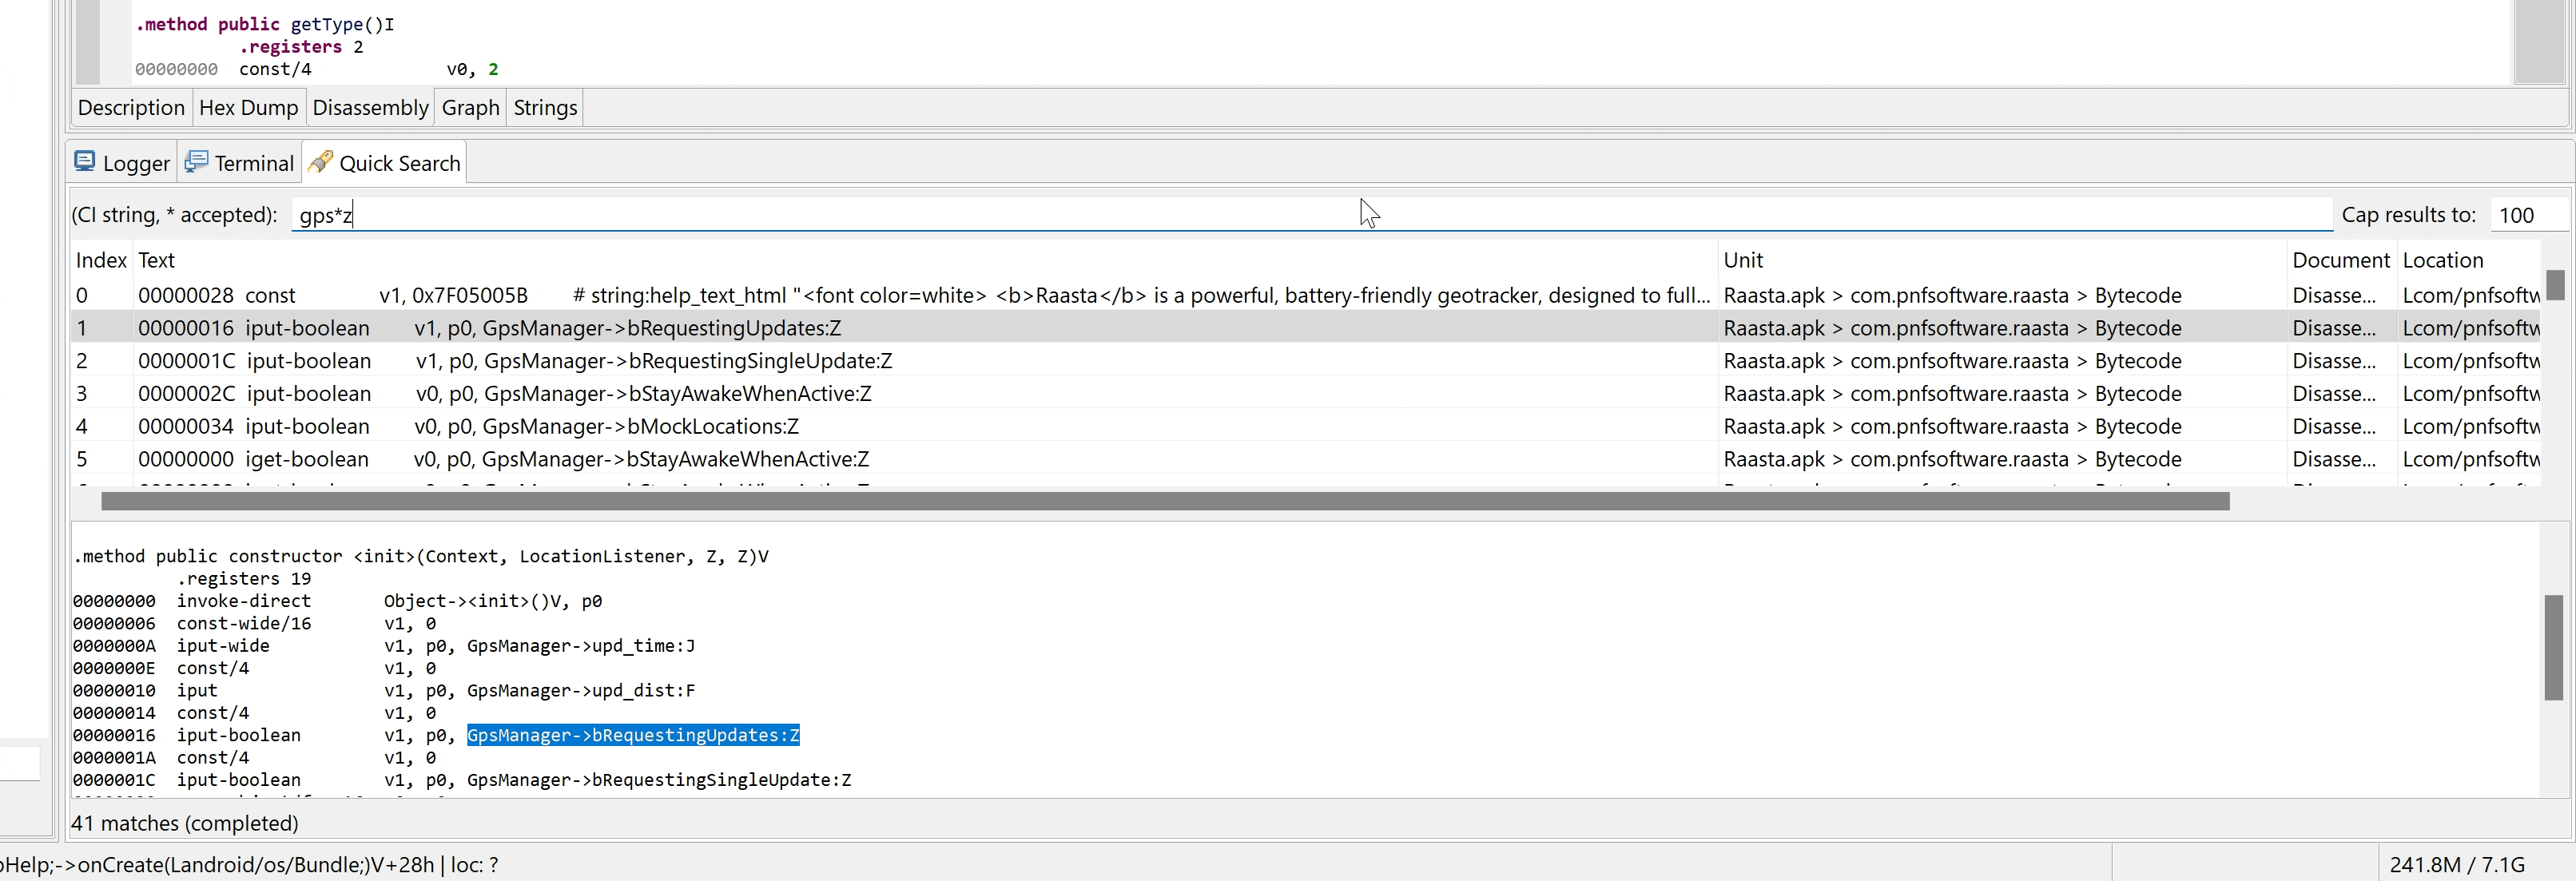
Interactive Quick Search#
Press CTRL+Q to focus the quick search panel. It can be used to perform fast searches in text documents generated by all the units of your project.
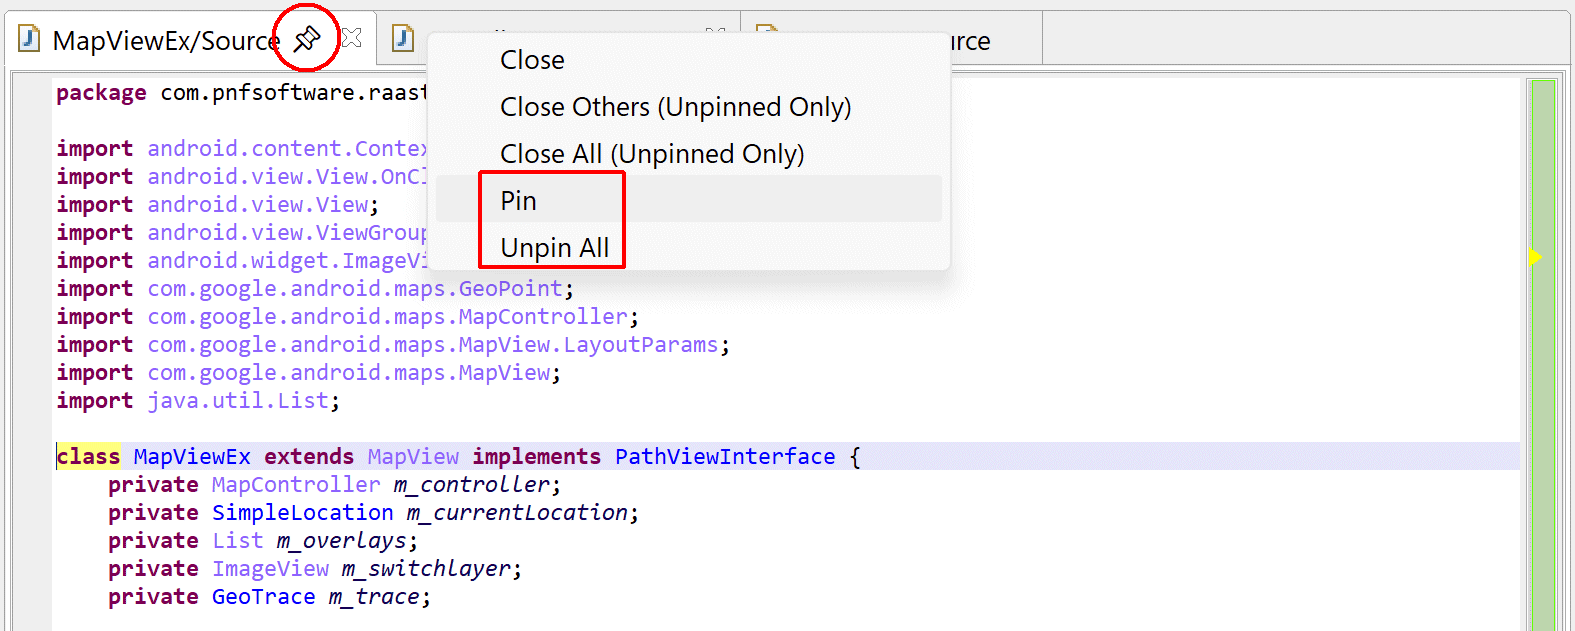
Pinned Tabs#
As your workspace grows larger, pin your most important tabs by right-clicking on the tab and selecting Pin. Pinned tabs are kept on the left-most side of their Folder containers, and are not closed on a Close All or Close Others action.
Limitation: Currently, the pinned status of a tab is not saved in JDB2.
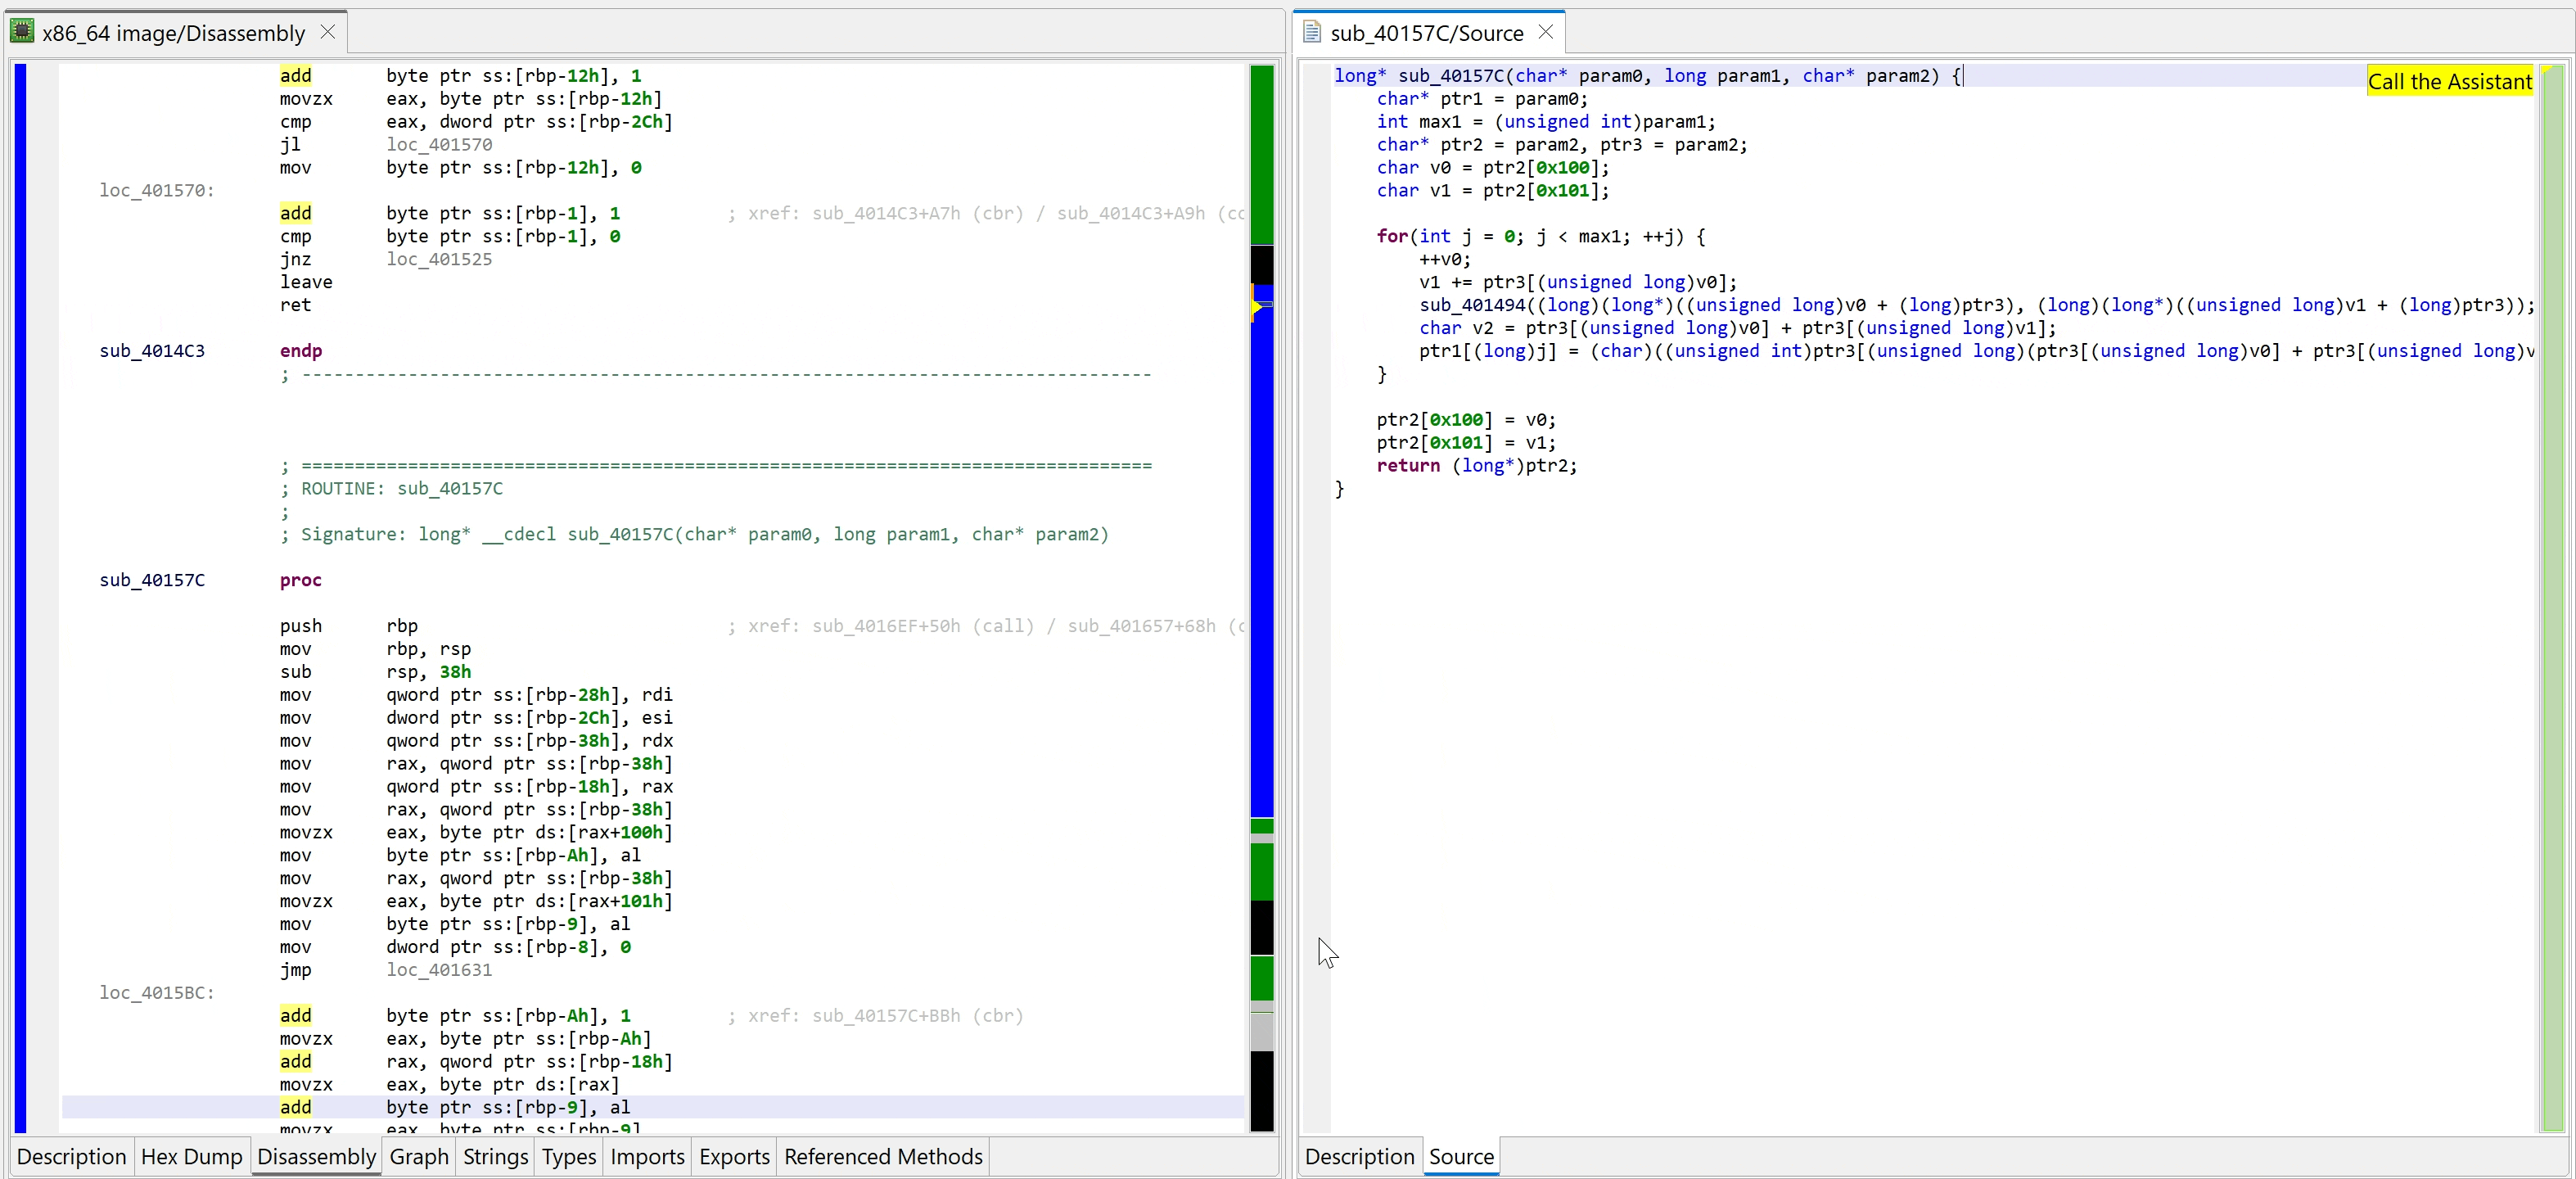
Use the JEB Assistant to generate method and parameter names#
You may use the assistant (via the Action menu, or the button located in the top right-hand corner of a decompiled fragment) to infer names for decompiled classes, methods and method parameters.
Generic Unpacker for APK#
The 'generic unpacker' will attempt to unpack protected Android apps and retrieve dynamically-generated Dex files used at runtime. Open an APK, and start the unpacker module via the Android menu. The unpacking process will start. Any collected dex file will be stored in a sub-folder unit named 'unpacked' under the APK unit.
Bucketize#
The Code hierarchy tree can group similar named nodes for more readability. Go to Edit, Options, General Front-End properties to modify ui.tree.*Bucket properties. Use tree for DEX and flat for Native. "Smart force" will force creation of buckets.
Persist Options#
Rendering options and Project properties can be persisted. Go to Edit, Options, General Bakc-End Properties. Any option modified here will be saved accross sessions.