Warning
This tutorial is deprecated, and will be rewritten to account for JEB 4 API changes.
JEB Plugin Development Tutorial part 5/8
This tutorial aggregates a collection of tips that can help you during plugin development.
Logging#
Creating Loggers#
Creating a new logger with the JEB API is simple:
private static final ILogger logger = GlobalLog.getLogger(MyClass.class);
It is good practice to create one logger per class. Loggers can be customized one by one, or globally via the GlobalLog factory.
Using Loggers#
There are several level of logs (error, warning, info, ...) and the logger methods use 2 parameters:
- the message to display
- the parameters of the message, as it is done for String.format() method.
logger.info("Hello %s", "World");
Enabling Debug and Trace levels#
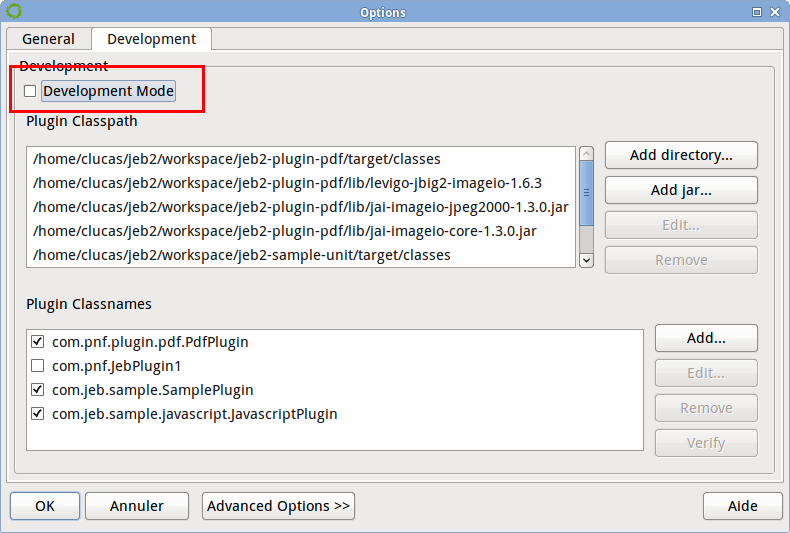
By default, debug and trace logs are not displayed. You can activate them by ticking the Development mode in the Options menu:
Logging destinations#
By default, JEB sends log data to the Logger view in the UI client. Additional sinks can be added, such as buffers or output streams. For instance, if you would like to collect all logs to a file named jeb-test-output.log in your TEMP folder, your plugin could execute the following:
String foldername = System.getProperty("java.io.tmpdir");
File folder = foldername != null ? new File(foldername): TestData.getTestDataRoot();
File file = new File(folder, "jeb-test-output.log");
GlobalLog.addDestinationStream(new PrintStream(file));
Note
Be careful, GlobalLog is a global factory object, that impacts the entire application.
Debugging#
If you are familiar with Eclipse and development tools in general, you know how useful proper debugging facility are: the program can be stopped and paused, current variables can be examined, etc. It is especially handy when troubleshooting a corner-case problem in your plugin.
JEB can be debugged using a method called remote debugging. What you need to do is:
- Configure JEB to listen for debug connections
- Connect Eclipse to JEB
Debugging setup: step-by-step#
Start JEB using the following command-line from your JEB base directory:
java -Xdebug -Xrunjdwp:transport=dt_socket,address=8001,server=y,suspend=y -jar bin/app/jeb.jar.jar
java -XstartOnFirstThread -Xdebug -Xrunjdwp:transport=dt_socket,address=8001,server=y,suspend=y -jar bin/app/jeb.jar
JEB is not started yet: it is waiting for a debugger connection on port 8001
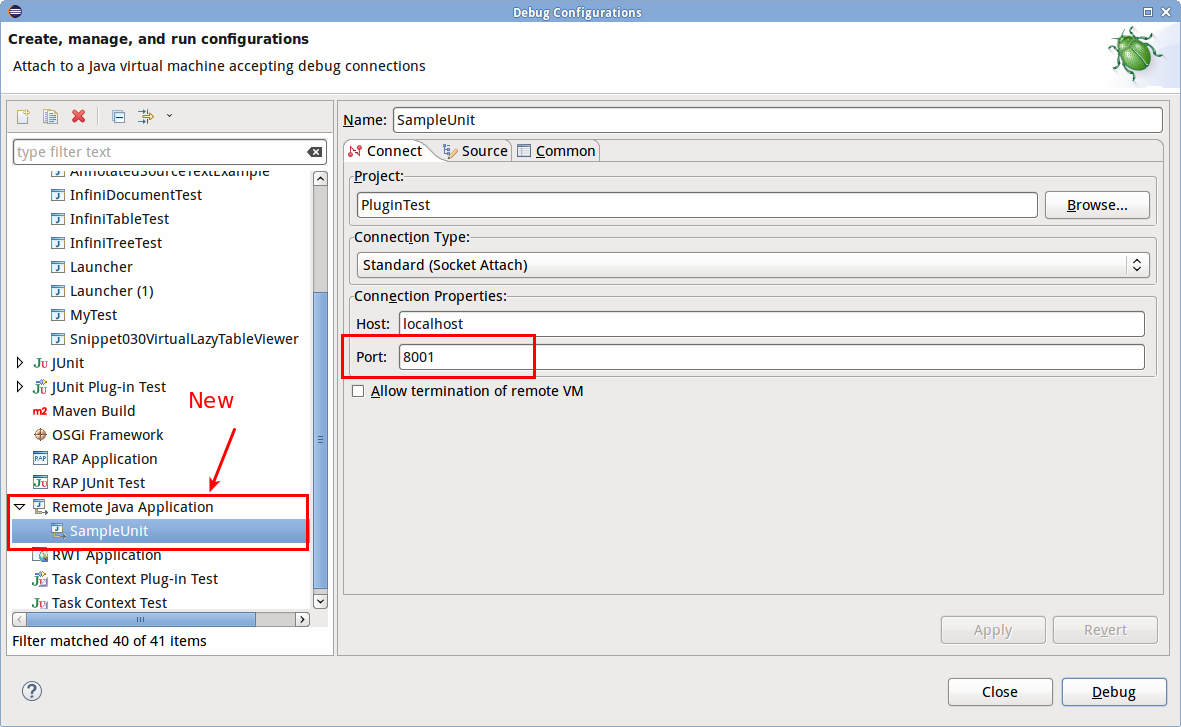
Go to Eclipse:
- Select Run, Debug Configuration...
- Create a new entry in Remote Java Application and change the port to 8001 (keep the host as localhost)
- Select Debug
JEB should be launched and you may be able to stop when putting breakpoints in code.
In practice, the true entry-point of a plugin is its no-argument constructor. You may decide to place a breakpoint there. You may also choose to stop in the canIdentify() method, which is appropriate for processor plugins such as this sample JavaScript parser.