JEB supports debugging Dalvik code via JDWP and Native *.so libraries via gdb/lldb. A debugging session allows seamless transition between debugging the Dalvik VM, jumping into native methods invoked via JNI, debugging native code (arm, x86, else), and switching back to Dalvik.
Previous material
It is recommended to read the generic debugging page first.
Prerequisites#
The Android debuggers run on all JEB-supported platforms (Windows, Linux, macOS). Verify the following before attempting to start a debugging session:
- Make sure to have the Android SDK installed. You also want to have the
ANDROID_SDK_ROOTenvironment variable pointing to the SDK folder. (TheANDROID_HOMEvariable is also checked, although it was deprecated.) - Enable Developer options and allow USB debugging on the intended physical target device. (Debugging is enabled by default on the emulators.) On physical devices running Android 4.2 and above, one way to make sure that USB debugging is enabled is to run the
adb devicescommand. If the device is shown asunauthorized, a pop-up on your phone will appear to request authorization.
Fundamentals#
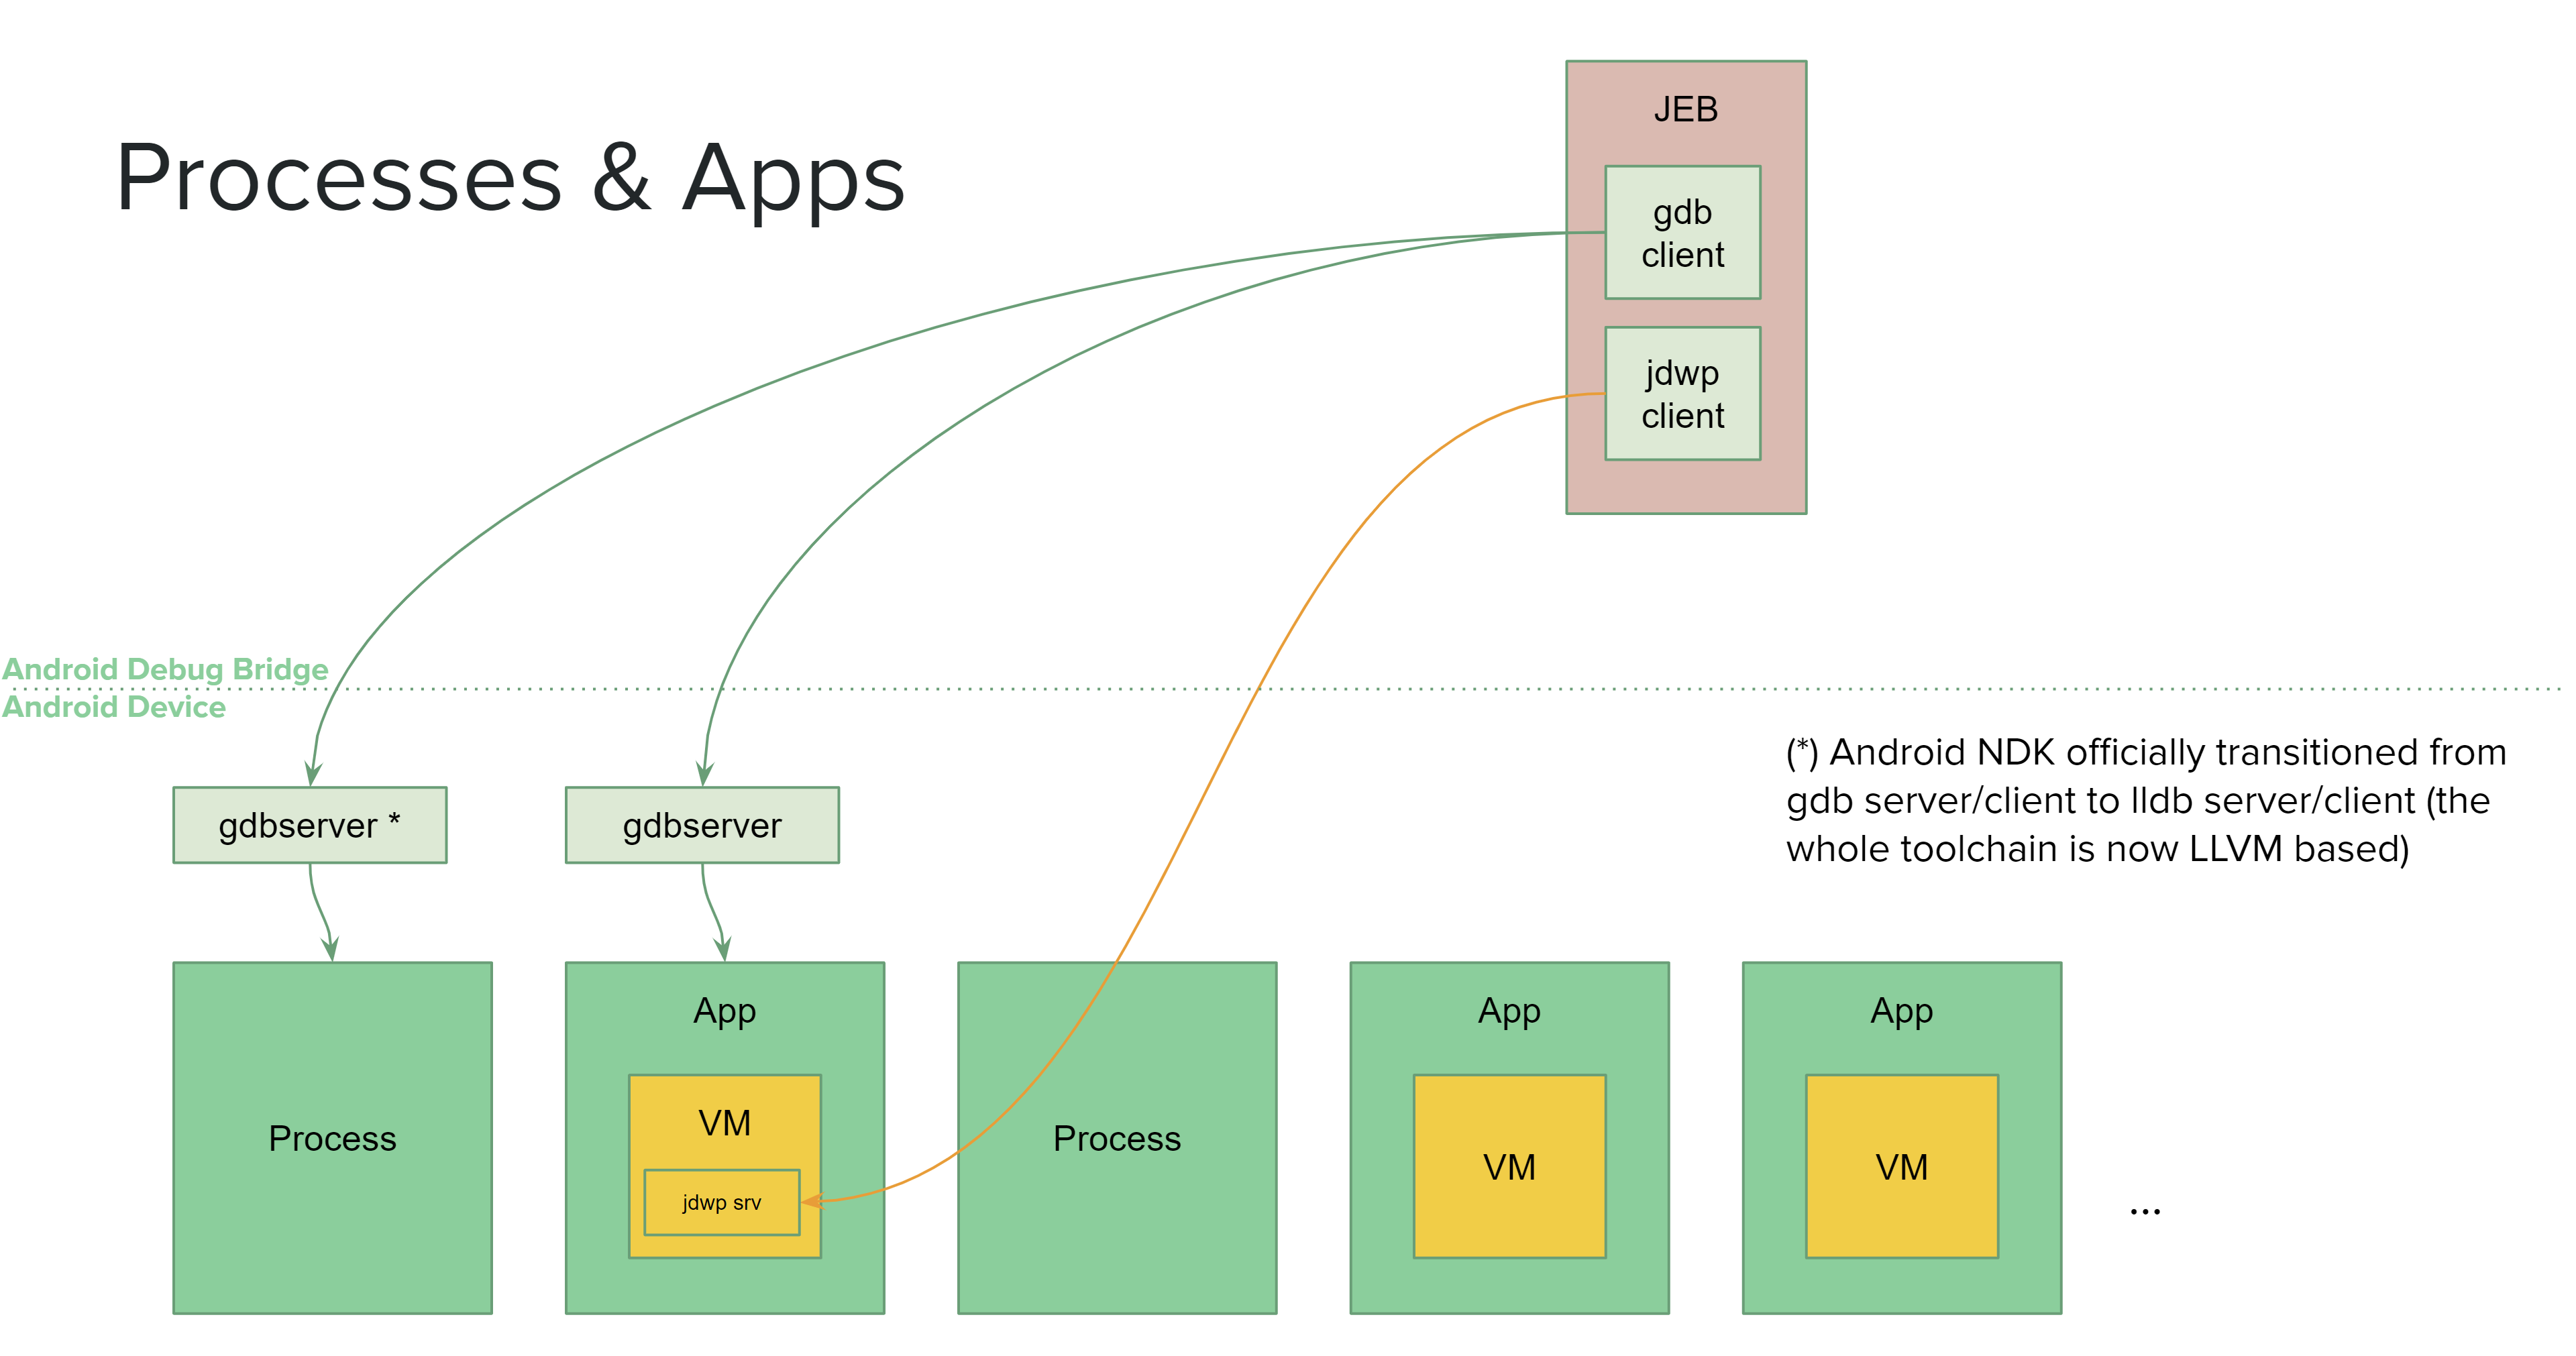
There are two types of debuggable entities on Android OS:
- Android/Linux processes
- Higher-level Dalvik virtual machines, running inside processes
Debugging is generally performed remotely, on a separate computer. Nothing prevents you from debugging on the device itself though.
- Dalvik VM debugging is done over the Java Debug Wire Protocol (JDWP) protocol. The JDWP server runs inside the process hosting the DVM. JEB implements the JDWP client.
- Native code debugging is done via
ptrace(2). On the device, the debugger server process (generally gdb or lldb), runs alongside the target process and controls it via ptrace. JEB implements a gdb/lldb client.
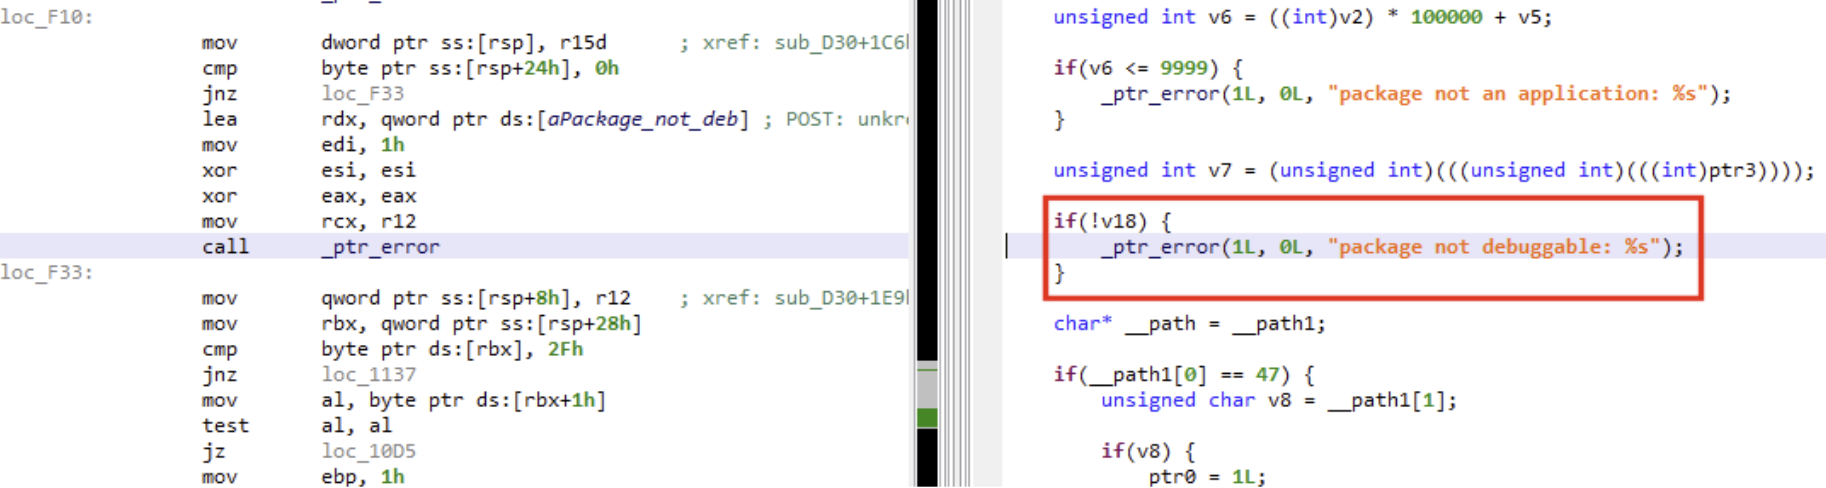
Debugging non-debuggable apps#
Normally, only apps whose Android Manifest explicitly has a debuggable flag set to true are debuggable. However, this is rarely the case when analyzing in-the-wild malware or production applications. In such cases, you have several options:
- Run the app in an emulator. Emulators have the
ro.debuggableproperty set to 1 (with an exception, see note below). This means they will debug all apps, regardless of the debuggable flag in the Manifest. In some situation, this may not be enough since several components, in the OS or the app itself, may check for the Manifest's debuggable flag before or during the app execution. - Use a rooted phone. A rooted phone will allow you to modify the
ro.debuggableproperty, and change it from 0 (standard on production devices) to 1. A rooted phone will also allow you to install additional low-level programs to ease debugging and potentially solve problems mentioned in the above bullet point. (The rooting process is out-of-scope here: it is device-specific and rooting instructions can easily be found online.) - Repackage your app. This may be the simplest option. Use JEB's built-in tool
makeapkdebugto generate a debuggable app. You will have to sign the generated app using your own key; be aware of the implications if you choose that option. See below for more details.
Warning
If you choose to debug in a Google-provided emulator image, make sure to use a non "Google Play image". Those images are lock-down production images. Instead, use a "Google APIs image" or a vanilla image (that doesn't ship with Google-specific libs).
Native code in non-debuggable apps#
When it comes to debugging native code of non-debuggable apps on a rooted phone or emulator, other limitations apply. JEB tries its best at abstracting them away. However, things might be unstable depending on which phone and OS is being used. Do not hesitate to let us know if you encounter issues.
Note
Some limitations stem from the trusted run-as Android utility, which verifies whether an app is marked debuggable, regardless of the system's overall debuggability. JEB ships with a modified version of the utility, named ranod, which does not perform such checks.
Note that most of our tests are done on Pixel devices running vanilla Android Oreo. Using similar devices for debugging will likely reduce the chances of running into corner-case problematic situations.
Generating a debuggable APK#
It is generally easier to debug Android applications explicitly marked debuggable in their Manifest: <application android:debuggable="true" ...>;
JEB has built-in utility to rebuild a non-debuggable APK into a debuggable one, while maintaining the entire structure of the application intact, except for its signing data of course. Navigate to your JEB folder, and use the start-up script, e.g. on Windows:
$ jeb_wincon.bat -c --makeapkdebug -- file.apk
Upon success, file_debuggable.apk will be generated. Sign it using the Android SDK's apksigner, e.g. on Windows, using the SDK-generated debug keystore:
$ apksigner.bat sign -ks %USERPROFILE%\.android\debug.keystore --ks-pass pass:android file_debuggable.apk
Install it on your device, and start debugging.
Warning
Keep in mind that this solution has shortcomings: Anti-debugging code may check at runtime that the app is not debuggable, as would be expected. More elaborate protections may implement certificate pinning-style checks, where the code verifies that it is signed using a specific certificate.
App Bundles (multi-APK apps)#
When a vendor develops their app as an Android App Bundle, the distributing store will send the app as a collection of smaller-sized APKs tailored to the requesting device configuration. A common split is the following:
- base APK (common for all devices)
- graphical resources APK (low-dpi, medium-dpi, high-dpi, etc.)
- localized resources APK (English locale, French locale, etc.)
- native libs APK (x86, arm, arm64, etc.)
If you need to pull those apps from a device and make them debuggable, you should run --makeapkdebug on all APKs and re-sign them with the same key of your choice.
You may then install the app as usual via adb install-multiple.
Starting a debugging session#
Android debugging sessions can be started when analyzing APK files. If your main artifact is an orphan DEX file, the client will refuse to start a debugging session.
First, retrieve your target APK and get the app ready for debugging:
- Make sure the APK matches the one that will be executed on the target phone. You can download the APK using
adb:adb shell pm list packages -fto retrieve a list of packages and the associated path to APKadb pull <pathToAPK>to download the APK
- Start the app on the phone
- Via the App Launcher for instance, if attaching to an already running app is an acceptable scenario
- If you want the app to wait for the debuggers to attach to it before it starts executing any code, you can run something like:
adb shell am start -D -S -n <packageName>/<activityName>- A pop-up will be displayed on the phone, indicating it is waiting for a debugger to attach to the VM
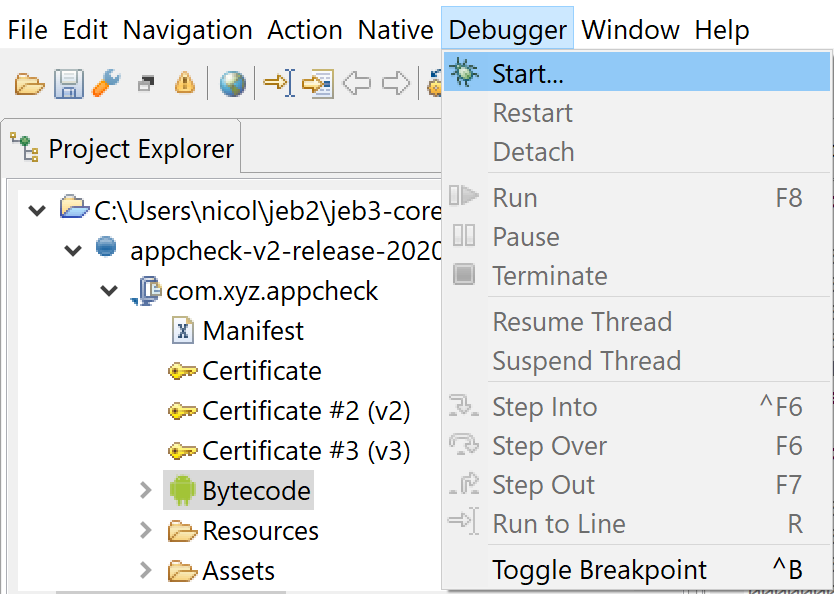
Second, in the UI client:
- Load the APK file
- Open a view of a primary DEX unit
- Once the focus is on the DEX view, open the Debugger menu, and click on Start...
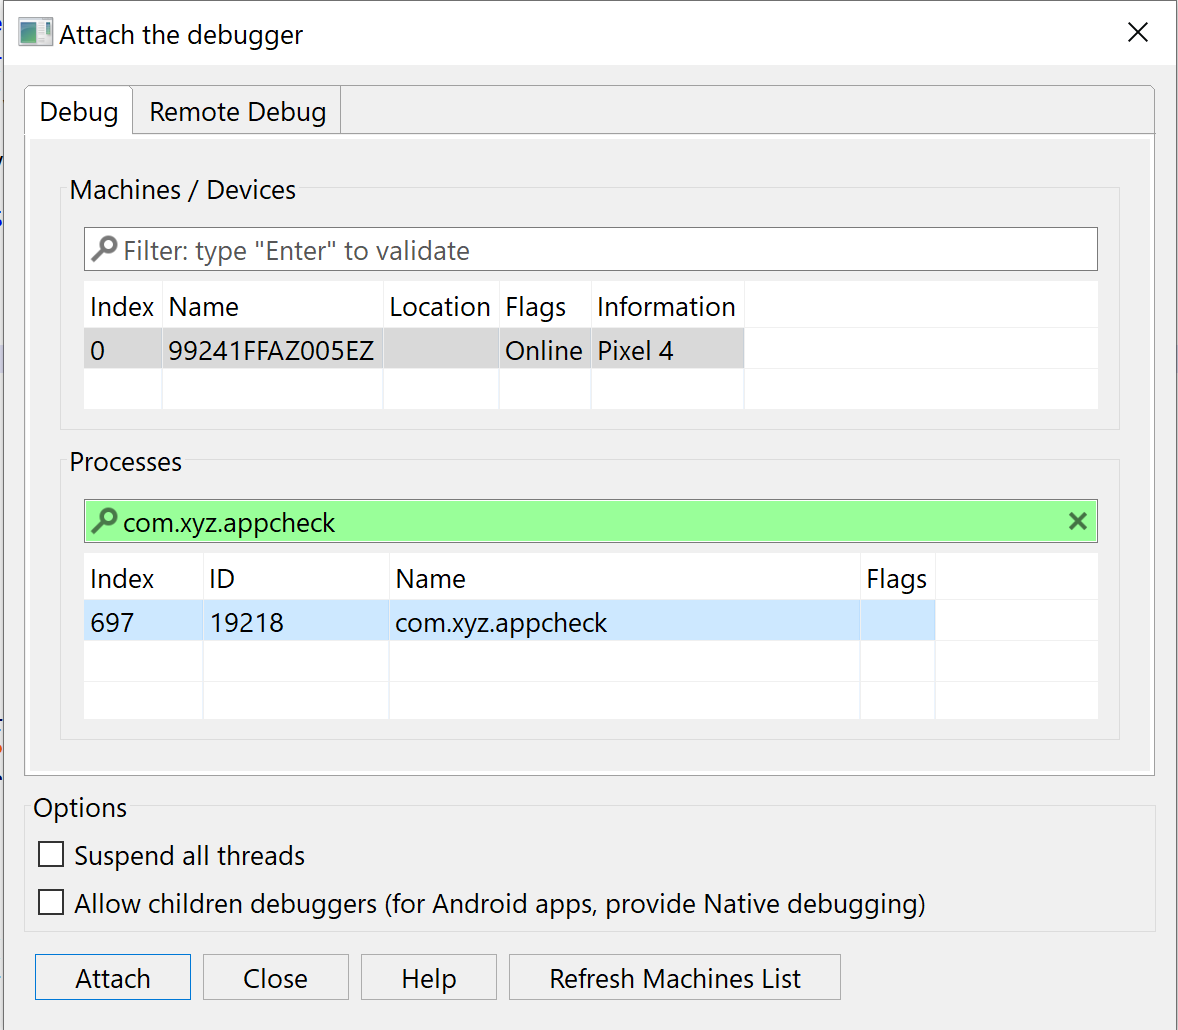
In the Attach dialog window:
- Select the target phone and the target process that matches your app, and click Attach.
- Unless you tick the "Suspend all threads", The app will be immediately be run/resumed after attaching.
- The process filter is normally filled out with the APK package name. Simply press enter to filter out entries.
Heads-up
Tick "Allow children debuggers" if you wish to debug native code as well.
Common problems#
Unable to debug native code of an Android app?
Make sure to tick the box "Allow children debuggers" before attaching.
Impossibility to read (most) local vars in Dalvik
The issue is affecting Android Pie (API 28) and Q (API 29). We wrote a blog explaining the details of the problem (unfortunately, not a fixable one). If possible, switch to Android Oreo or below (<= API 27) or Android R or above (>= API 30).
Cannot attach to a non-debuggable app but the phone is rooted
Having a rooted phone is not enough. System components checks for the app's debuggability (i.e., the Manifest's android:debuggable flag) in various places, regardless of whether the image is a locked production image, rooted image, debug or dev build, etc.
While it is relatively easy to debug Dalvik, native debugging is generally more tricky. JEB does a few things to ease settings things up:
- It attempts to set the system property
ro.debuggableto 1 - It attempts to replace the
run-asutility by one that does not check the debuggable flag (more details later in this doc).
In order to do any of the above, root privilege is required, and JEB assumes the su tool has been dropped in a standard location (/bin/su, /sbin/su, /system/bin/su, /system/xbin/su, /data/local/su, /data/local/bin/su, /data/local/xbin/su, /system/sd/xbin/su, /system/bin/failsafe/su, /su/bin/su).
Files may have to be dropped in the /system folder. That folder is read-only by default and needs to be remounted read-write. Root privileges may not suffice: if you are using an emulator, configuration may default to a read-only system image. You will need to explicitly specify that the system can be written to, e.g.:
$ <SDK>/emulator/emulator -avd [image_folder_name] -writable-system
JEB also attempts to disable SEAndroid by issuing a setenforce 0 command.
The aforementioned settings and techniques may not suffice. Whenever possible, we encourage debugging on the Lolipop-Oreo range (5.0 to 8.1 / API 21 to 27) with vanilla images.
Ideally, you'll want to have a debuggable app. Again, it may not be always possible or realistic (e.g., debugging a system app and a custom vendor's locked image), but in many cases (e.g., malware analysis), it is possible.
Debugger nodes#
After attaching, the app, you should see one or two additional nodes in the Project tree view. One debugger node for Dalvik, an optional debugger node for native code.
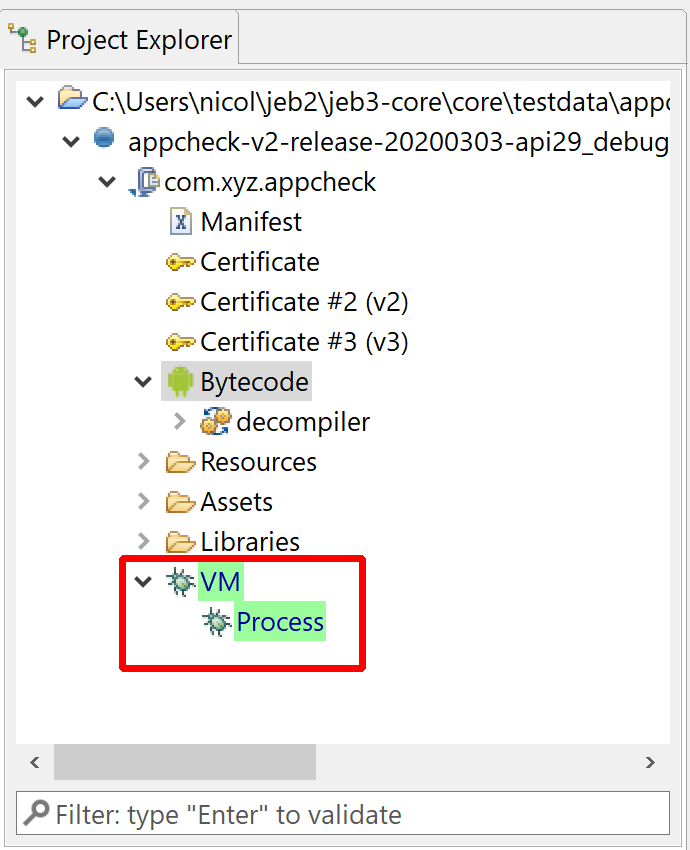
Note
When a debugger is successfully attached, the corresponding node has a light green background.
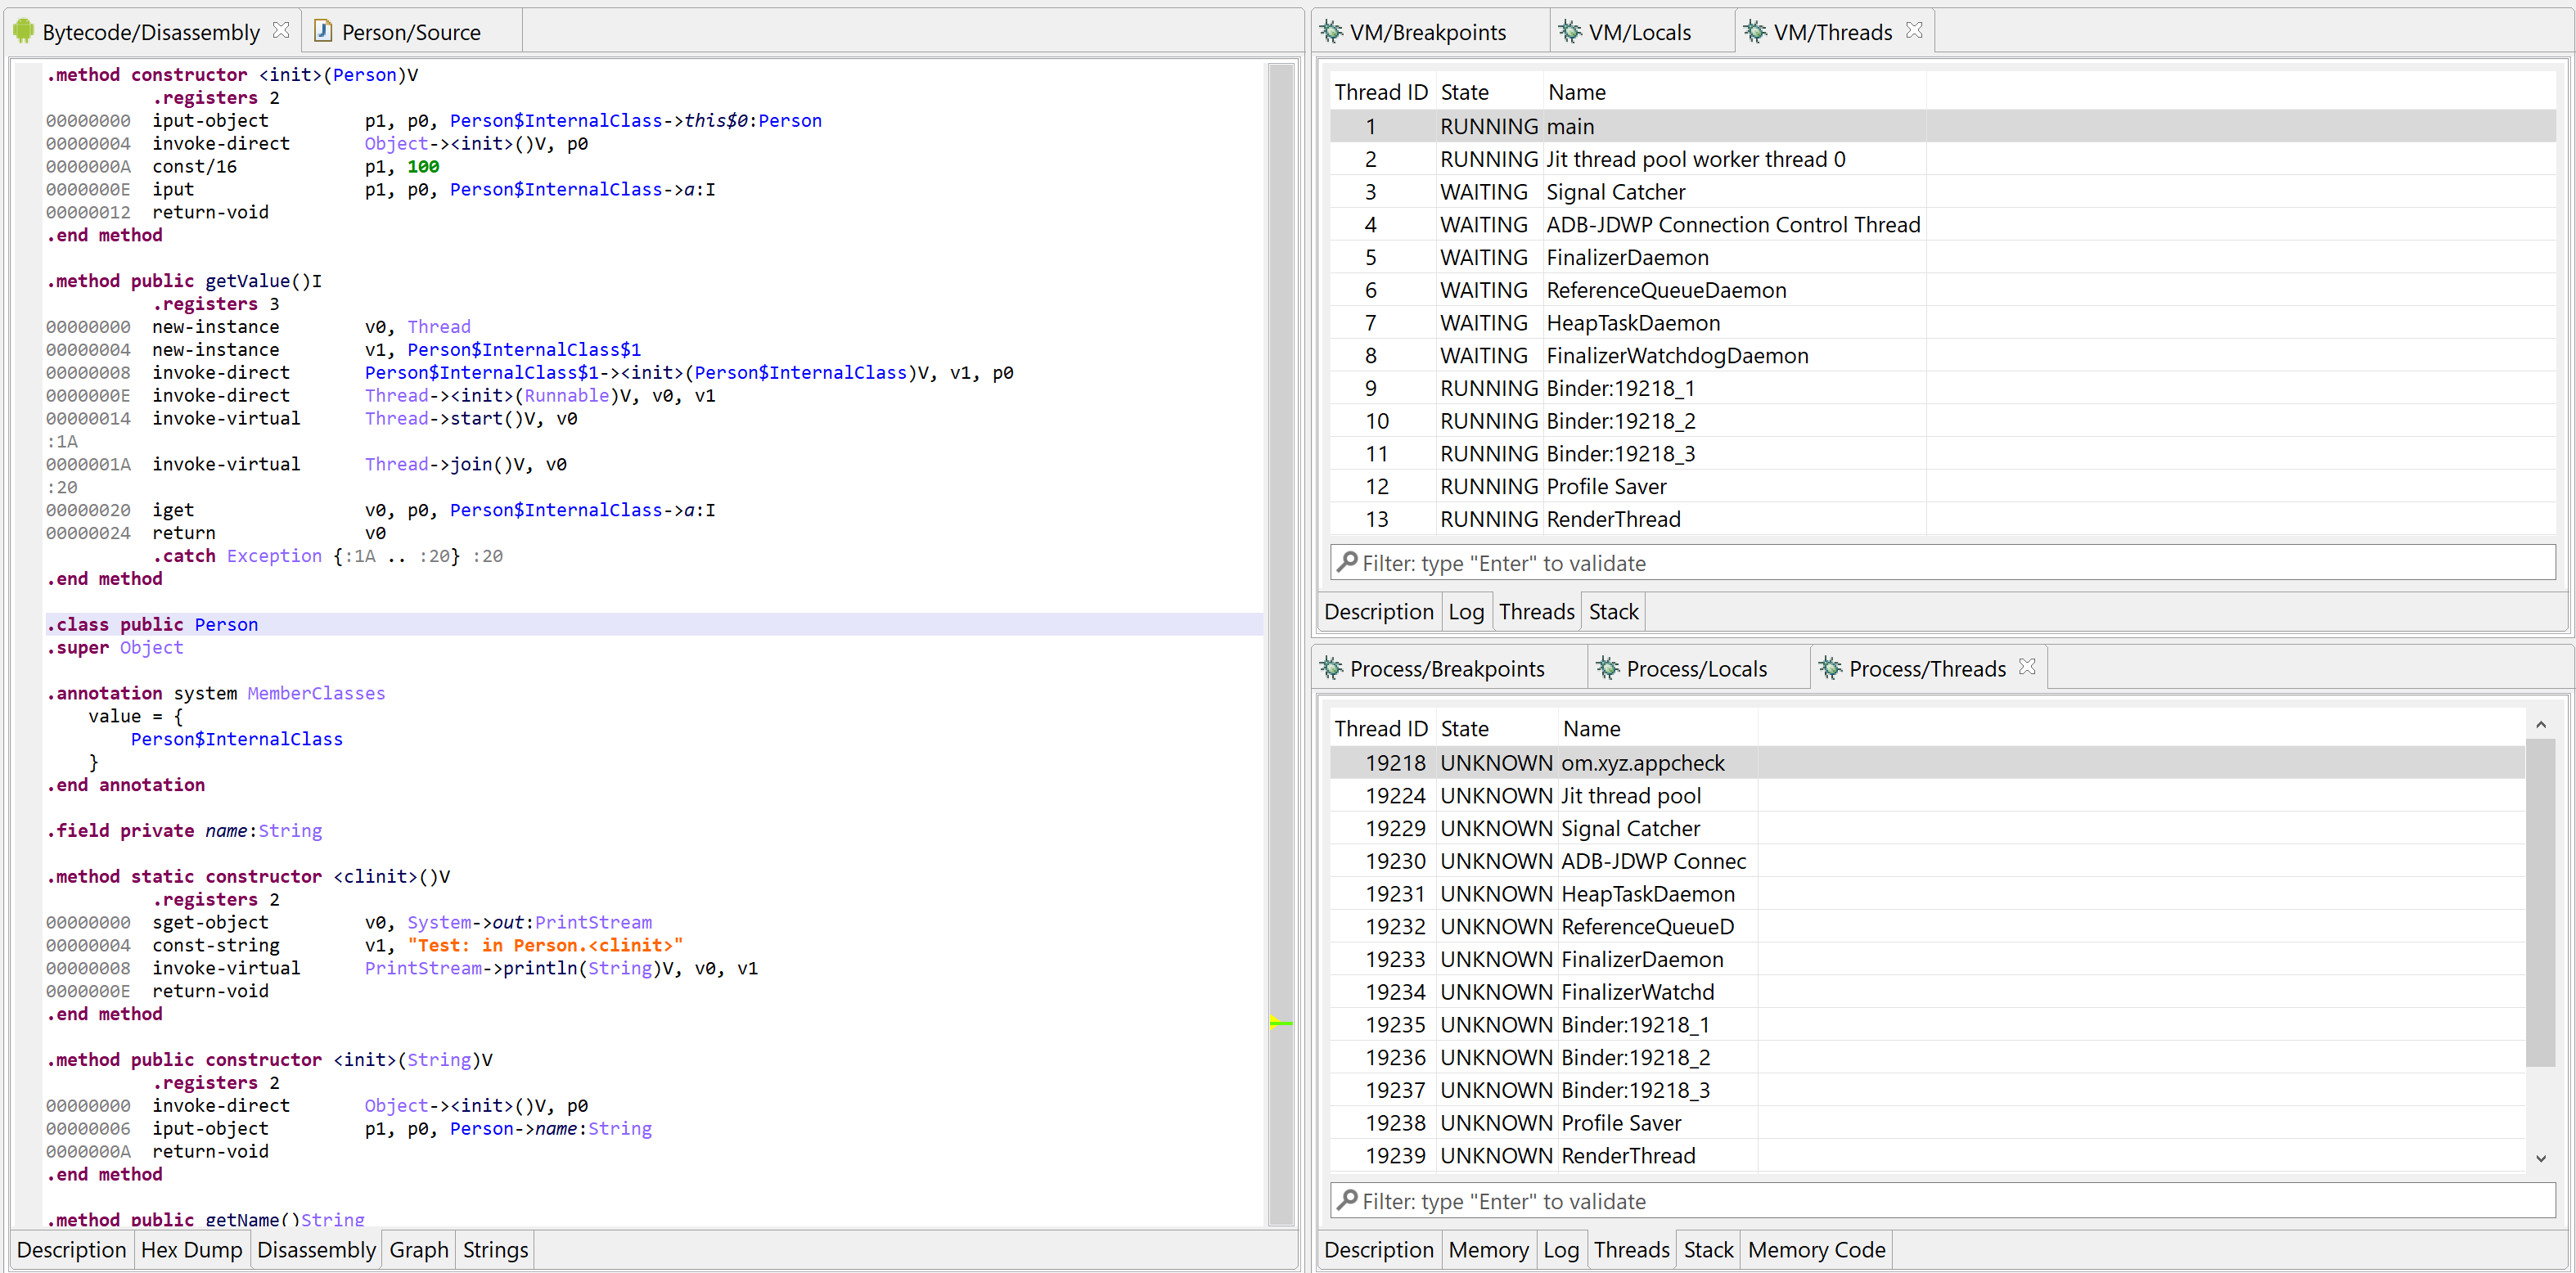
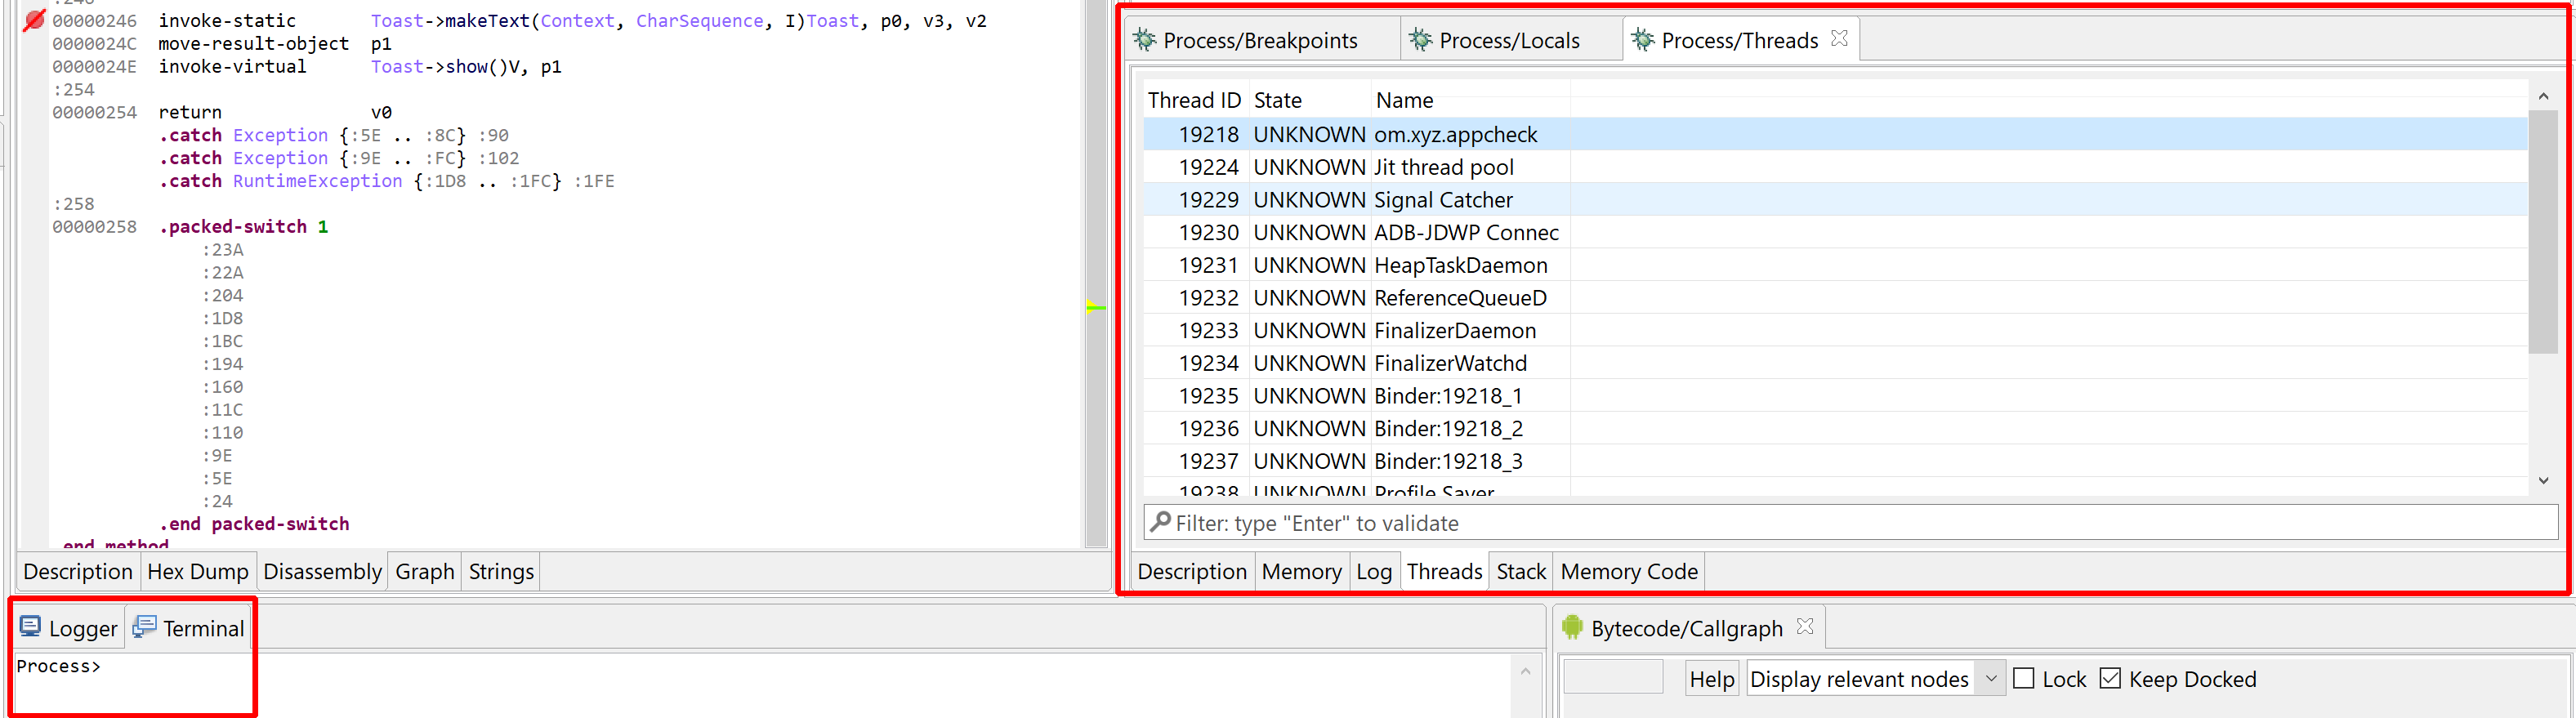
Additional views and fragments displaying the debuggers' states and commands are added to the workspace:
Native threads#
Caution
Keep in mind that pausing the Process debugger (i.e., suspending the native threads) will freeze the higher-level Dalvik VM!
An app's Dalvik VM runs inside a Linux process. Therefore, any action taken using the native debugger (if native debugger was attached) may affect a VM debugging session as well.
Dalvik debugging#
Active debugger#
In the general case, the focused UI fragment will determine which debugger will receive input commands. Therefore, be mindful of which debugger is being controlled when invoking commands (via menu entries, toolbar or keyboard). E.g., if the focus is on a DEX view, the controls are connected to the VM (Dalvik) debugger; if the focus is within a code view connected to the Process debugger, the controls are connected to the Process debugger.
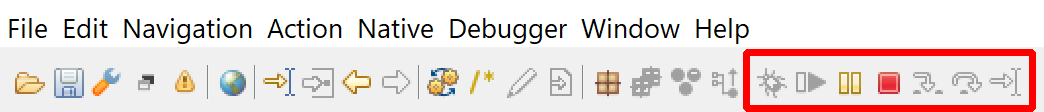
Controls#
Standard debugger controls can be accessed via the Debugger menu or the toolbar area. They allow:
- Attaching, detaching, terminating the process
- Pausing and resuming the process and, possibly, its individual threads
- Stepping (into, over, out of)
- Toggling execution breakpoints
Not all controls can or are implemented for both debuggers. Currently for instance, pausing individual threads of the Process debugger is not possible. When a control is not available, depending on which control it is and the severity of the failed operation, the user may be unable to activate it (e.g., grayed button), receive an error in the logger, or receive a pop-up error in the client.
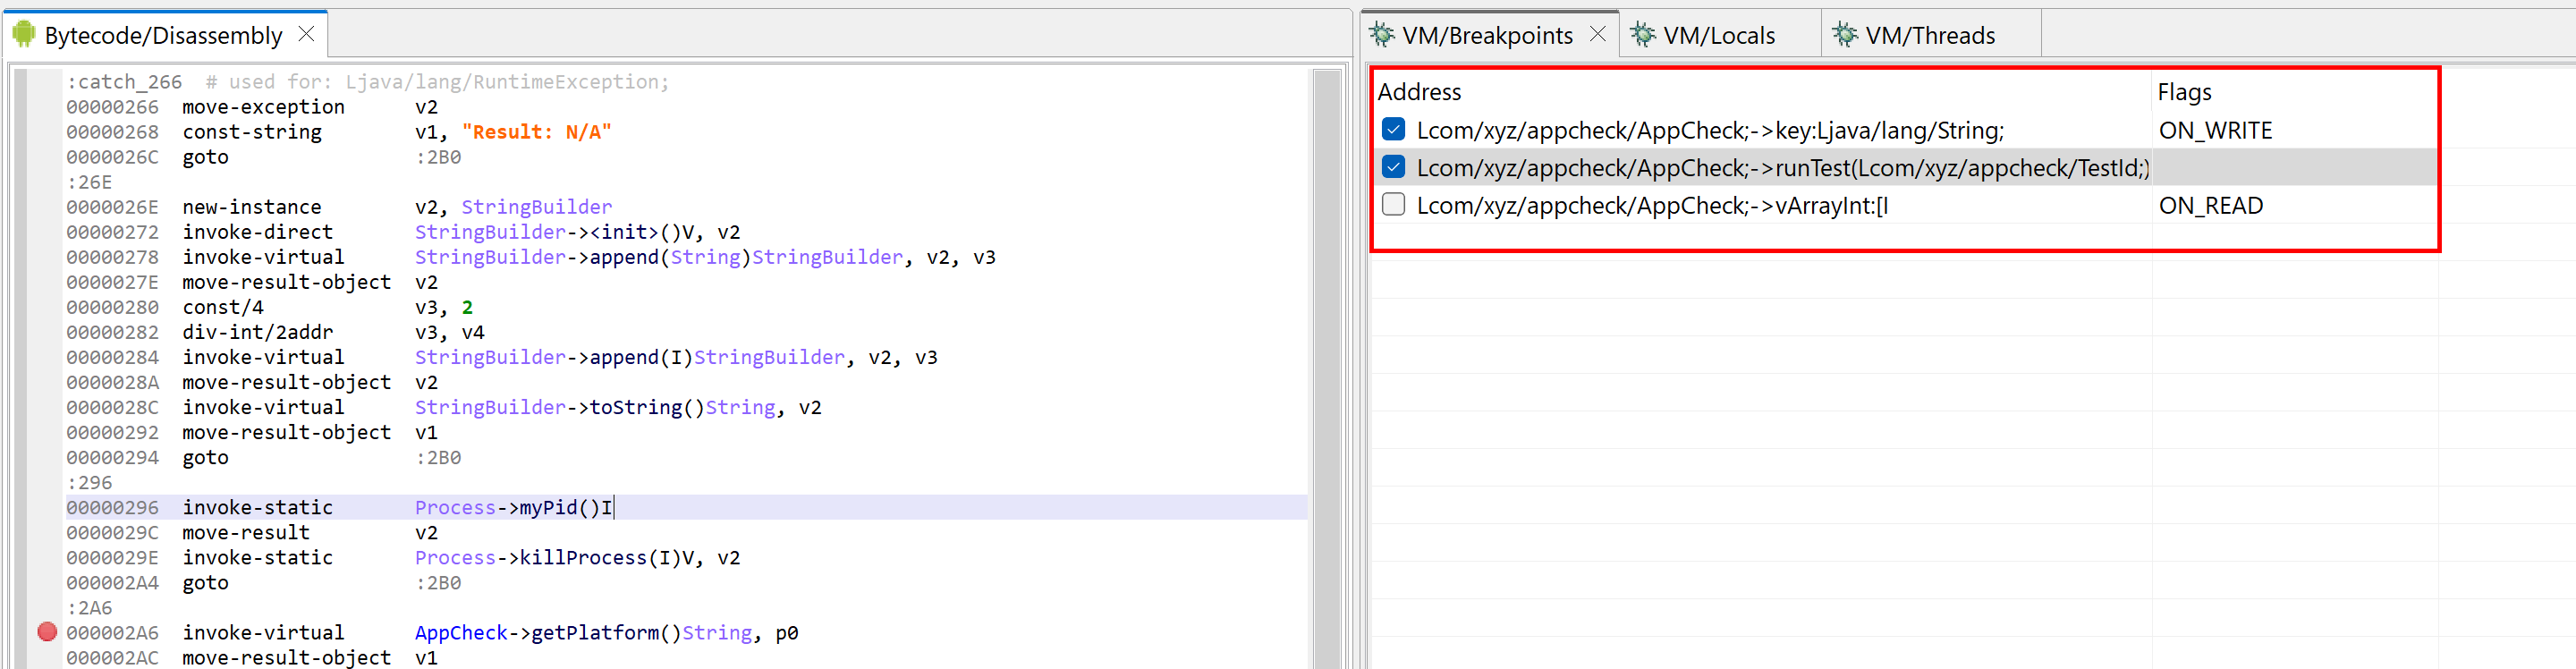
Setting breakpoints#
Standard breakpoints are used break when an instruction is about to be executed (in the GUI, they can be set by positioning the caret on the disassembled instruction) or break when a field is about to be accessed or modified (in the GUI, they can be set by positioning the caret on the field definition).
Such breakpoints can be easily toggled on and off by using the handy Control+B (Command+B on macOS) shortcut. An icon is displayed in the left vertical bar of a code view to represent enabled/disabled breakpoints.
Finer-grained breakpoints on fields can be set via the Debugger menu: break only when a field is read (access), or break only when a field is written (modification).
Note
Toggling breakpoints on and off is currently not available in decompiled views.
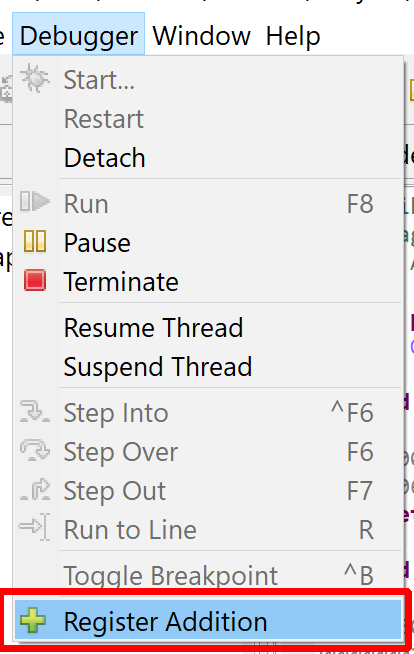
Registering additions#
When starting a debugging session, the debugger attaches to an APK's DEX unit as well as subsequent compatible code units dynamically added to your Project.
Dynamic additions: Dex code#
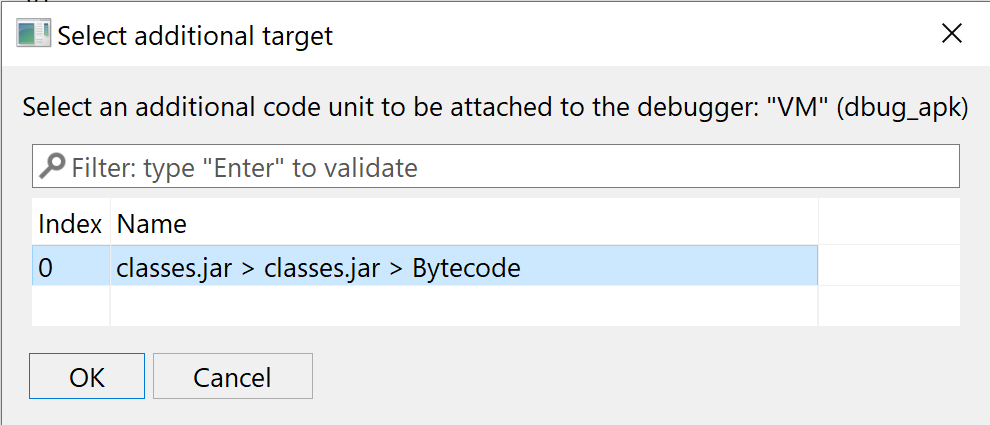
However, in some cases, the debugger will not automatically pick up and attach to additional DEX units (e.g., nested DEX units). You may ask the debugger to register additional code units via the Debugger, Register Addition action:
Note
Make sure to focus a fragment pertaining to the debugger which should link the target code unit before executing Debugger, Register Addition.
Dynamic additions: Native code#
Similarly, native library artifacts may be added to a project, processed, and attached to a native debugger after a debugging session has started.
Note
For native unit additions, the unit name must reflect the library name loaded in the process. Use the libs command in the debugger terminal to determine an actual library name. If names mismatch, the debugger will not be able to find out the actual library image base. If you need to rename a unit, right-click the unit node in the Project Explorer panel, and select Properties.
Demo video: Dynamically adding an .so file to a debugging session
Views and fragments#
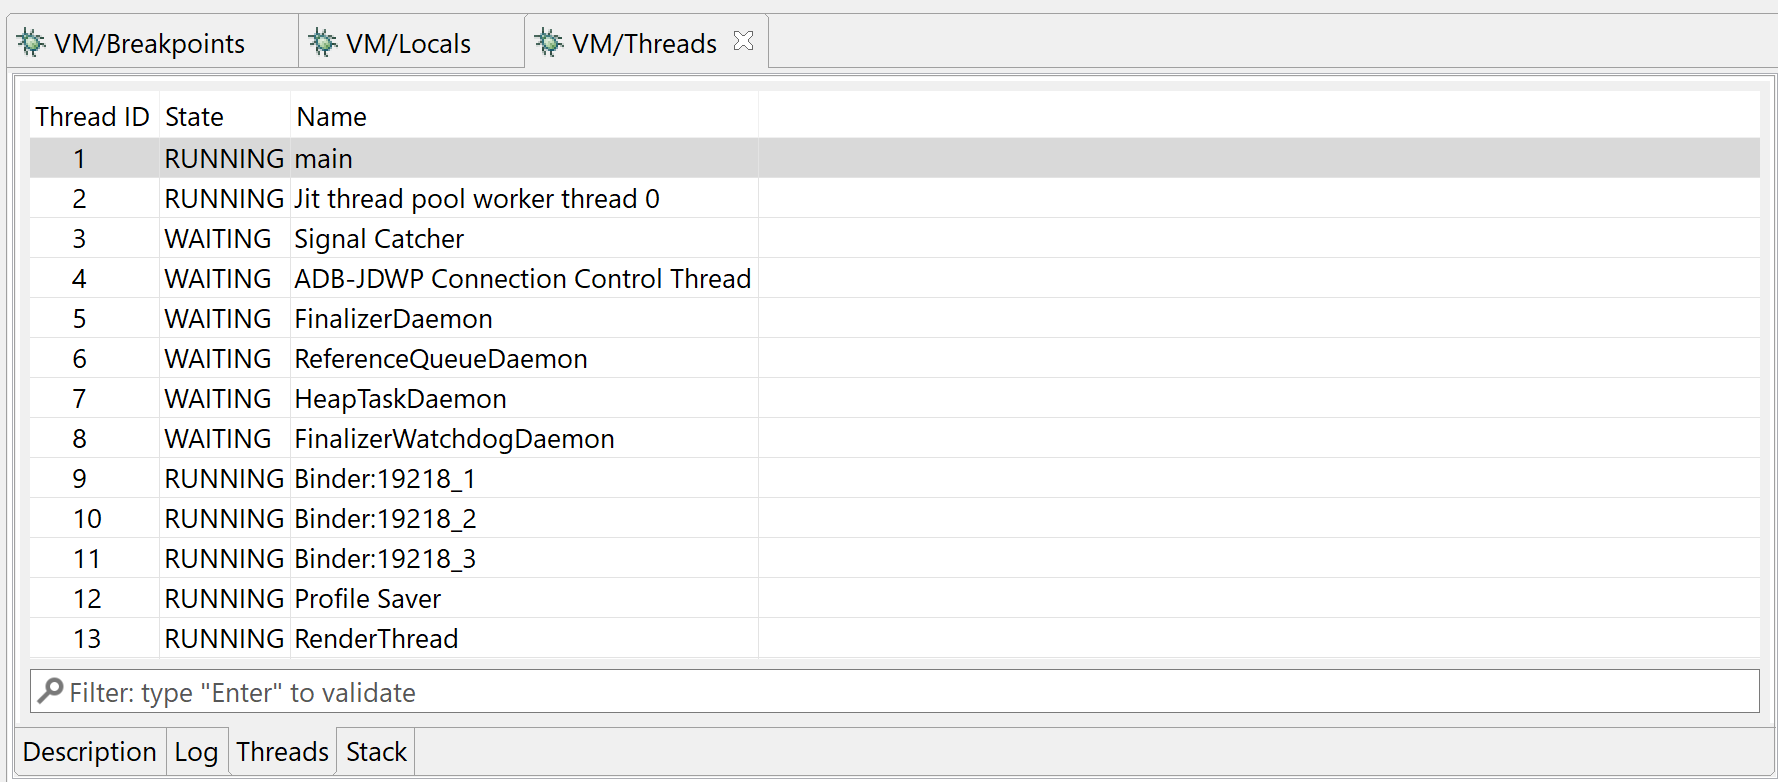
Threads#
The Threads view displays thread identifiers, status (running, suspended, waiting, etc.) as well as the stackframes when a thread is paused. Depending on the target processor, there may be one or more stackframes, showing the location (program counter register or address) of the current thread.
Note
Full status list: CREATED, RUNNING, PAUSED (=SUSPENDED), SLEEPING, WAITING, ZOMBIE, MONITOR, TERMINATED. Not all status may be relevant to a given architecture.
The default thread can be selected by double-clicking or right-clicking, Set as default thread.
By default, when a breakpoint is hit, only the active thread is suspended. The other threads are not. Other threads can be suspended with Terminal commands.
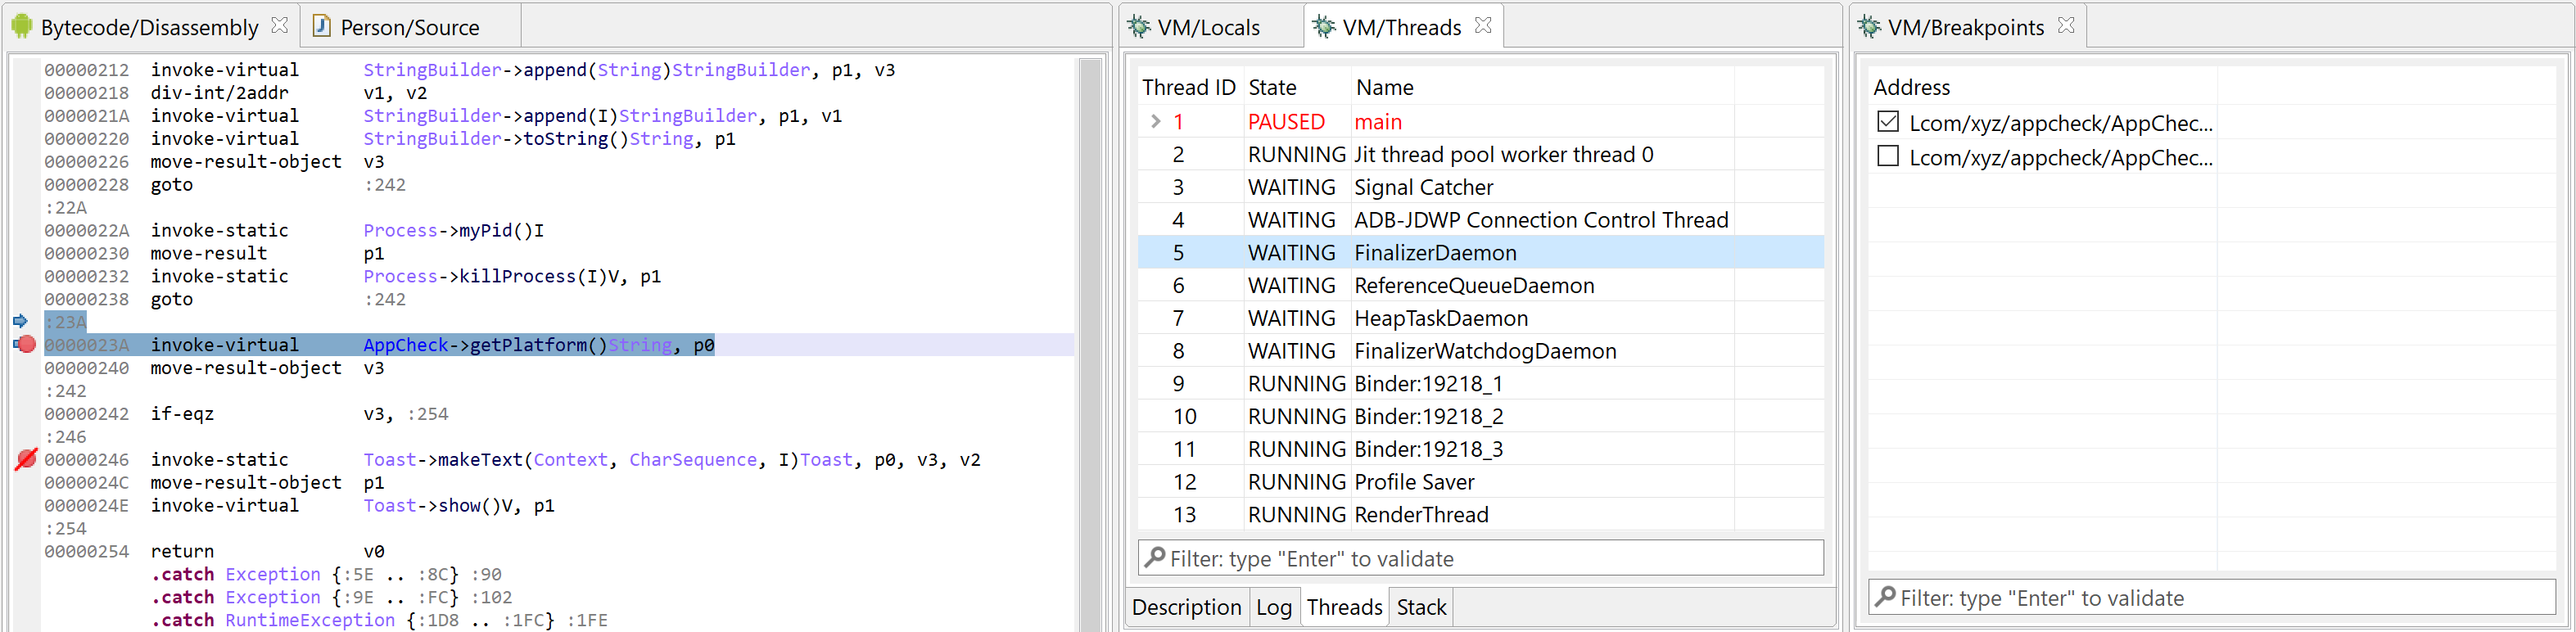
Breakpoints#
The Breakpoints view displays active and inactive code breakpoints.
Note
The JEB API allows settings breakpoints on instructions, breakpoints on methods (method entry, method exit), and breakpoints on fields (field access and/or field modification). Other capabilities exist, not readily available in UI client, e.g. breakpoint on class load event, breakpoint on exception, etc.
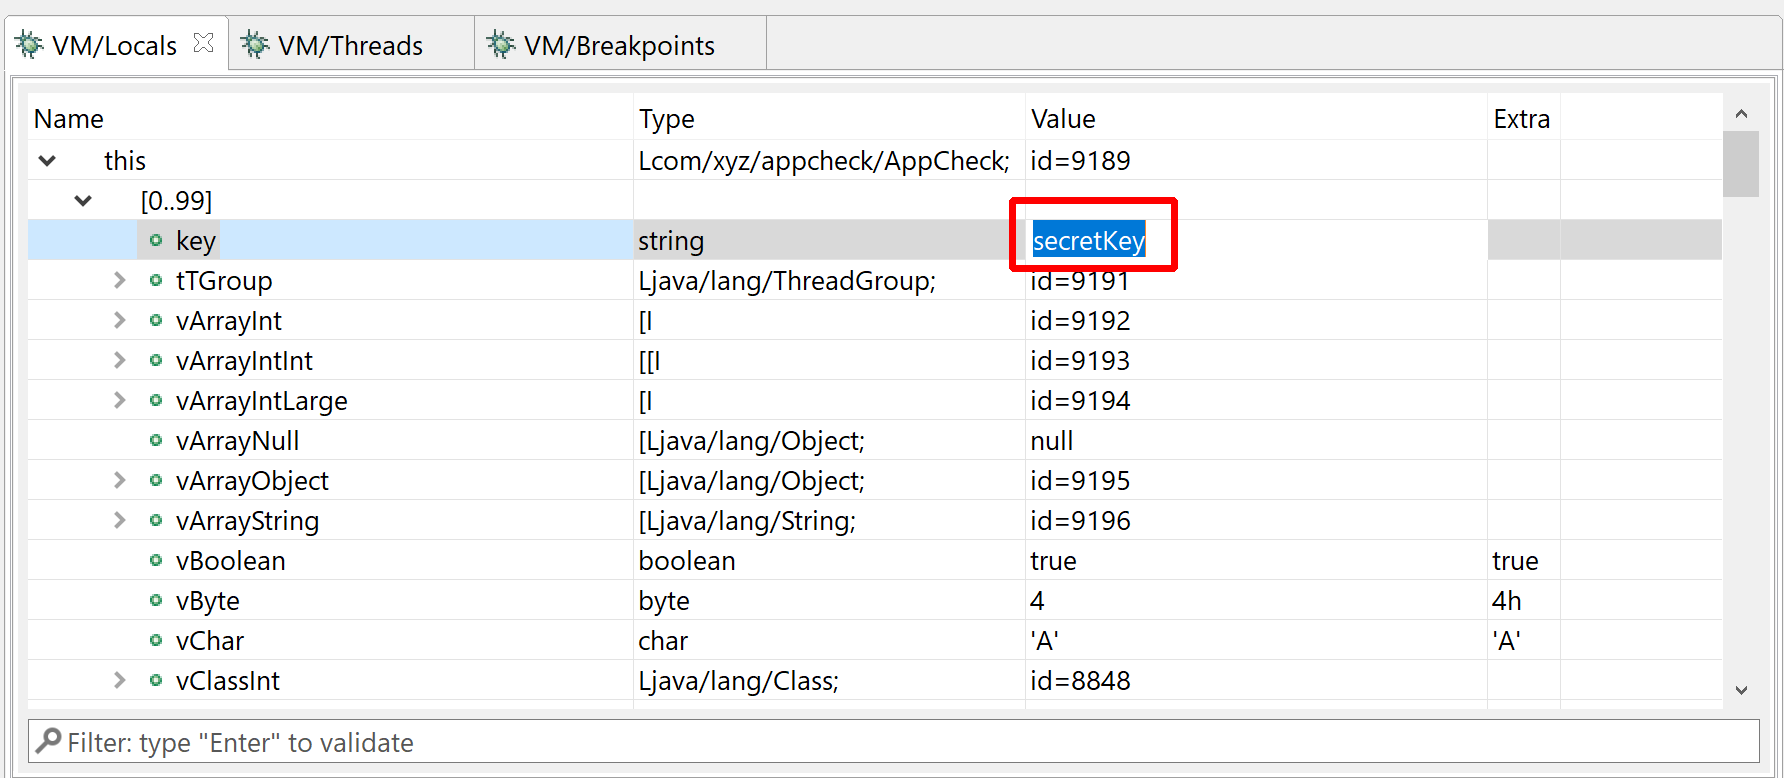
Locals#
The Locals view displays generic variables registers. They can be virtual slots of a VM, registers of a native process, complex variables inferred by the decompiler, etc.
For JDWP, what is displayed is:
thisfor Non-static methods- locals of the selected (and paused) thread's top frame; variables for other frames can be examined via Terminal commands
Primitives and String values can be updated.
- click on the cell of the value to be written, in the Value column
- set the new value and press Enter
Note that JEB attempts to maintain the state of this fragment across your debugging sessions, even though variables references, values (and subs) may change as you step through code, etc.
JEB does its best at displaying very large arrays efficiently as well. However, keep in mind that adb is slow, and maintaining live variable views up-to-date across stepping can be costly. You may temporarily disable Refresh by pressing the "Freeze Refresh" button.
Variable types
For safety reasons, Dex metadata providing locals types and/or names information is disregarded, since it cannot be trusted and using bad types can crash the DVM debugging server. See the sub-section below about JDWPD caveats.
Live overlays#
Hover over a variable, register, or field to see its contents. The thread must be paused.
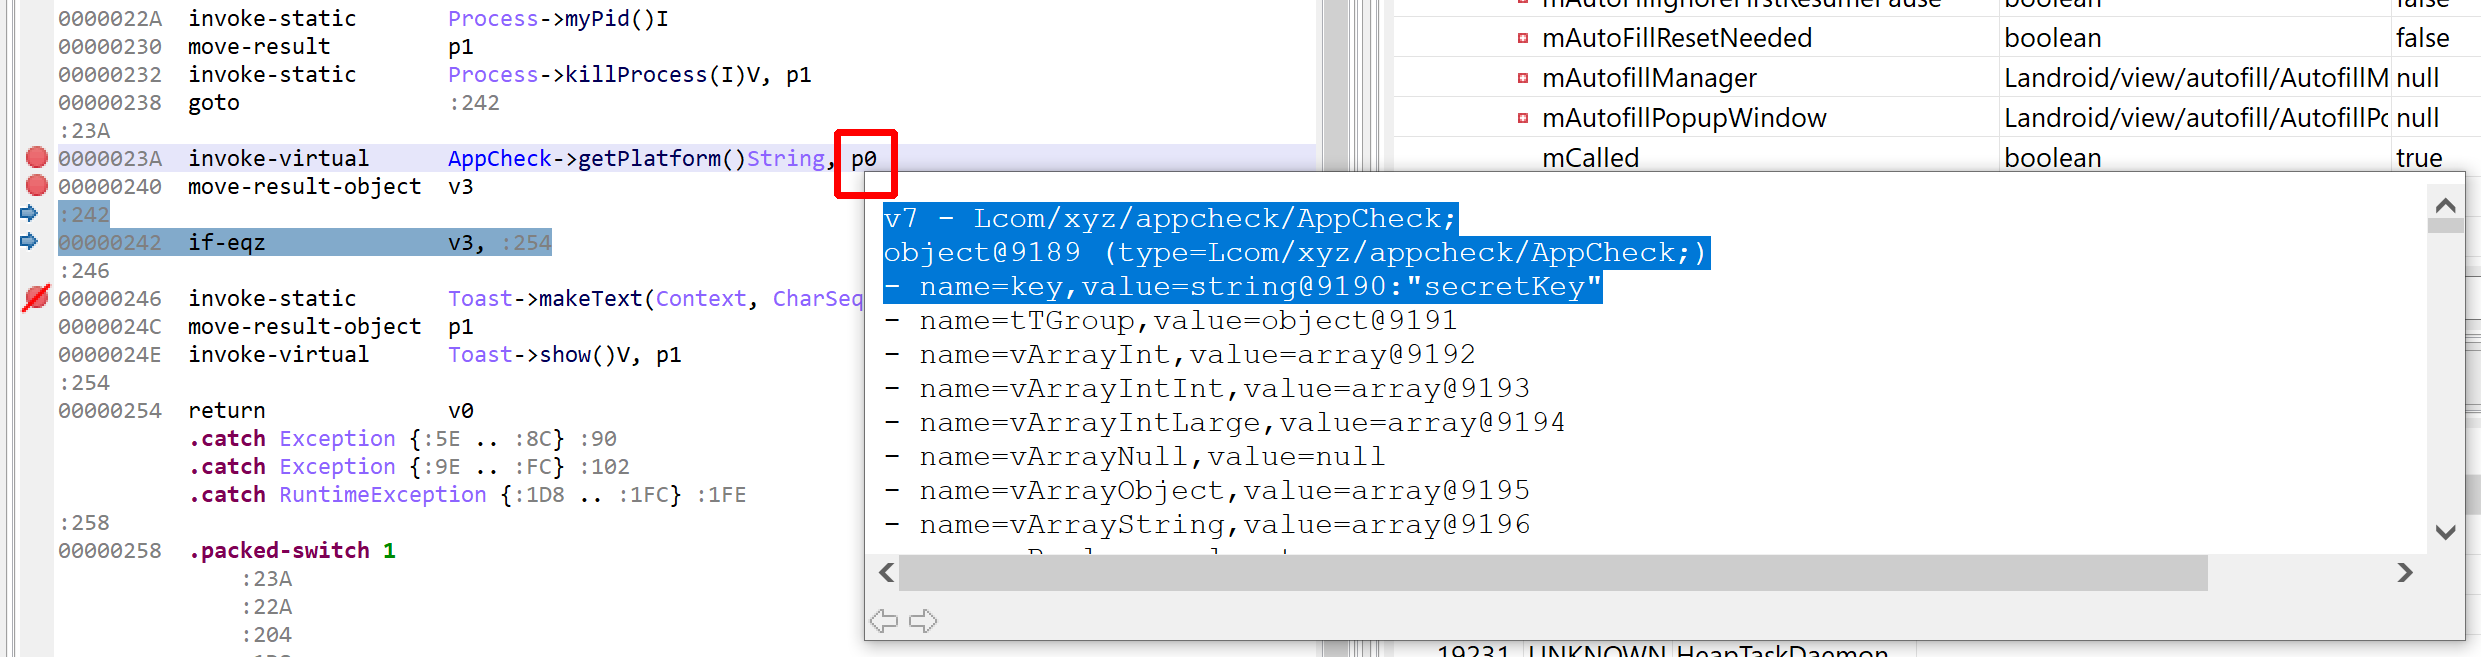
p0 (equivalent to v7 in the examined method)
Other fragments#
The Stack and Memory fragments are irrelevant for JDWP debugging
JDWP caveats#
Note
This short section highlights limitations pertaining the Dalvik debugging via JDWP, both on the server (device) and the client (JEB) side.
JDWP was specified and designed by Oracle for the Java VM. The Dalvik VM implements parts of the specifications and the Binary Protocol.
Capabilities#
The Capabilities and CapabilitiesNew commands of the VirtualMachine command set can be used to retrieve the list of features offered by a JDWP server. E.g., register watches are not supported by the Dalvik debugger server.
Although the JEB Android debugging modules implement JDWP with regards to what the Dalvik JDWP server provides, not all JDWP are currently exposed through the UI client or even API. E.g., JDWP allows debugger clients to specify if one or all threads should be stopped when a breakpoint is hit; currently, JEB debugger API does not provide a method to control that setting.
Variable typing#
Why are most locals typed as 'int' by default? The general reason is safety.
Caution
The Dalvik VM will crash the JDWP server attempts to read a non-reference as a reference; most non-references are obvious (e.g., 1, 2, small ints -> non refs.) but some ints may not be - relying on DEX metadata is also unsafe.
However, most variables can be retyped. Click on a type cell to edit contents:
- Changing the type of v0 to long: type
long, press Enter. The resulting value is the long interpretation of {v0,v1} - Changing the type of p0 to object: type
object, press Enter. If the reference truly is an object, the correct type will be retrieved. If it is not, the VM may crash.
Variable vs Parameter#
In Dalvik, vX is the preferred notation to reference variables of a method's stack frame. In this case, X is an index relative to the top of the frame. Another notation, originating from Java, is pX. That notation is primarily used to specify parameters, X being an index such that all of a method's parameters (including this) are located at the very bottom of the frame. (Converting from vX to pX and vice-versa is detailed in the Android page.)
The JDWP protocol was designed by Sun/Oracle. As such, and although JDWP specifications do not explicitly specify that, it may seem intuitive to assume that the indices used by JDWP to designate variables in a frame would be pX indices. It seems that used to be the case until API 27 (included). From API 28 onward, indices used to refer to variables are vX indices. Knowing this fact is crucial when it comes to reading and writing variables of a frame.
JEB attempts to determine this automatically. However, if incongruities seem to show in the Variables GUI fragment, it may be that wrong indices are being sent out in JDWP commands. In such a case, use the debugger interpreter's frameSlotIndexMode command to manually set the index mode. See the section below for details about the Interpreter and how to use it.
Unreadable variables#
On Android P and Q (API levels 28 and 29), the values of variables without valid debug information are not provided by the debugging server. If an attempt to read them is made, the debugger server issues a JDWP error 35 ("Invalid slot"). Therefore, when debugging applications on Android P/Q, JEB will not be able to provide the values of all variables. To see which locals are declared in the debug information of a method, enable "Show Debug Directives" in the options (right-click in the Assembly view, Rendering Options). The debug variables are declared with ".local vX ...".
This problem was fixed in Android R and above: All initialized local variables are readable.
More information on this blog post.
Interpreter Commands#
The debugger units implement IUnit.getCommandInterpreter method to provide clients with command interpreters used to execute fine-grained debugger commands that may not be readily available in the UI client.
All command interpreters are accessible via the Console tab. Once the Android debuggers are attached, switch over to the Console view, and type list. This command will list all command interpreters currently attached to the console:
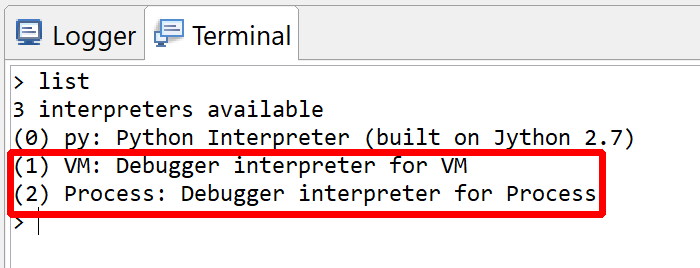
An interpreter has a numeric id as well as the name of the unit that created it. Switch to an interpreter with the use <id|name> command. The special command help, available in all interpreter contexts, lists all commands made available by the interpreter currently in use.
> list
3 interpreters available
(0) py: Python Interpreter (built on Jython 2.7)
(1) VM: Debugger interpreter for VM
(2) Process: Debugger interpreter for Process
> use 1
VM> help
info                           : Display basic information about the debuggee
libs|modules [name-filter]     : Display information about the target modules
resume [tid]                   : Run or resume the target, a thread, or the default thread (tid 0)
pause                          : Pause the target
detach                         : Detach the target (if possible)
kill|terminate                 : Kill the target (unstable)
threads                        : List the process threads
thread [tid]                   : Set or get the default thread
step|stepi                     : Step "into" one instruction in the default thread
stepo                          : Step "over" one instruction in the default thread
stepu                          : Step "up"/"out" (run until return) in the default thread
b|bp [address]                 : Set or list breakpoints
bc [index]                     : Clear one or all breakpoints
frameSlotIndexMode mode        : Set the index type used to retrieve thread frames' variables (AUTO, PAR, VAR)
classes                        : List the classes loaded by the VM
signature|sig [OPTION]... cid  : Information about a specific class
fields [OPTION]... cid         : List the fields of a type
methods [OPTION]... cid        : List the methods of a type
call|invoke [OPTION]... cid method : invoke a method.
read|get [OPTION]... objectId  : Read an object or array.
set [OPTION]... objectId new_value : Set a method variable or parameter as a typed-value
pull remotePath localPath      : adb-pull on steroid
VM>
Warning
Many commands can only run when the target or target thread is suspended or paused.
Note
Type help <command> to see specific help for that command.
Note
Press Enter on a white-line to repeat the previously executed command.
There are three types of commands offered by the Dalvik debugger VM interpreter:
- program commands:
info,libs,detach,kill,pull,frameSlotIndexMode - thread commands:
thread,threads,pause,resume,step,stepo,stepu,b,bc - object interaction commands:
classes,sig,fields,methods,call,get,set
Program commands#
infowill provide information about JDWP. Below, Java 8 and JVM-DI 2.
VM> info
Debuggee is running on ?
VM information: JDWP:"Java Debug Wire Protocol (Reference Implementation) version 1.8
JVM Debug Interface version 1.2
JVM version 8 (Dalvik, )" v1.8 (VM:Dalvik v8)
VM identifier sizes: f=8,m=8,o=8,rt=8,fr=8
libswill always be empty for a JDWP debugger: libraries are not application to Dalvik bytecode running in a VM.
Note
A native debugger's libs command does provide information.
-
detachwill attempt to detach the target without killing it -
killwill terminate the target process (and therefore detach from it as well) -
pullis similar toadb pull ...but will make use of thesubinary to elevate privileges when necessary (assumingsube present and found on the target device). -
frameSlotIndexModeis used to switch between parameter-indices (pX) and variable-indices (vX) when issuing thread frame slot read/write commands. (See above for details on which scenarios this command may be useful.)
Thread commands#
-
threadis used to retrieve or set the default thread, i.e. the thread to which most commands will be applied to if no thread id is explicitly provided. -
threadslists the threads and their states -
pausesuspends the target: all threads will be suspended -
resumeresumes the target: all threads will be resumed.
Warning
Keep in mind that pausing/resuming actions are stacked. E.g., a a thread X was already suspended, executing pause, then resume, will not resume thread X.
-
steporstepiis used to perform a single-step, and enter methods (Dalvik or Native) if necessary -
stepoperforms a single-step but does not enter methods. -
stepuwill step until the current method returns. -
bis used to list or add breakpoints on method's bytecode (not the method itself) or fields. Breakpoints on fields will trigger on field access (read or write).
VM> b
0 - Lcom/xyz/appcheck/AppCheck;->vFloat:F [enabled: true]
1 - Lcom/xyz/appcheck/AppCheck;->runTest(Lcom/xyz/appcheck/TestId;)Z+23Ah [enabled: true]
2 - Lcom/xyz/appcheck/AppCheck;->runTest(Lcom/xyz/appcheck/TestId;)Z+248h [enabled: false]
3 - Lcom/xyz/appcheck/AppCheck;->runTest(Lcom/xyz/appcheck/TestId;)Z+250h [enabled: true]
VM> b Lcom/xyz/appcheck/AppCheck;->runTest(Lcom/xyz/appcheck/TestId;)Z+21Ah
Lcom/xyz/appcheck/AppCheck;->runTest(Lcom/xyz/appcheck/TestId;)Z+21Ah (u={Unit:name={Bytecode},type={dex}},a={Lcom/xyz/appcheck/AppCheck;->runTest(Lcom/xyz/appcheck/TestId;)Z+21Ah}) [enabled=true]
bcis used to clear one or all breakpoints.
VM> bc 5  # clear breakpoint #5
VM> bc    # clear all breakpoints
Class/object commands#
classeslists all currently loaded classes. Not all classes of an app may be loaded when the command is executed.
Note
Types are referenced by their canonical JVM name (Lcom/abc/Foo;) or their cid (internal id representing a type during for a given debugging session).
A target class can also be inferred from an object reference:
thisobject- the object id, prefixed with
@character - any object that can be referenced from these ones.
Types have an associated type tag (1 for a class, 2 for an interface, 3 for an array) and a status bit flags (0x1 if the type was verified, 0x2 if it was prepared, 0x4 if it's been loaded, 0x8 on error; most types listed by the classes command should have status 7, meaning they have been verified, prepared and loaded).
VM> classes
15822 classes
- id=4542,tag=2,status=0x7,sig=Landroid/hardware/radio/V1_4/IRadioResponse;
- id=1849,tag=1,status=0x7,sig=Lcom/android/internal/telephony/uicc/euicc/-$$Lambda$EuiccCard$okradEAowCk8rNBK1OaJIA6l6eA;
- id=8675,tag=1,status=0x7,sig=Landroid/net/NetworkRequest$2;
- id=4819,tag=1,status=0x7,sig=Landroid/net/NetworkRequest$Type;,genSig=Ljava/lang/Enum<Landroid/net/NetworkRequest$Type;>;
- id=3277,tag=1,status=0x7,sig=Landroid/os/IProgressListener$Stub;
- id=12717,tag=2,status=0x7,sig=Ljava/net/SocketImplFactory;
...
methodsis used to list the methods of a type:
VM> methods Ljava/lang/String;
sig=Ljava/lang/String;,genSig=Ljava/lang/Object;Ljava/io/Serializable;Ljava/lang/Comparable<Ljava/lang/String;>;Ljava/lang/CharSequence;
98 methods:
- id=1892428248,mod=0x8,name=<clinit>,sig=()V
- id=1892428288,mod=0x1,name=<init>,sig=()V
- id=1892428328,mod=0x0,name=<init>,sig=(II[C)V
- id=1892428368,mod=0x1,name=<init>,sig=(Ljava/lang/String;)V
- id=1892428408,mod=0x1,name=<init>,sig=(Ljava/lang/StringBuffer;)V
- id=1892428448,mod=0x1,name=<init>,sig=(Ljava/lang/StringBuilder;)V
- id=1892428488,mod=0x1,name=<init>,sig=([B)V
...
VM> methods this.mActionBar
Lcom/android/internal/app/WindowDecorActionBar;
110 methods:
- id=9639,mod=0x8,name=<clinit>,sig=()V
- id=9641,mod=0x1,name=<init>,sig=(Landroid/app/Activity;)V
- id=9643,mod=0x1,name=<init>,sig=(Landroid/app/Dialog;)V
- id=9645,mod=0x1,name=<init>,sig=(Landroid/view/View;)V
- id=9647,mod=0xF0001008,name=access$000,sig=(Lcom/android/internal/app/WindowDecorActionBar;)Z
- id=9649,mod=0xF0001008,name=access$100,sig=(Lcom/android/internal/app/WindowDecorActionBar;)Landroid/view/View;
...
fieldsis used to list the fields of a type:
VM> fields this
Lcom/xyz/appcheck/AppCheck;
23 fields:
- id=87,mod=0x18,name=MODTS,sig=Ljava/lang/String;
- id=89,mod=0x18,name=TAG,sig=Ljava/lang/String;
- id=91,mod=0xA,name=instance,sig=Lcom/xyz/appcheck/AppCheck;
- id=93,mod=0x1,name=key,sig=Ljava/lang/String;
- id=95,mod=0x1,name=tTGroup,sig=Ljava/lang/ThreadGroup;
- id=97,mod=0x1,name=vArrayInt,sig=[I
...
callis used to invoke any method on objects or classes. Arguments must be separated by commas, e.g.
VM> call this toString
string@9399:"com.xyz.appcheck.AppCheck@7d6f5da"
VM> call v0 f1 "hello", "world"
...
Warning
Code is executed on the target when using the call command. The target state may be modified.
getandsetare used to read and write stack-frame local variables (similar to what the Locals view provide), object fields, and static fields:
Reading a local variable:
VM> get v0
1
VM> set v0 10
VM> get v0
10(Ah)
Setting and reading an object's attributes:
VM> set this.vArrayInt [I{1, 2, 3, 4}
VM> get this.vArrayInt
array@16049 (type=[I)
[1, 2, 3, 4]
VM> set this.mystring "FOOBAR"
VM> get this.mystring
string@1234:"FOOBAR"
Reading a static field:
VM> get Lcom/xyz/appcheck/AppCheck;->TAG
string@15848:"APPCHECK"
VM> set Lcom/xyz/appcheck/AppCheck;->TAG "blah"
VM> get Lcom/xyz/appcheck/AppCheck;->TAG
string@15844:"blah"
Note
The interpreters support auto-completion with the Tab key.
Native debugging#
Note
This section assumes that the app has bytecode and native libraries stored in the standard APK's lib/ folder. To debug native code only (Android or not), you will need to start gdbserver on the target manually, and connect remotely (Debugger, Attach, Remote tab).
Native debugging of Android apps is done remotely over the gdb protocol and the lldb extensions. JEB implements a gdb/lddb client and connects to the on-device gdb-server/lldb-server. By default, lldb-server is the preferred debugger server dropped on the target.
Warning
When attaching to the target app, remember to tick "Allow Children Debuggers".
Needless to say, it is worth getting familiar with x86 and arm assembly (preferably their 64-bit variants, for which getting acquainted with their 32-bit parent if necessary).
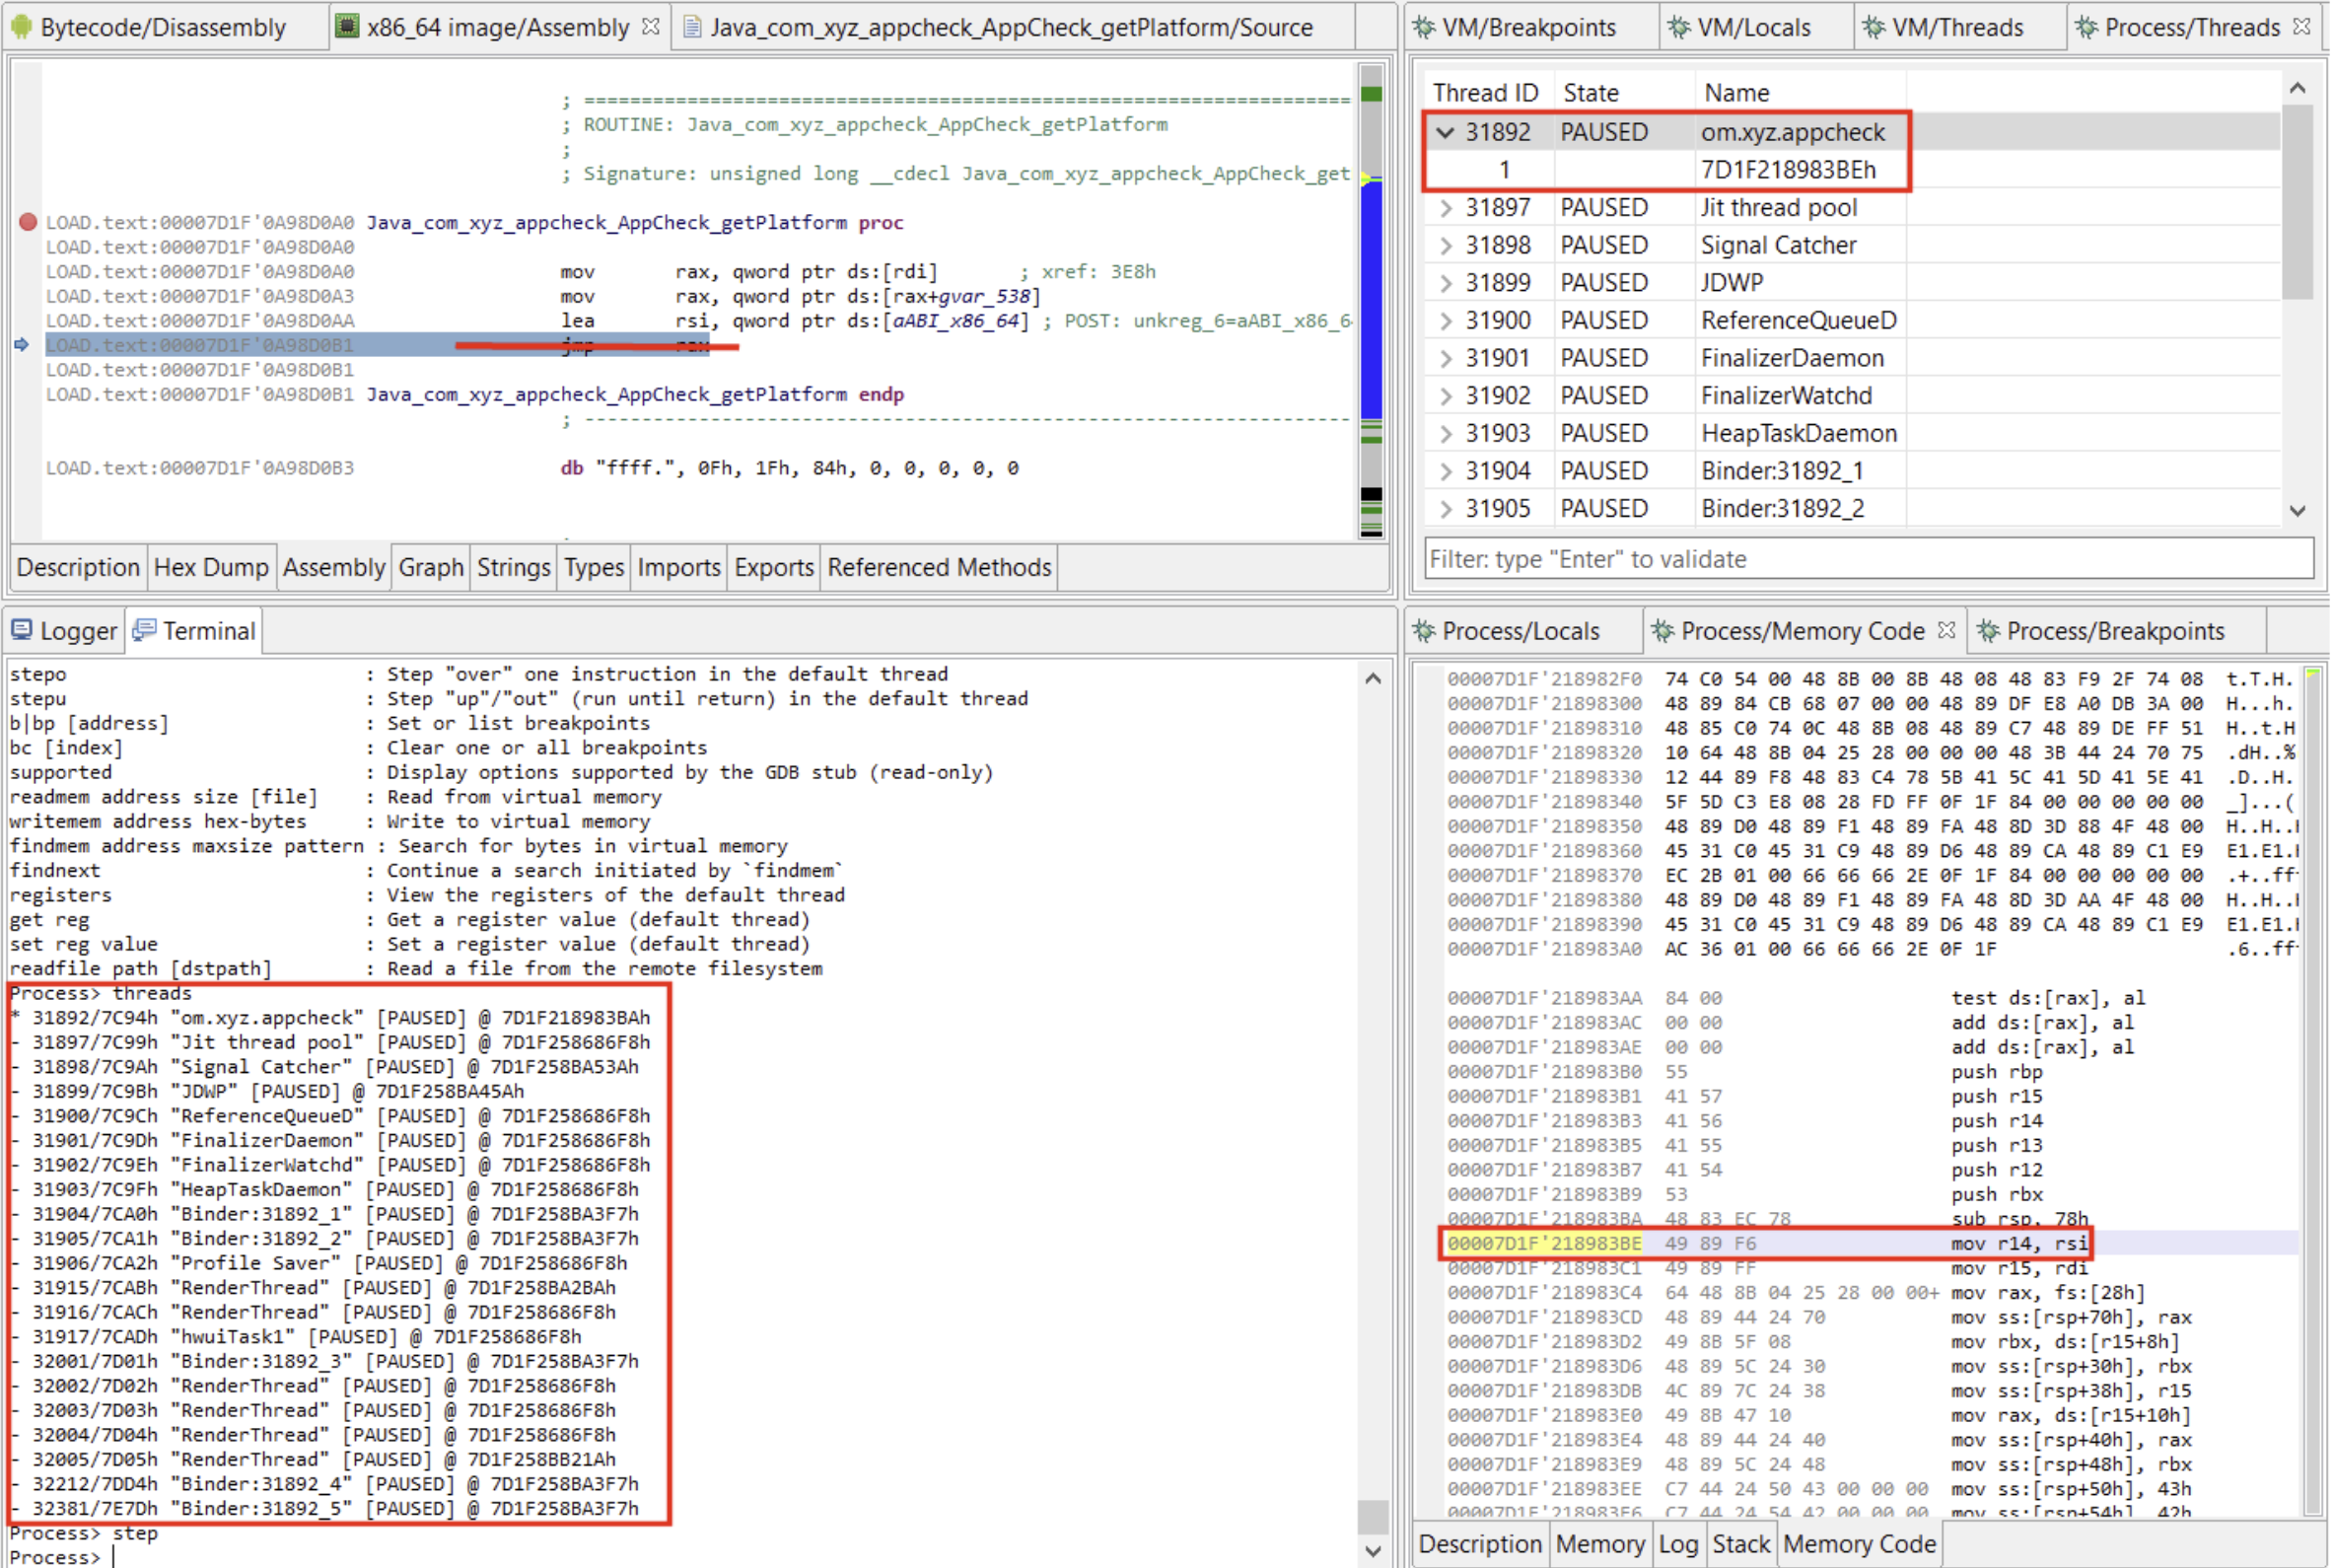
Active Debugger#
Focus a fragment related to native debugging to ensure debugging commands are issued to the native debugger.
If the Terminal is opened, the prompt will change to Process to reflect the change as well: interpreter commands will be issued to the gdbserver. Issue an info command, you should see basic target information, e.g.:
Process> info
Debuggee is running on ARM64 (LITTLE_ENDIAN)
Target process id: 19218
Target is being debugged by lldb-server
Native threads vs VM threads#
Warning
Always remember that the Dalvik VM runs within the Native process, and that VM threads are backed by Native threads. That includes the JDWP server thread as well! If you pause Native threads, the VM threads will freeze as well, despite what the Dalvik debugger fragments may indicate.
This "nested debuggers" situation, if not managed properly, can lead to strange situations, and in fine, the JDWP debugger may lose control of the target.
Rules of thumb:
- when debugging native code, do not attempt to interact with the JDWP debugger
- make sure the Native process is not paused when issuing JDWP commands, e.g., unless necessary/wanted, you should disable Native breakpoints that may be hit and interrupt a VM debugging session abruptly
Java to Native code transitions#
Dalvik code can call into Native code by invoking methods with that have the Java modifier (attribute) native.
- Set a breakpoint on the dispatch instruction, not on the Java native method itself.
- When the breakpoint is hit, issue a Step Into command to auto-switch to Native code debugging
- Be patient, native code analysis is taking place as you're switching code
- The native breakpoint was automatically created and will be automatically released upon returning to Dalvik
- Resume native debugging to go back to Dalvik; the code will auto-break on return from invoke-xxx
Example:
- Source:
Java code:
package com.xyz.appcheck;

class AppCheck {
    static {
        System.loadLibrary("somelib");
    }
    ...
    String foo() {
        ...
        return getPlatform();
    }

    public native String getPlatform();
}
...
C code:
jstring Java_com_xyz_appcheck_AppCheck_getPlatform(JNIEnv* env, jobject thiz) {
    ...
}
- Transition in JEB:
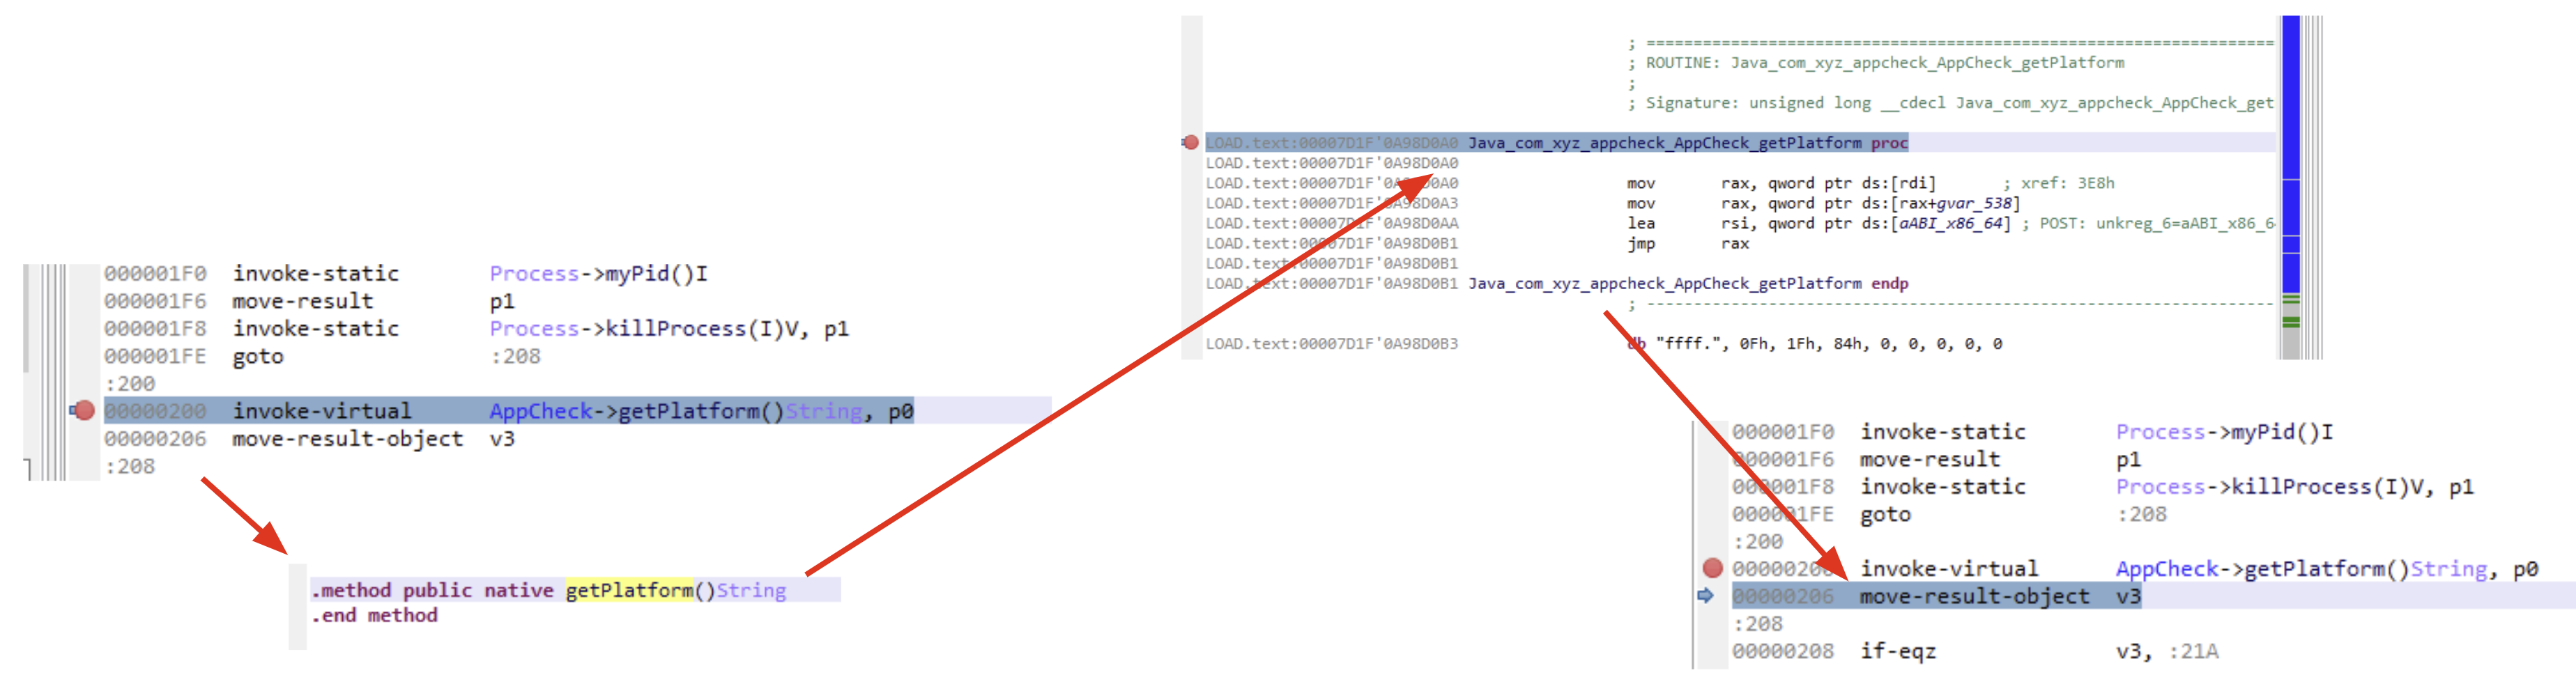
How was Java's com.xyz.appcheck.AppCheck.getPlatform linked to C's Java_com_xyz_appcheck_AppCheck_getPlatform? The process of binding Java methods to native methods (in the case above, binding was done automatically), as well as input and output object conversions and the library code to manipulate them while executing native code, is defined in the Java Native Interfaces specifications.
JNI basics#
Method linking and dispatching is an important aspect of JNI, which reverse-engineers should understand in order to work around difficult cases, including Java methods statically linked.
Dynamic linking#
When a native Java method is executed, the VM will look for a native method having:
- the following name:
Short_Form=
"Java_" + mangled_classname + "_" + mangled_methodname - or, if the method is overloaded, the following name:
Long_Form =
Short_Form + "__" + mangled_argsigs
The mangling scheme is the following:
.       => _
/       => _
_       => _1
;       => _2
[       => _3
\uXXXX  => _0xxxx (unicode char.)
Types names for mangled_argsigs are using the canonical JVM convention:
boolean   => Z
byte      => B
char      => C
short     => S
int       => I
long      => J
float     => F
double    => D
classname => La/b/c/SomeClass;
Details
For additional details, refer to this part of the official specifications.
Examples for auto-binding:
void f(int x) in class com.xyz.A
=> short form: Java_com_xyz_A_f
=> long form: Java_com_xyz_A_f__I
void g(long array[], String s) in class com.\x4f60\x597d
=> short form: Java_com__04f60_0597d_g
=> long form: Java_com__04f60_0597d_g___3JLjava_lang_String_2
Static linking#
Native libraries can use the JNI function RegisterNatives to manually bind native methods to Java counterparts, while not adhering to the JNI naming convention used for dynamic linking.
RegisterNatives can be called anywhere.
Example
In the snippet, a Java method a.b.c.Foo.methodX()V is bound to a static, non-exported native method routineX.
jint JNI_OnLoad(JavaVM* vm, void* reserved) {
    JNIEnv* env = NULL;
    if(vm->GetEnv(&env, JNI_VERSION_1_4) != JNI_OK) {
        return -1;
    }
    if(registerNatives(env) != JNI_TRUE) {
        return -1;
    }
    return JNI_VERSION_1_4;
}

int registerNatives(JNIEnv* env) {
    if(!registerNativeMethods(env, classPathName, methods, sizeof(methods) / sizeof(methods[0]))) {
        return JNI_FALSE;
    }
    return JNI_TRUE;
}

int registerNativeMethods(JNIEnv* env, const char* className, JNINativeMethod* gMethods, int numMethods) {
    jclass clazz = env->FindClass(className);
    if(clazz == NULL) {
        return JNI_FALSE;
    }
    if(env->RegisterNatives(clazz, gMethods, numMethods) < 0) {
        return JNI_FALSE;
    }
    return JNI_TRUE;
}

static const char *classPathName = "a/b/c/Foo";
static JNINativeMethod methods[] = {
        {"methodX", "()V", (void*)routineX},
};

// bound to Java method: a.b.c.Foo.methodX()V
static jint JNICALL routineX(JNIEnv* env, jobject thiz, jint a, jint b, jint c) {
    //...
}
Additional views#
On top of the usual debugger fragment that were described in the Dalvik debugger section (threads, breakpoints, locals), native debuggers provide additional fragments.
Memory code#
The memory fragment displays the data and instructions located at any address within the target process. It is helpful in many situations, such as:
- simple memory exploration and scanning
- snooping around Dalvik VM internal structures, and modifying them
- single-stepping over code outside the analyzed .so files contained in the app's lib/ folder
A situation where the third scenario arises is when entering library code located somewhere in the process memory, outside a pre-analyzed so file. The execution will seem to have stalled in the main view (fixed blue line). Switch to the Memory Code fragment to see what is being executed.
Stack#
The stack view is similar to the memory fragment: it represents words of memory located at around the standard stack pointer on the target architecture (esp, rsp, r13, x31, etc.).
Additional interpreter commands#
...
Settings#
The Android debuggers offer options to control low-level debugger parameters, such as ports and timeouts.
Filter on dbug_apk and dbug_elf in the Engines options:
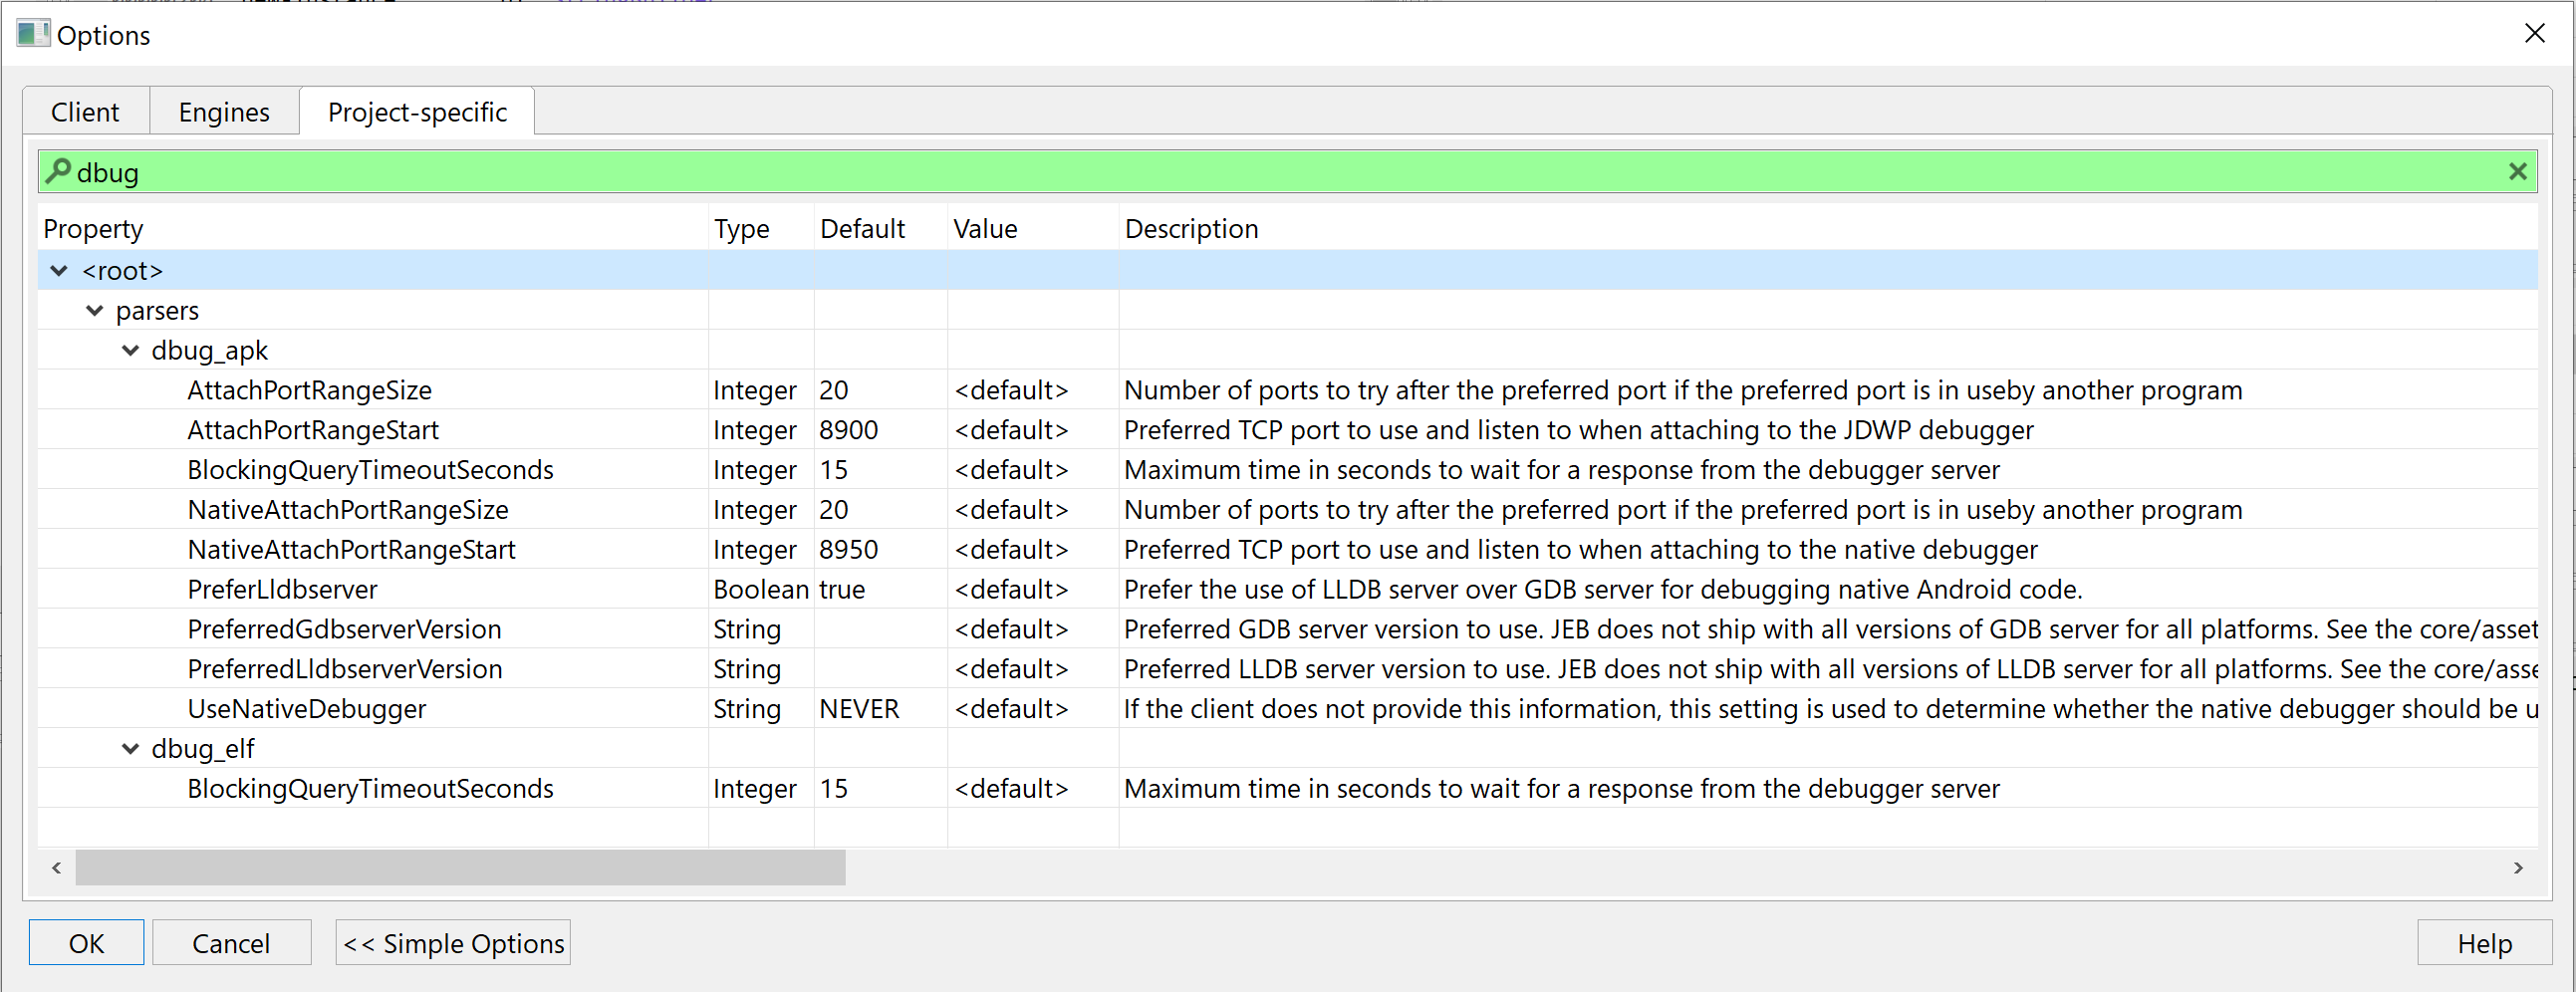
The full documentation of each option can be found on this page.
API, Scripts, Plugins#
Debugger modules in implement the set of interfaces contained in the com.pnfsoftware.jeb.core.units.code.debug package. The principal interface in this package is IDebuggerUnit. Plugins, scripts, or third-party clients wishing to automate the usage of debuggers can use these well-defined interfaces. The official UI client uses this public API as well. Anything that the UI client does can be done and/or automated by third-party code.
Example
Check out our blog post on Android crypto primitives hooking to see how the API can be used to retrieve pre-encryption or post-decryption data on the fly.
Further Reading#
- A note on debugging caveats with recent Android versions (p, Q): Debugging Android apps on Android Pie and above
- API/Scripting: Crypto Monitoring with the Android Debuggers API
- Use-case, obfuscation: Defeating AppSolid Android application protector
- Use-case, dynamic dex: Debugging Dynamically Loaded DEX Bytecode Files
- JNI debugging helper: Dynamic JNI Detection Plugin
Reference: List to all blog articles on debugging