Note
This manual page assumes familiarity with common JEB actions and views. We also assume a minimal amount of knowledge of WebAssembly code and low-level details. For readers that would like to get up to speed with the basics of wasm from a reverse-engineering point of view, we recommend reading our technical paper Reversing WebAssembly
Note
The wasm decompiler update shipping with JEB 4, whose pre-release is planned for Q2 2020, fills up several gaps present in the first version of the decompiler, e.g. floating point support, casting and reinterpret opcodes, etc.
JEB Pro can be used to analyze and decompile WebAssembly binary modules (wasm). The decompiler produces C-like code. Three modules, relying on the Native Code Analysis Pipeline, handle WebAssembly binaries: a wasm binary parser, a disassembler extension, and a decompiler extension.
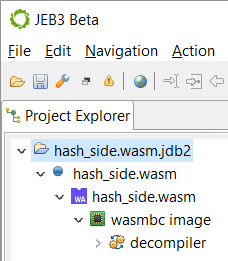
After opening a wasm binary in JEB, it will be recognized and processed as such by the WebAssembly plugin: - The top-level unit node, under the blue-dot artifact node, represents the module itself. - Its first child node is named "wasmbc image", and represents a memory view of the entire WebAssembly module, with code and data.
The module unit#
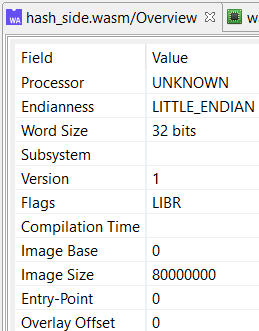
The Overview fragment displays standard information. Note the following interesting facts:
- The word-size is set to 32-bit, as the plugin assumes a wasm32 environment.
- The endianness is little endian.
- The start of image is set to 0, and the virtual image size to 2Gb: the entire module will be sparsely mapped within this memory range.
- Wasm binaries do not embed standard metadata that would hold compilation timestamps (they could be added to a custom section though).
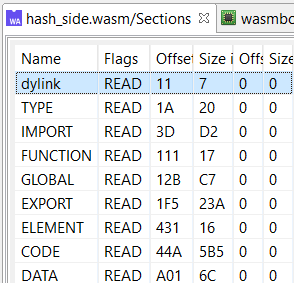
The Sections fragment represents an unmodified list of wasm sections. The in-memory size and offset are irrelevant and set to zero. Note that the example above shows a custom dylink section, most likely indicating a binary compiled with emcc and the flag SIDE_MODULE=1.
The Segments and Symbols tabs detail how the wasm plugin laid out and transformed the elements of the wasm module in order to allow the underlying code plugin to process it.
Pseudo segments#
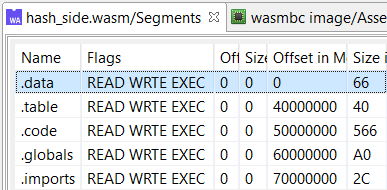
The concept of mappable segments does not exist per-say in WebAssembly. However, in order to allow JEB code plugins (disassemblers, decompilers, etc.) to function, the wasm plugin creates the following pseudo sections:
- .data starts at address 0 and maps the single Memory section (along with the Data elements that initialize it)
- .table starts at address 0x4000000 and holds a table of pointers to the functions referenced in the Table section (initialized by the Element section)
- .code starts at address 0x50000000 and contains the bytecode of all internal functions, in order of index: the first function body of size S0 is at address 0x50000000, the second at address 0x50000000+S0, the third at 0x50000000+S0+S1, etc.
- .globals starts at address 0x60000000 and maps the internal globals as standard global variables; practically, wasm' globals (accessible by {SET,GET}_GLOBAL operators) and wasm' memory bytes (accessible by load/store operators) are being treated as equals by JEB.
- .imports starts at address 0x70000000 contains pointer references to the imported (external) function section entries and global section entries
The image is set to be mapped in the [0, 0x80000000) range. Sections are sparsely mapped; only used bytes are allocated. The start addresses are flexible and can be adjusted if needed
Symbols#
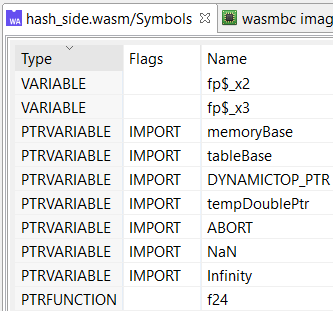
Symbols generated by the wasm plugin are of four types, and can have a variety of attributes:
- FUNCTION for internal functions
- PTRUNCTION for imported functions and referenced internal functions
- VARIABLE for globals
- PTRVARIABLE for imported globals
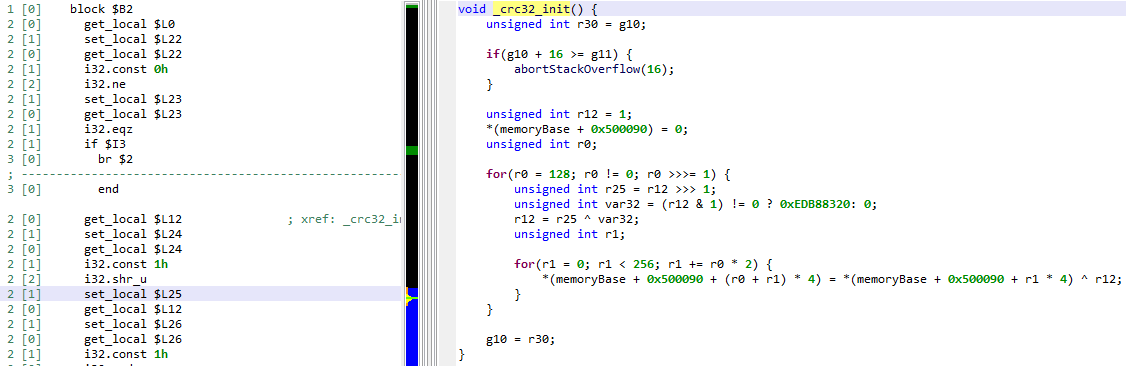
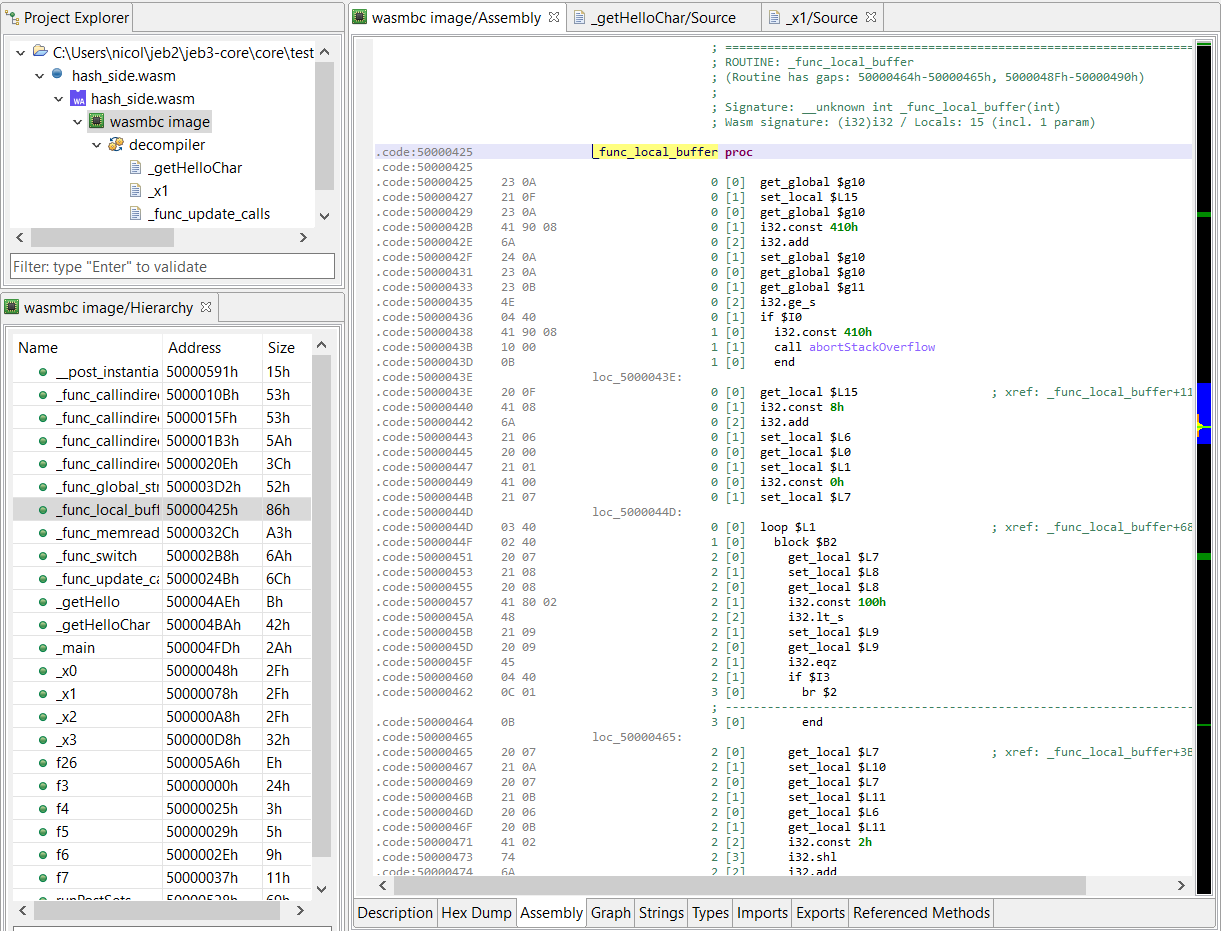
Code View#
The interactive disassembly window shows the pseudo virtual memory representing the entire WebAssembly module, as explained in the above section.
The screenshot below shows the disassembly area of an internal function. Note that JEB's representation of a function's bytecode is linear and matches the underlying binary code. The green columns prefixing the instruction indicate the current block depth and current operand stack height, pre-execution.
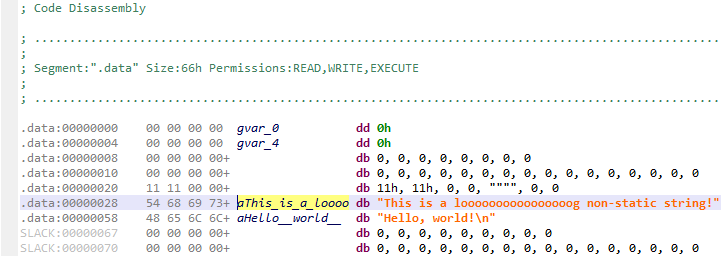
The snapshot below shows the beginning of the .data virtual segment, representing the WebAssembly Data section.
The Code view is interactive. However, code modification (i.e., tampering with routine bodies) is forbidden since they would introduce inconsistencies in the function index space.
Decompilation#
The WebAssembly decompiler plugin for JEB uses JEB's decompilation pipeline to produce pseudo C code. As such, the plugin consists of a wasm-to-IR converter and additional analyzer extensions. Slots on the operand stack are converted to standard, routine context IR variables.
As of the time of writing, the wasm decompiler has the following limitations:
- The global, advanced analysis normally provided the decompiler is partially disabled (the advanced analysis is responsible, for instance, to discover register values and callsite targets during a fast static analysis phase, and subsequently annotate the assembly listing).
- There is no support for floating point operation conversion.
- Memory stack frames, due to their dynamic (and optional) nature in WebAssembly are currently not accessible and customizable.
Those limitations will be addressed as the decompiler plugin matures.