A note about 2020 Q1 updates (versions 3.10 to 3.16) regarding the DEX/Dalvik decompiler modules:
Generic String Decryption
Lambda Recovery
Unreflecting Code
Decompiling Java Bytecode
Auto-Rename All
Generic String Decryption
JEB ships with a generic deobfuscator that can perform on-the-fly string decryption and other complex optimizations. Although this optimizer performs safe (i.e., guaranteed) optimizations in most cases, it is unsafe in the general case case and therefore, may be disabled in the options. Refer to the Engines options .parsers.dcmp_dex.EnableDeobfuscators and .parsers.dcmp_dex.EmulationSupport.
Many code protectors offer options to replace immediate string constants by method invocations that perform on-the-fly decryption.
A variety of techniques exist, ranging from simple one-off trivial decryptor methods, to complex schemes involving object(s) creation, complicated decryptors injected in third-party packages, non-trivial logic, junk code meant to slow down analyzers, use of opaque predicates, etc. They are implemented in an infinite number of ways. JEB’s generic deobfuscator can perform quick, safe emulation of the intermediate representation to provide a replacement. It may sometimes fail or bail out due to several reasons, such as performance or pitfalls like anti-emulation and anti-sandboxing techniques.
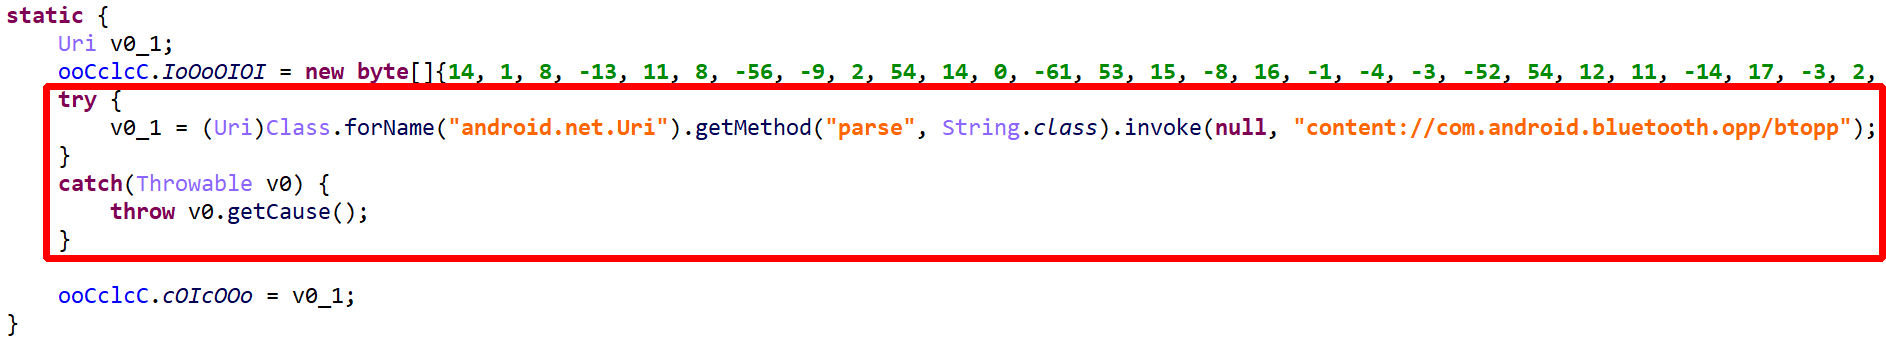
Example 1
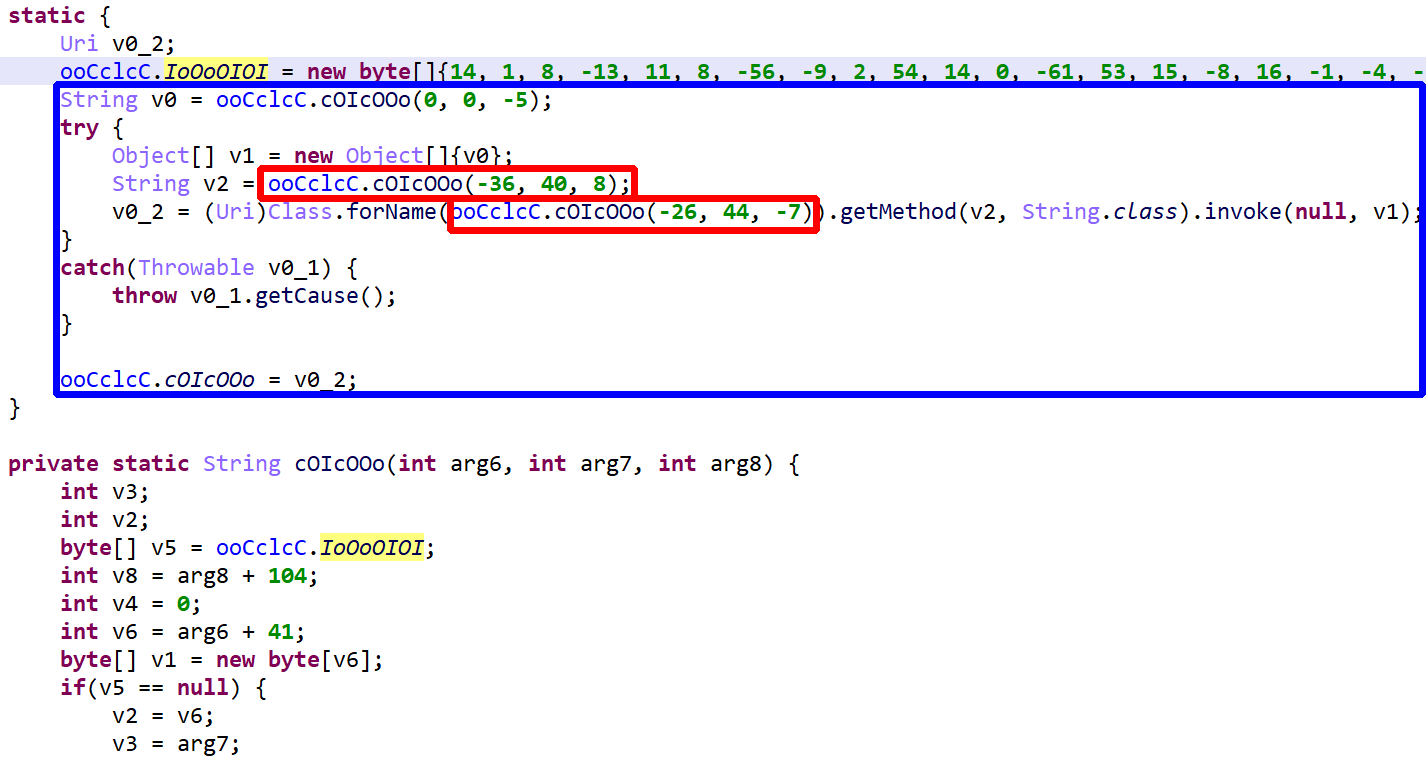
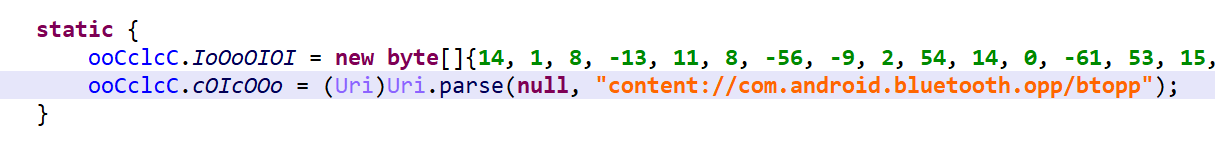
The string decryptor is a static method reading encrypted string data in a class byte array. Also note that code reflection is used.
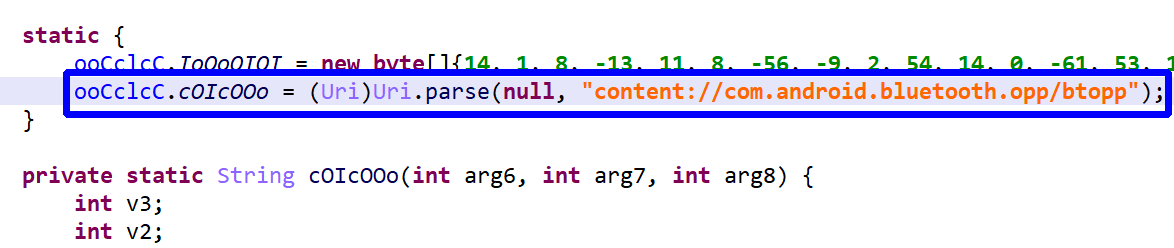
The above code (blue box) ends up being deobfuscated to:
Example 2:
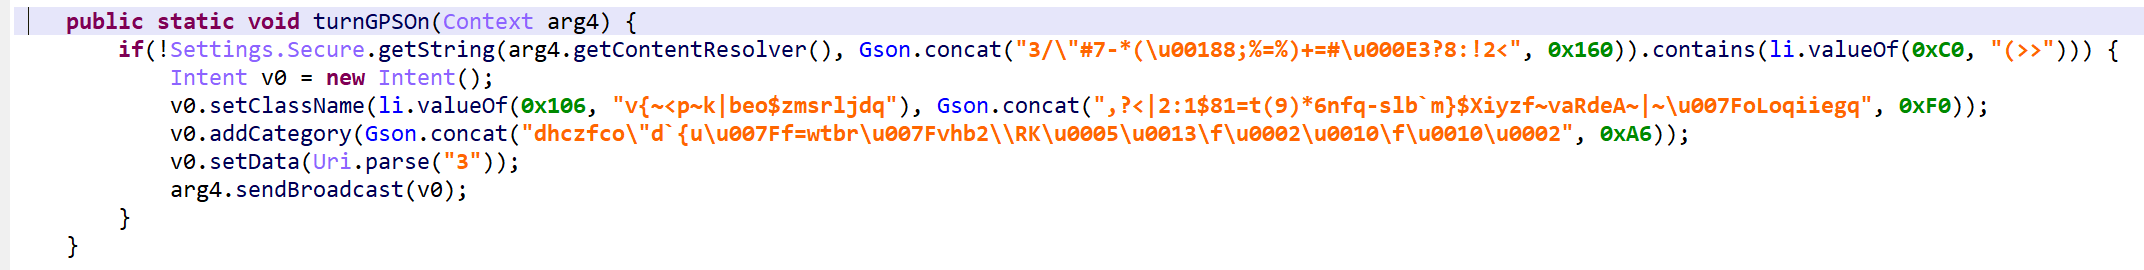
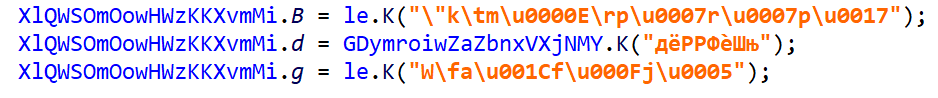
The decryption methods were injected into library packages, e.g. Gson’s
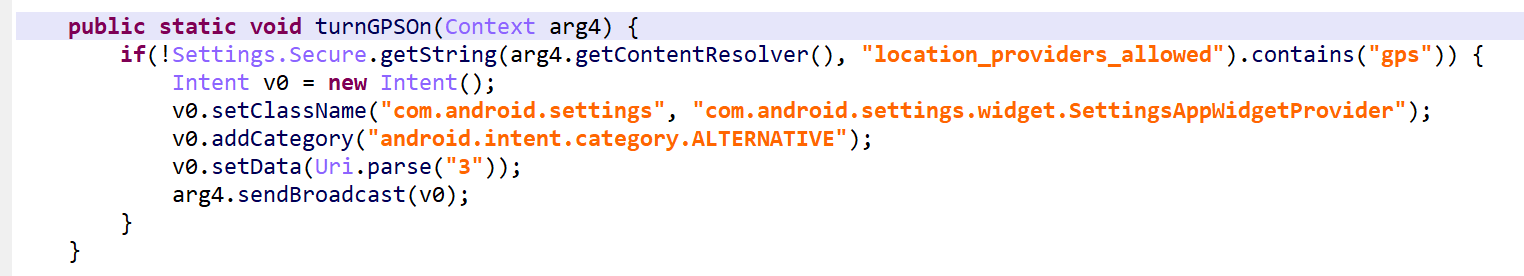
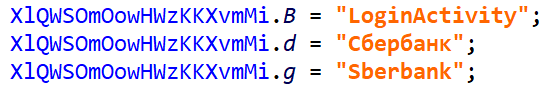
The above code is deobfuscated to:
With the generic string decryptor optimizer ON
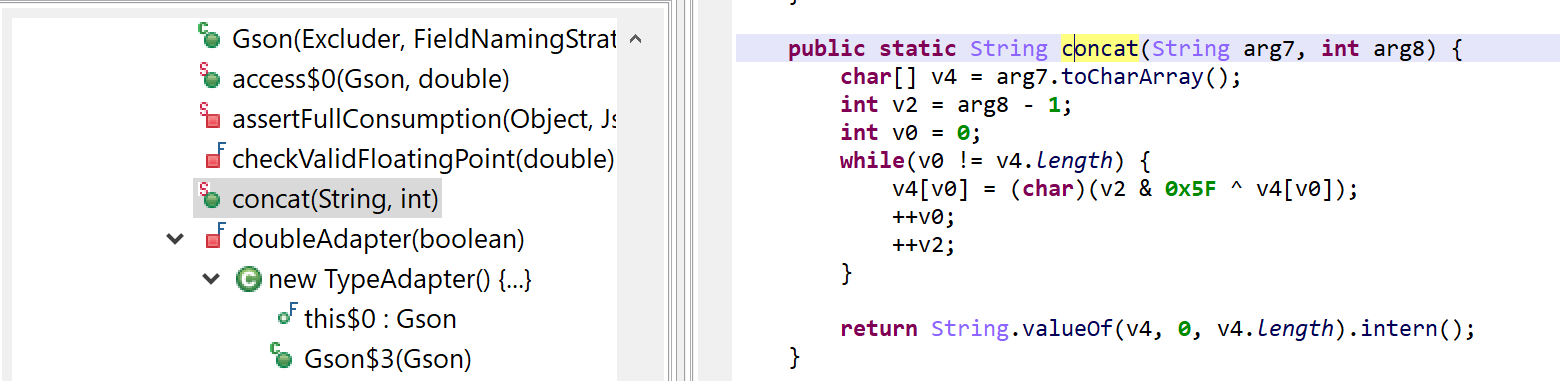
Below, a decryptor that had been injected into the com.google.gson.Gson() class:
The concat(String, int) method is not part of standard Gson, of course. It was injected by the protector and is used by (some) code to perform on-the-fly string decryption.
Example 3:
One last example, which was involuntarily – yet, quite timely! – provided by a user:
Static fields initialized with decrypted strings.After decryption.
Decrypting all strings: The decryptor kicks in when decompiling methods only. At the moment, if a string happens to be successfully decrypted, the optimizer does not attempt to recover all similarly encrypted strings in the code, although it is most certainly an addition that will make it in a future software update.
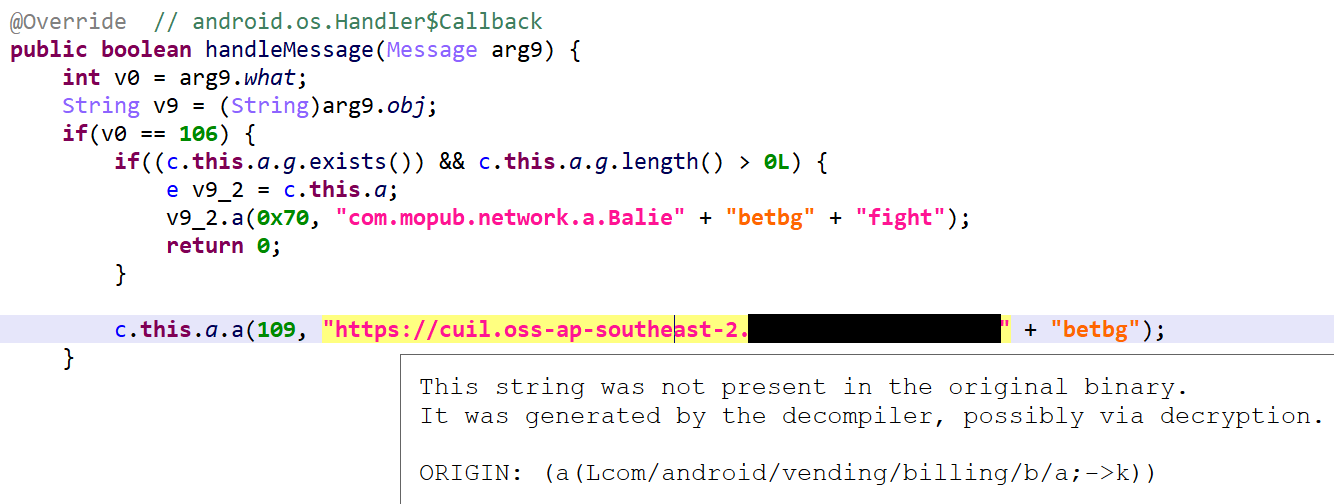
Rendering: You may quickly identify decrypted strings in the client as they are rendered using a special color associated with the itemId STRING_GENERATED, by default rendered in a flashy pink color in light and dark themes. Hovering over such items will bring up a pop-up with additional origin information, like the underlying code that would have generated that string:
Auto-decrypted strings in pink; overlays with source/origin information.
API: – From a DEX perspective: Generated strings are artificial. Therefore, IDexString.isArtificial() would return true. – From a Java/AST perspective: IJavaConstant objects that embed origin information do so using the “origin” tag. Use IJavaConstant.getTags().get("origin") to retrieve it.
Lambda Recovery
JEB attempts to perform Java 8 style lambda recovery and reconstruction.
Desugared Lambdas
Recovery and reconstruction does not rely on any type of metadata 1, such as special prefixes -$$Lambda$ for classes and methods implementing desugared lambdas in dex 37-.
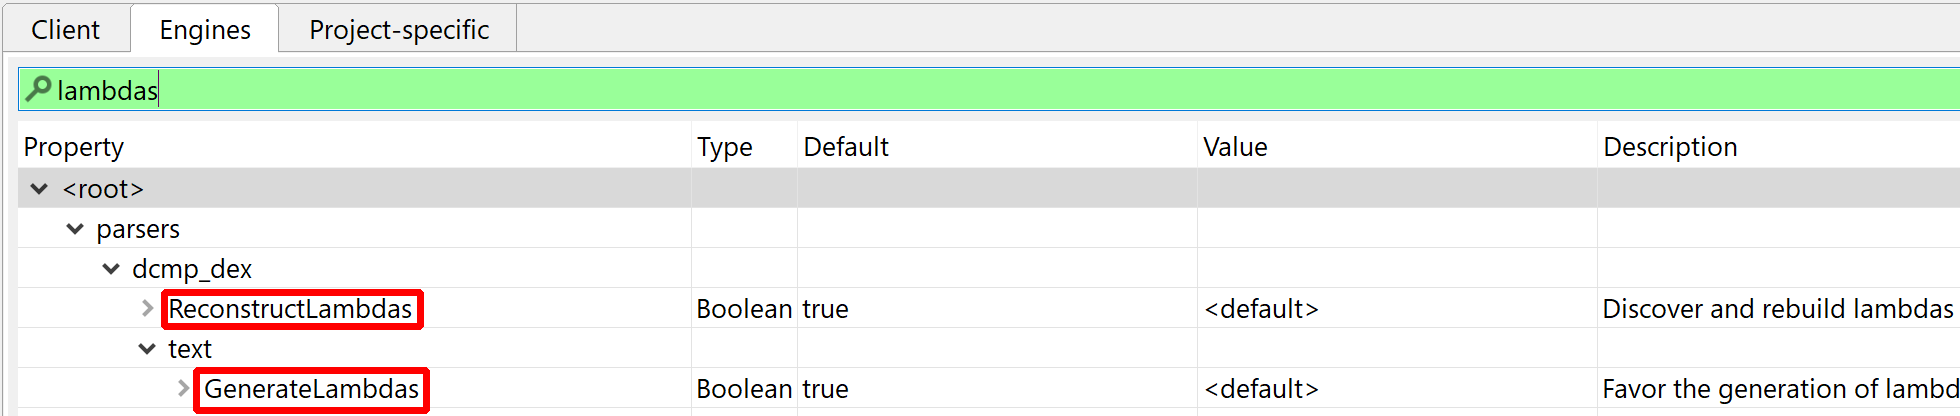
Options: Lambda reconstruction can be disabled in the options (Edit, Options, Engines, …). Lambda rendering can also be disabled in the options, as well as on-demand by right-clicking a decompiled view, Rendering Options….
Lambdas options
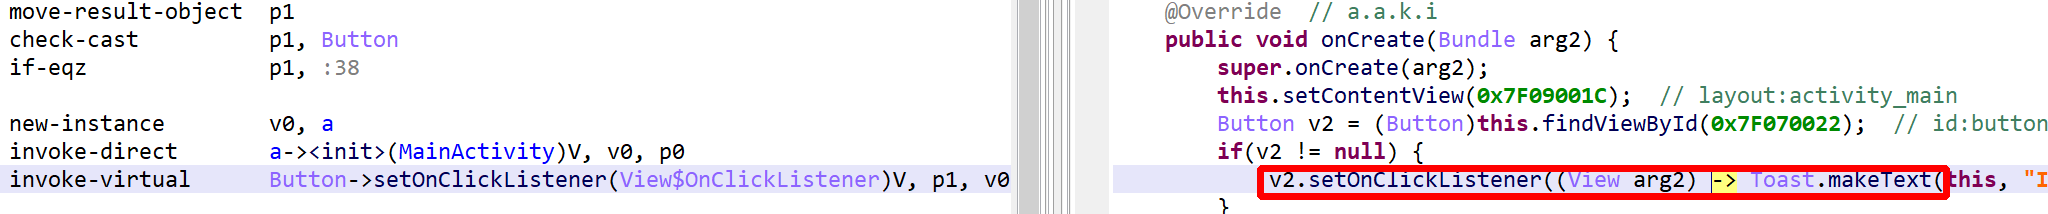
API Note: In the above cases, the underlying Java AST may be a IJavaNew or IJavaStaticField node. This is not the case for real (not desugared) lambdas, which map to an IJavaCall node – see below.
This DEX file contains real lambdas implemented via invoke-custom
API Note: Such lambdas map to an IJavaCall node for which isCustomCall() will return true.
Unreflecting Code
Many code protectors make heavy use of reflection – combined with string encryption, as we’ll see below – to obfuscate code. In practice, reflection is limited to method invocation (static and virtual), static and non-static field setting and getting, and new instance creation. A few examples:
v = Class.forName("java.lang.Integer").getMethod("valueOf",
        String.class).invoke(null, str);
// instead of
v = Integer.valueOf(str);
Class.forName("SomeClassName").getField("b").setInt(x, 4);
// instead of
x.b = 4;
Class.forName("java.lang.String").getConstructor(byte[].class)
        .newInstance(val);
// instead of
new String(arg6);
Such code is generally protected by a catch-all handler that forwards the cause of any exception raised by a reflection issue:
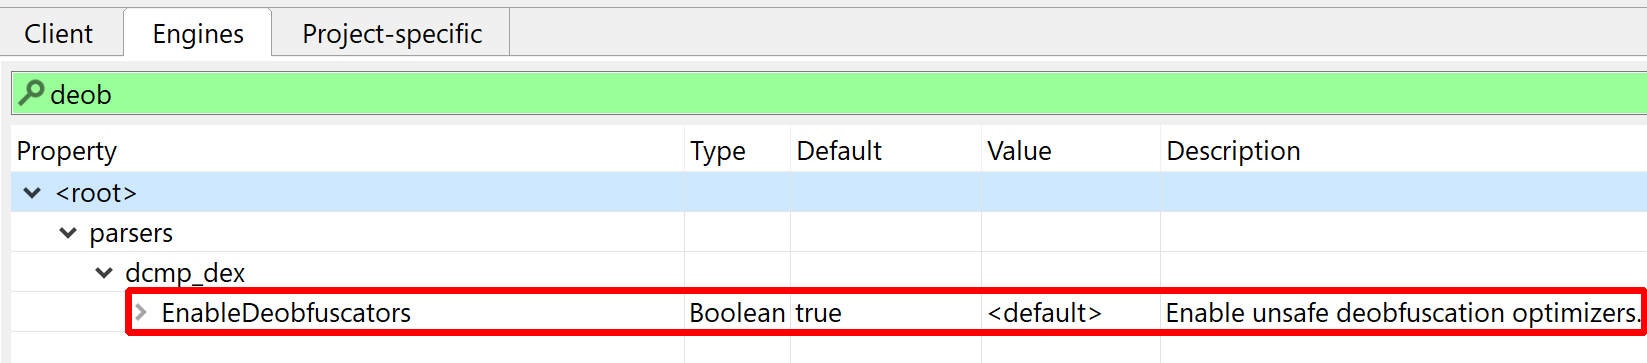
By default, JEB will attempt to unreflect code. This deobfuscator is potentially unsafe and may be disabled in the options. Note that you always have the ability to choose, for a particular decompilation, whether some options should be temporarily enabled or disabled, by pressing CTRL+TAB (or COMMAND+TAB on macOS) to decompile (same as menu Action, Decompile with options…).
Unsafe deobfuscators can be globally disabled.
So, in a nutshell, code normally decompiled to:
Reflection, not cleaned (malware was obfuscated)
will be decompiled to:
With reflection cleaned
Technical Note: This optimizer works on the Intermediate Representation manipulated by the decompiler, not to be confused with the AST rendered as its output. (The AST cleaner that was described in an older post is more limited than this IR optimizer.)
Last-step failures: Successfully unreflecting code eventually depends on being able to find the intended target method or field matching the provided description (method parameter types or field type). Failure to do so will generate a log like "A candidate field/method/constructor for unreflection was not found".
Decompiling Java Bytecode
JEB supports JLS bytecode decompilation for *.class files and jar-like archives (jar, war, ear, etc.). The Java bytecode is converted to Dalvik using Android’s dx by default. Users may choose to use d8 (not recommended for now) instead by selecting so in the Options.
The resulting DEX file(s) are processed as usual.
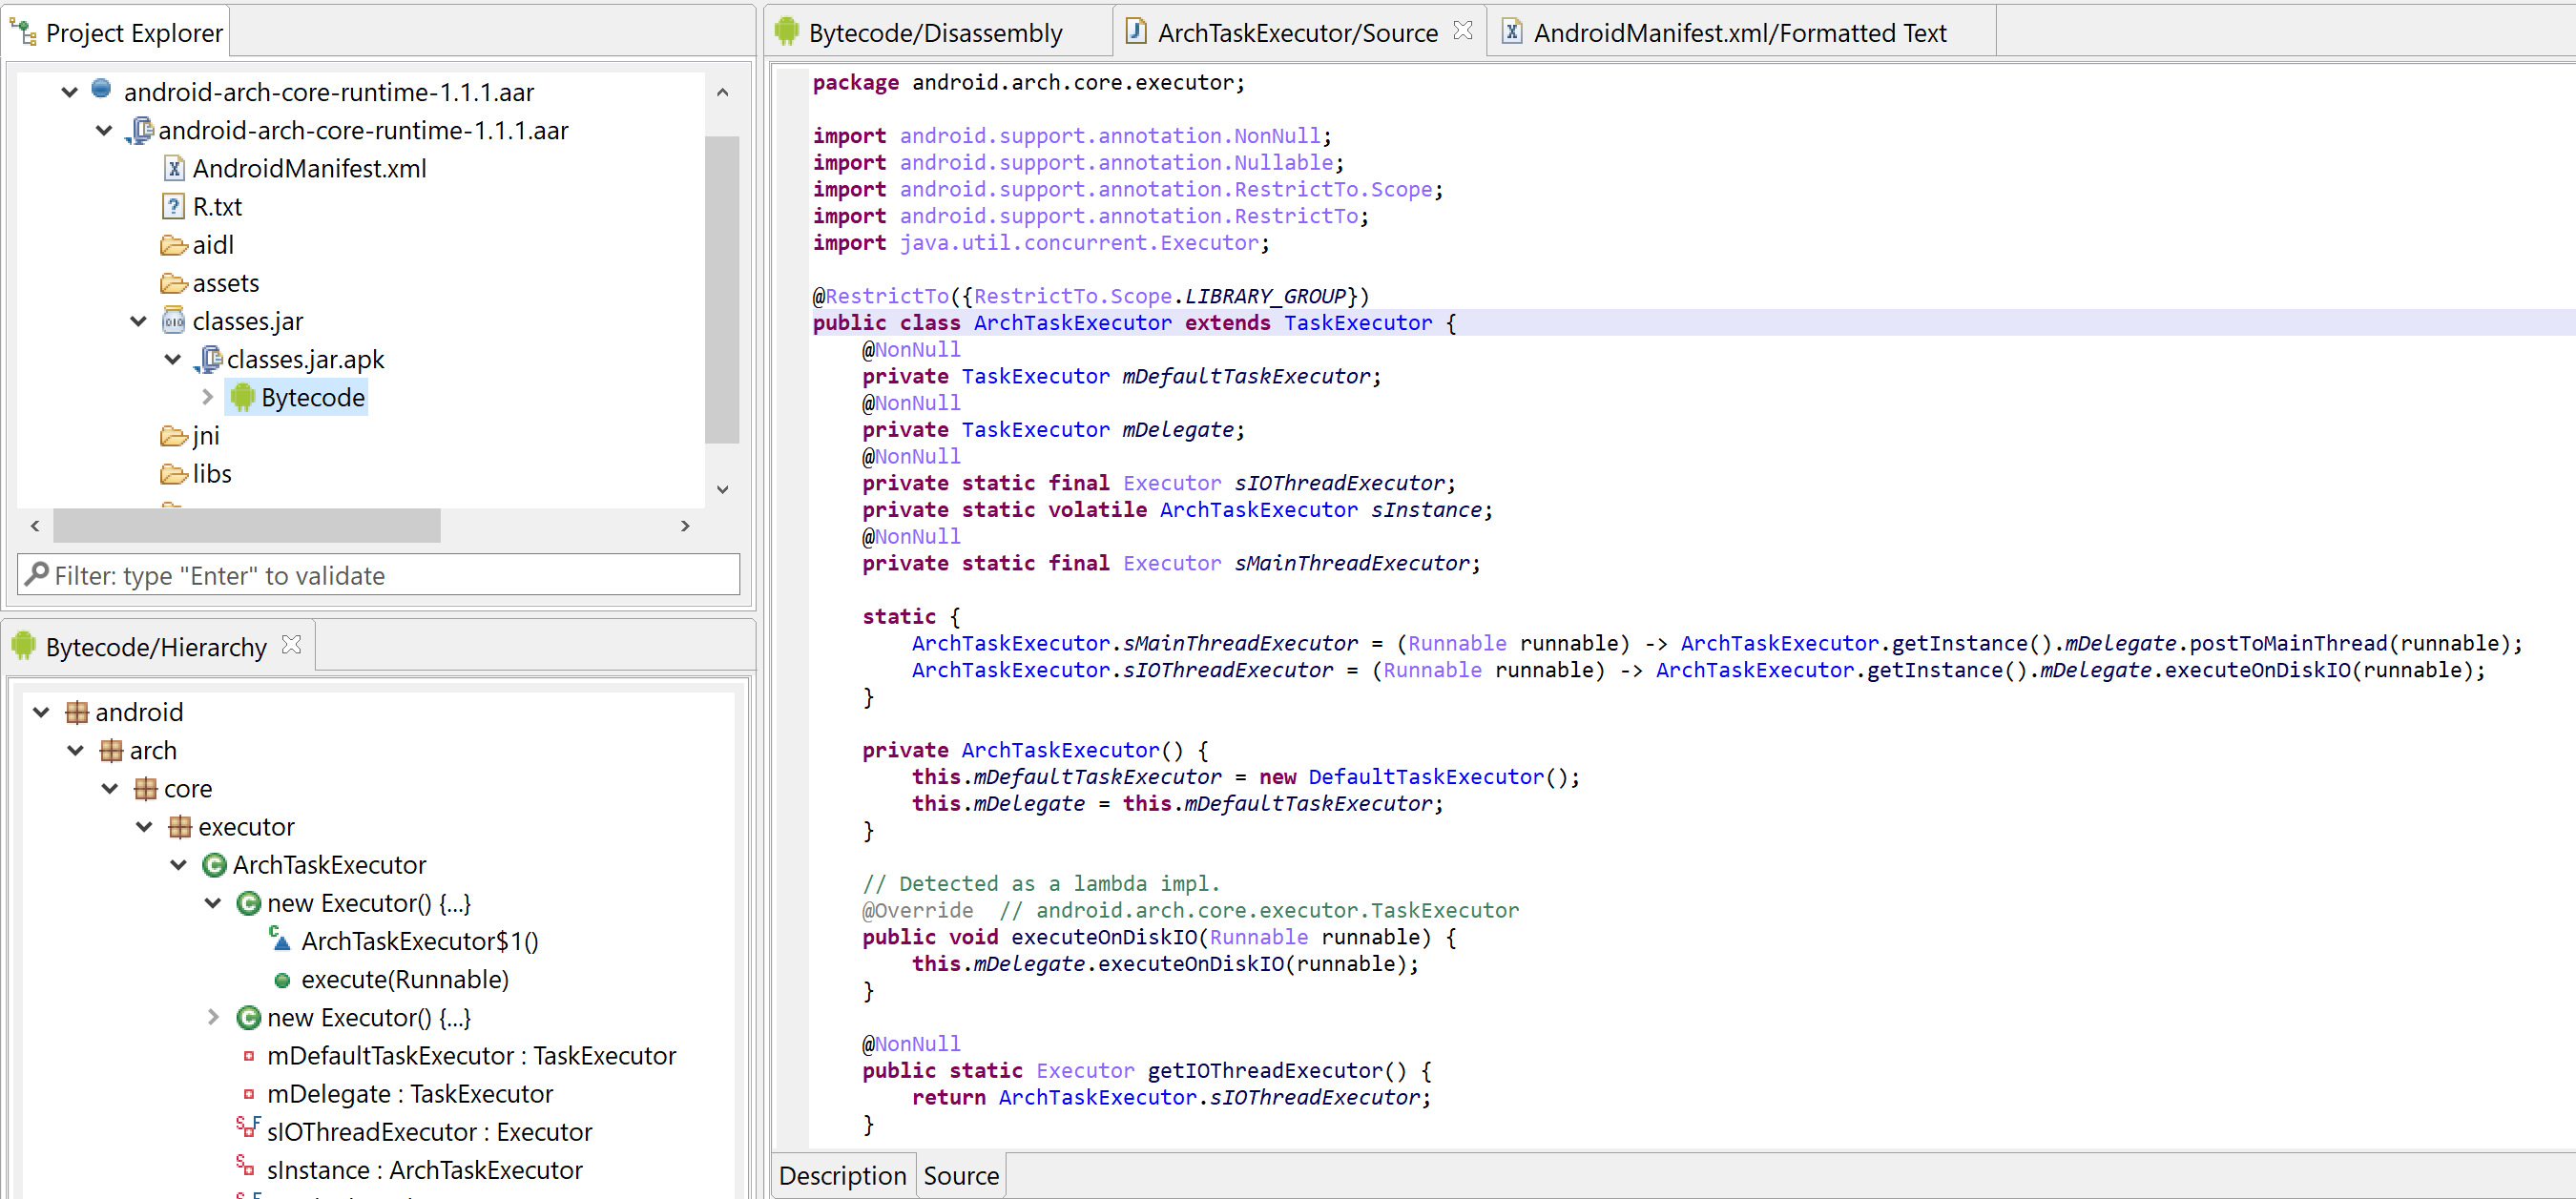
You may use this to decompile Android Library files (*.aar files) in JEB.
Examining the android-arch-core-runtime library
Auto-Rename All
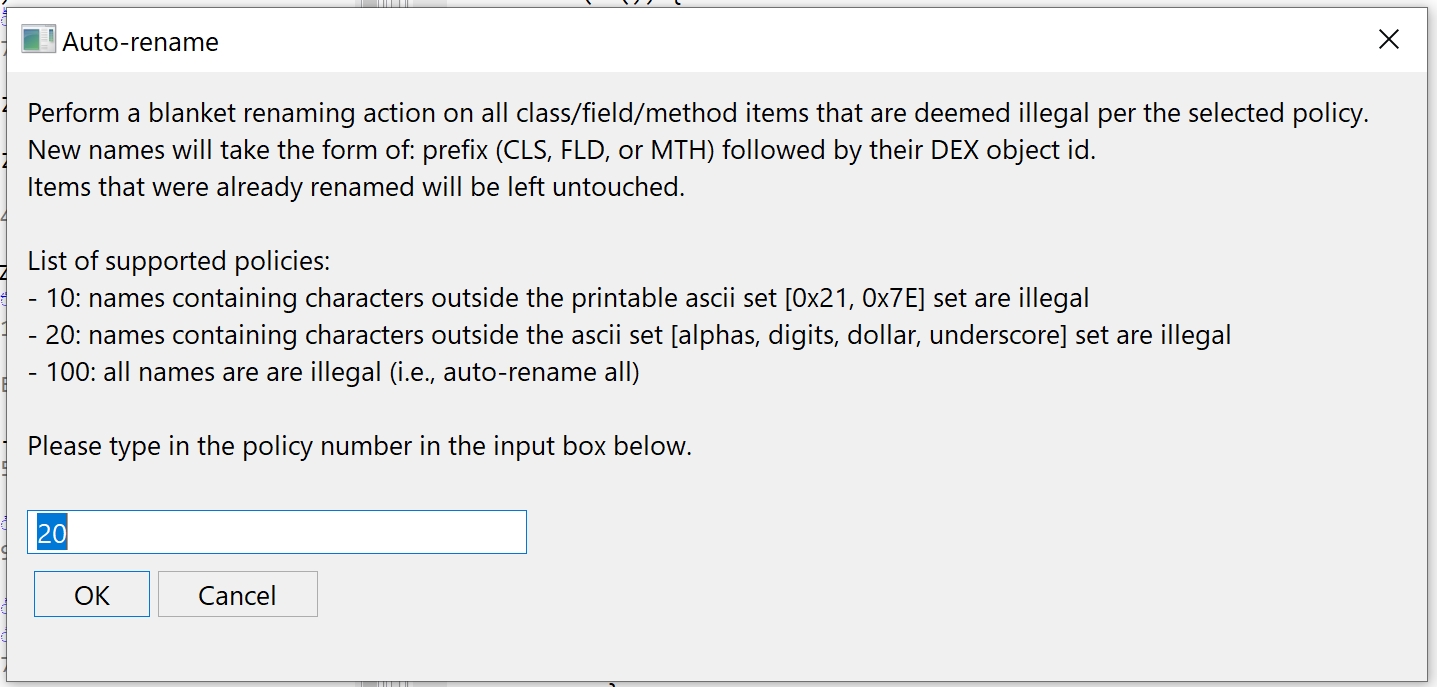
JEB 3.13 introduced a new generic action, Auto-Rename All. Its implementation is at the discretion of code plugins. The DEX plugin implements it, therefore users may execute Action, Auto-Rename All… at any time (generally after processing an obfuscated file) in order to rename code items such as field, method, or class names, to something more easily processable for our -limited- human brains.
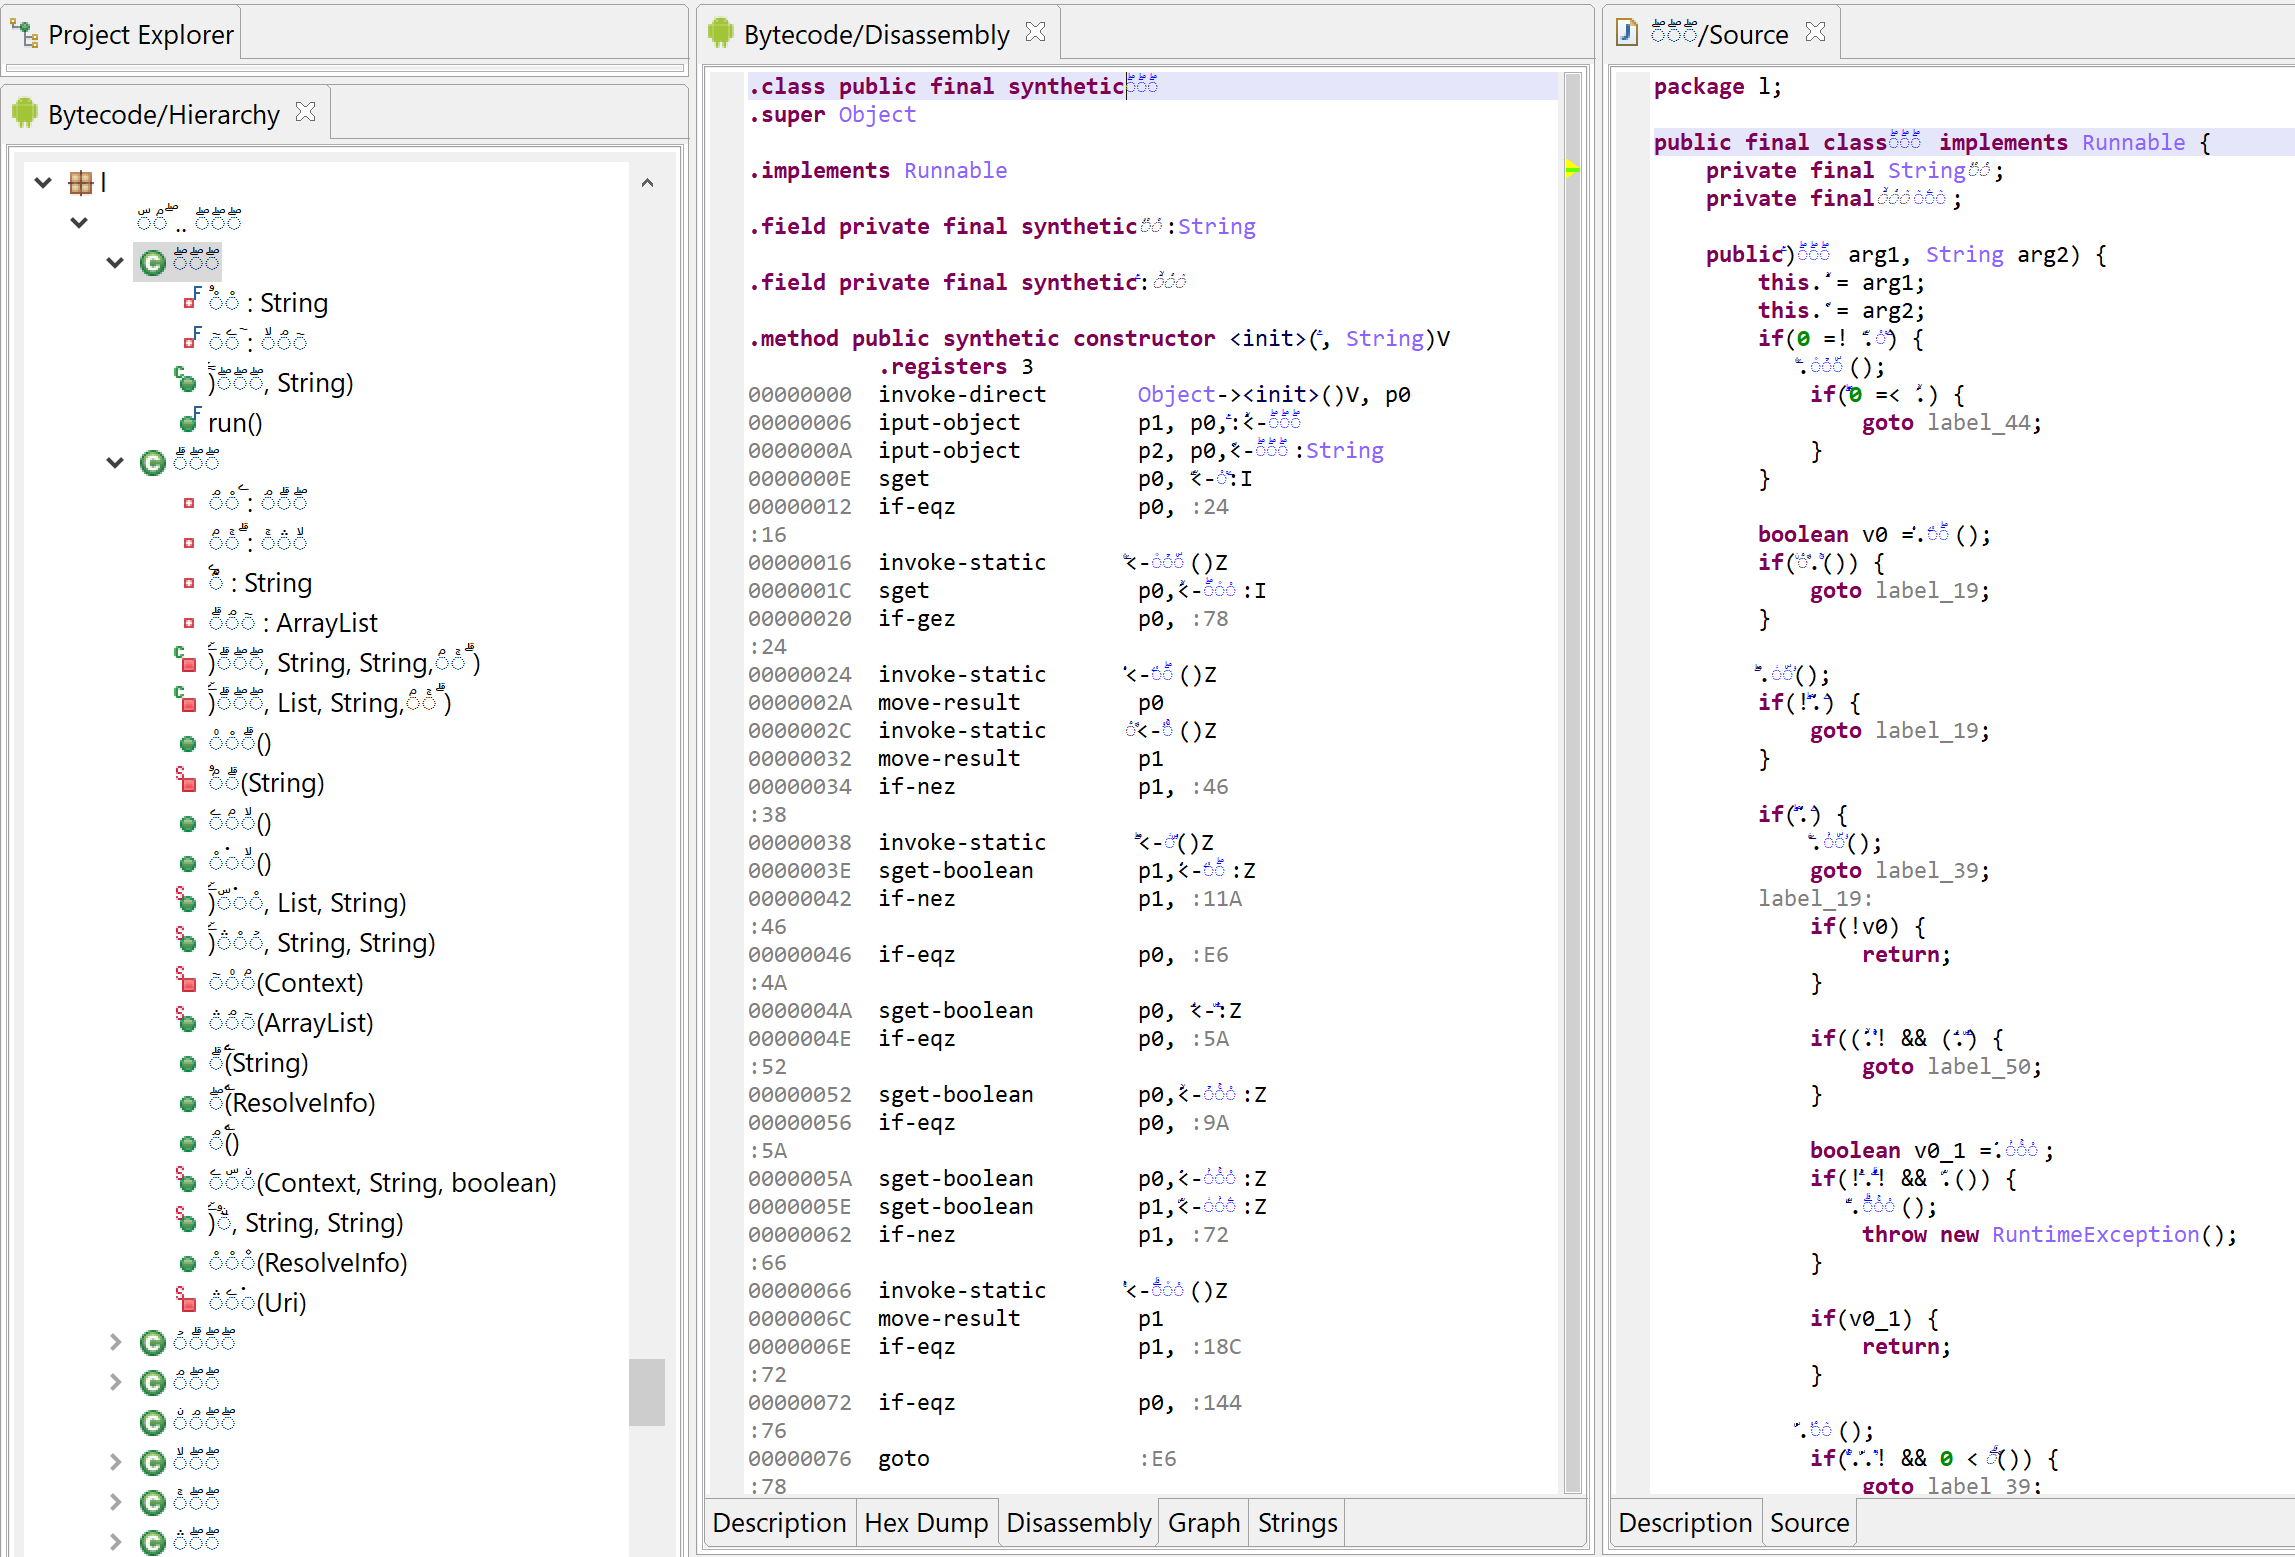
Look at this horrendous obfuscation scheme below. It’s using right-to-left unicode characters to seriously mess up rendering:
Obfuscated name using RTL Arabic characters
Let’s run Action, Auto-Rename All… on this file:
Auto-Renaming capabilities are provided (optionally) by plugins.After auto-renaming code items in the above file. Not clearer in terms of meaning, but at least, it’s something we can start working on.
As usual, feel free to join us on Slack, message us on Twitter, or email us privately at support@pnfsoftware.com.
Until next time!
–
Relying on metadata leads to false negatives in the best case – e.g., when the code has been minified by something like ProGuard; it leads to false positives in the worst case – e.g. forged metadata to incite the decompiler to generate inaccurate or wrong code. ↩
The Go programming language (also known as Golang) has gained popularity during the last few years among malware developers . This can certainly be explained by the relative simplicity of the language, and the cross-compilation ability of its compiler, allowing multi-platform malware development without too much effort.
In this blog post, we dive into Golang executables reverse engineering, and present a Python extension for JEB decompiler to ease Golang analysis; here is the table of content:
The JEB Python script presented in this blog can be found on our GitHub page. Make sure to update JEB to version 3.7+ before running it.
Disclaimer: the analysis in this blog post refers to the current Golang version (1.13) and part of it might become outdated with future releases.
Golang Basics for Reverse Engineers
Feel free to skip this part if you’re already familiar with Golang reverse engineering.
Let’s start with some facts that reverse engineers might find interesting to know before analyzing their first Golang executable.
1. Golang is an open-sourcelanguage with a pretty active development community. The language was originally created at Google around 2007, and version 1.0 was released in March 2012. Since then, two major versions are released each year.
2. Golang has a long lineage: in particular many low-level implementation choices — some would say oddities — in Golang can be traced back to Plan9, a distributed operating system on which some Golang creators were previously working.
3. Golang has been designed for concurrency, in particular by providing so-called “goroutines“, which are lightweight threads executing concurrently (but not necessarily in parallel).
Developers can start a new goroutine simply by prefixing a function call by go. A new goroutine will then start executing the function, while the caller goroutine returns and continues its execution concurrently with the callee. Let’s illustrate that with the following Golang program:
func myDummyFunc(){
	time.Sleep(1 * time.Second)
	fmt.Println("dummyFunc executed")
}

func main(){

	myDummyFunc() // normal call
	fmt.Println("1 - back in main")

	go myDummyFunc() // !! goroutine call
	fmt.Println("2 - back in main")

	time.Sleep(3 * time.Second)
}
Here, myDummyFunc() is called once normally, and then as a goroutine. Compiling and executing this program results in the following output:
dummyFunc executed
1 - back in main
2 - back in main
dummyFunc executed
Notice how the execution was back in main() before executing the second call to dummyFunc().
Implementation-wise, many goroutines can be executed on a single operating system thread. Golang runtime takes care of switching goroutines, e.g. whenever one executes a blocking system call. According to the official documentation “It is practical to create hundreds of thousands of goroutines in the same address space“.
What makes goroutines so “cheap” to create is that they start with a very limited stack space (2048 bytes — since Golang 1.4), which will be increased when needed.
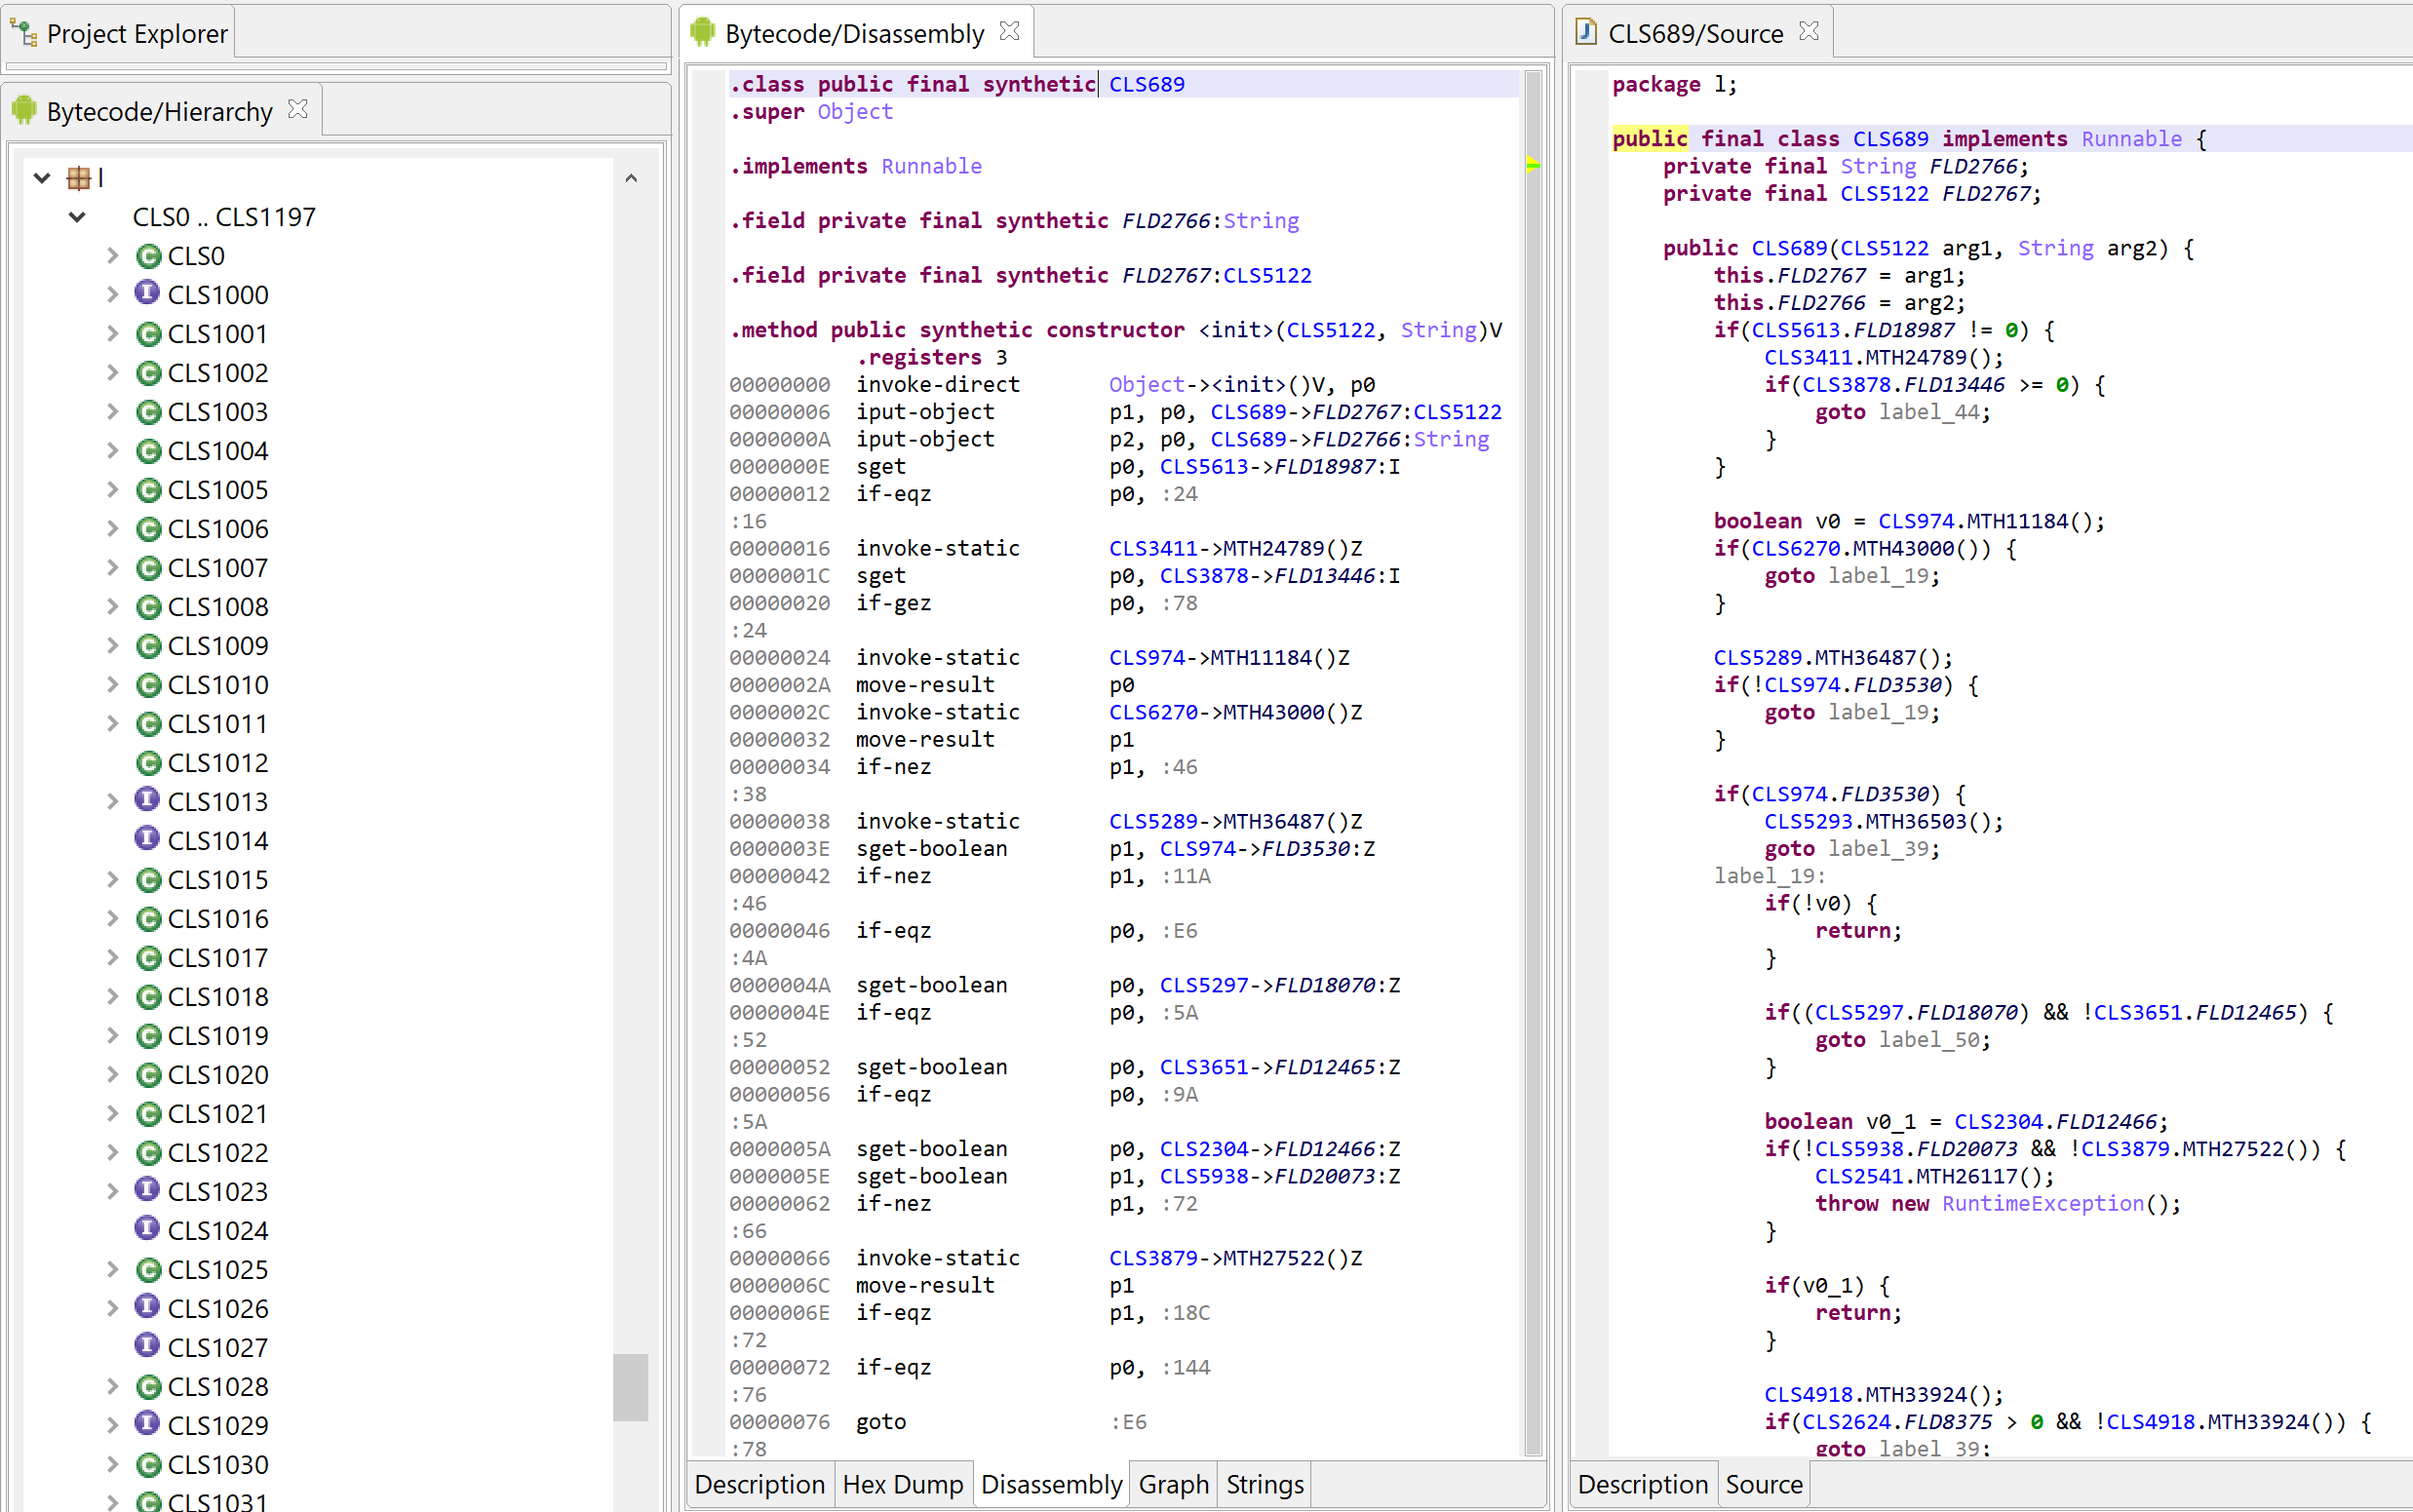
One of the noticeable consequence for reverse engineers is that native routines (almost) all start with the same prologue. Its purpose is to check if the current goroutine’s stack is large enough, as can be seen in the following CFG:
Fig. 1: Simplified x86 CFG with Golang prologue for stack growth
When the stack space is nearly exhausted, more space will be allocated — actually, the stack will be copied somewhere with enough free space. This particular prologue is present only in routines with local variables.
How to distinguish a goroutine call from a “normal” call when analyzing a binary? Goroutine calls are implemented by calling runtime.newproc, which takes in input the address of the native routine to call, the size of its arguments, and then the actual routine’s arguments.
4. Golang has a concurrent garbage collector(GC): Golang’s GC can free memory while other goroutines are modifying it.
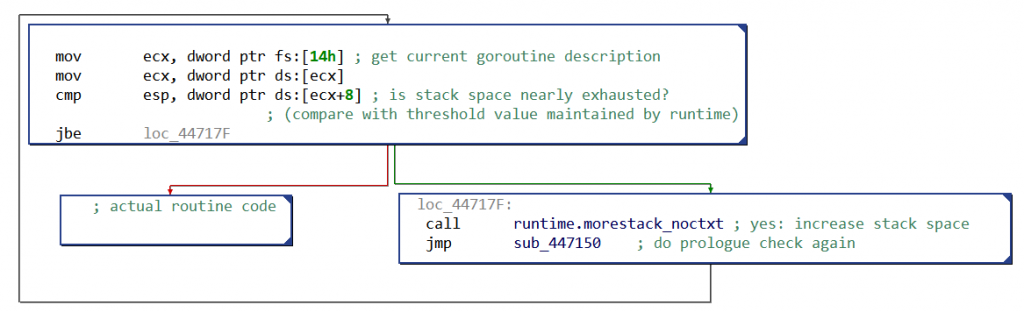
Roughly speaking, when the GC is freeing memory, goroutines report to it all their memory writes — to prevent concurrent memory modifications to be missed by the current freeing phase. Implementation-wise, when the GC is in the process of marking used memory, all memory writes pass through a “write barrier“, which performs the write and informs the GC.
For reverse engineers this can result in particularly convoluted control flow graphs (CFG). For example, here is the CFG when a global variable globalString is set to newValue:
Fig. 2: Write to global variable globalString (x86 CFG): before doing the memory write, the code checks if the write barrier is activated, and if yes calls runtime.gcWriteBarrier()
Not all memory writes are monitored in that manner; the rules for write barriers’ insertion are described in mbarrier.go.
5. Golang comes with a custom compiler tool chain (parser, compiler, assembler, linker), all implemented in Golang. 12
From a developer’s perspective, it means that once Go is installed on a machine, one can compiled for any supported platform (making Golang a language of choice for IoT malware developers). Examples of supported platforms include Windows x64, Linux ARM and Linux MIPS (see “valid combinations of $GOOS and $GOARCH“).
From a reverse engineer’s perspective, the custom Go compiler toolchain means Golang binaries sometimes come with “exotic” features (which therefore can give a hard time to reverse engineering tools).
For example, symbols in Golang Windows executables are implemented using the COFF symbol table (while officially “COFF debugging information [for executable] is deprecated“). The Golang COFF symbol implementation is pretty liberal: symbols’ type is set to a default value — i.e. there is no clear distinction between code and data.
Interestingly, Golang compiler internally uses pseudo assembly instructions (with architecture-specific registers). For example, here is a snippet of pseudo-code for ARM (operands are ordered with source first):
These pseudo-instructions could not be understood by a classic ARM assembler (e.g. there is no CALL instruction on ARM). Here are the disassembled ARM instructions from the corresponding binary:
Notice how the same pseudo-instruction MOVW got converted either as STRorMOV machine instructions. The use of pseudo-assembly comes from Plan9, and allows Golang assembler parser to easily handle all architectures: the only architecture-specific step is the selection of machine instructions (more details here).
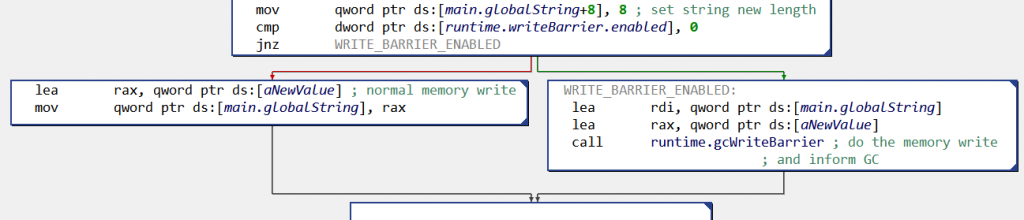
6. Golang uses by default a stack-only calling convention.
Let’s illustrate that with the following diagram, showing the stack’s state when a routine with two integer parameters a and b, and two return values — declared in Go as “func myRoutine(a int, b int) (int, int)” — is called:
Fig. 3: Simplified stack view (stack grows downward), when a routine with two parameters and two return values is called . The return values are reserved slots for the callee.
It is the caller’s responsibilities to reserve space for the callees’ parameters and returned values, and to free it later on.
Note that Golang’s calling convention situation might soon change: since version 1.12, several calling conventions can coexist — the stack-only calling convention remaining the default one for backward compatibility reasons.
7. Golang executables are usually statically-linked, i.e. do not rely on external dependencies3. In particular they embed a pretty large runtime environment. Consequently, Golang binaries tend to be large: for example, a “hello world” program compiled with Golang 1.13 is around 1.5MB with its symbols stripped.
8. Golang executables embed lots of symbolic information:
Debug symbols, implemented as DWARF symbols. These can be stripped at compilation time (command-line option -ldflags "-w") .
Classic symbols for each executable file format (PE/ELF/Mach-O). These can be stripped at compilation time (command-line option -ldflags "-s").
Go-specific metadata, including for example all functions’ entry points and names, and complete type information. These metadata cannot (easily) be stripped, because Golang runtime needs them: for example, functions’ information are needed to walk the stack for errors handling or for garbage collection, while types information serve for runtime type checks.
Of course, Go-specific metadata are very good news for reverse engineers, and parsing these will be one of the purpose of the JEB’s Python extension described in this blog post.
Making JEB Great for Golang
Current Status
What happens when opening a Golang executable in JEB? Let’s start from the usual “hello world” example:
package main

import "fmt"

func main() {
	fmt.Printf("hello, world\n")
}
If we compile it for as a Windows x64 PE file, and open it in JEB, we can notice that its code has only been partially disassembled. Unexplored memory areas can indeed be seen next to code areas in the native navigation bar (right-side of the screen by default):
Fig.4: Navigation bar for Golang PE file (blue is code, green is data, grey represents area without any code or data)
We can confirm that the grey areas surrounding the blue areas are code, by manually disassembling them (hotkey ‘C’ by default).
Why did JEB disassembler miss this code? As can be seen in the Notifications window, the disassembler used a CONSERVATIVE strategy, meaning that it only followed safe control flow relationships (i.e. branches with known targets) 4.
Because Go runtime calls most native routines indirectly, in particular when creating goroutines, JEB disassembler finds little reliable control flow relationships, explaining why some code areas remain unexplored.
Before going on, let’s take a look at the corresponding Linux executable, which we can obtain simply by setting environment variable $GOOS to linux before compiling. Opening the resulting ELF file in JEB brings us in a more positive situation:
Fig. 5: Navigation bar for Golang ELF file (blue is code, green is data, grey represents area without any code or data)
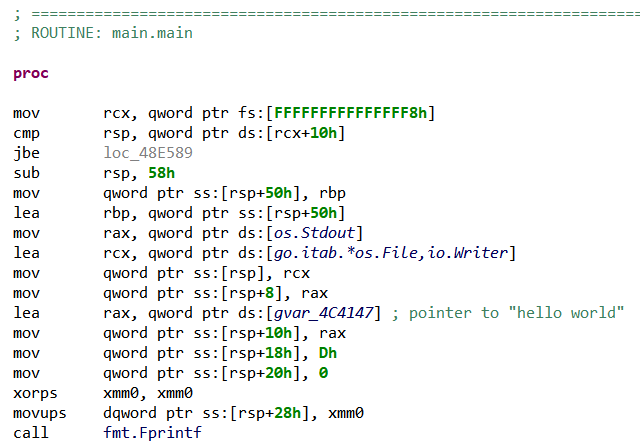
Due to the use by default of AGGRESSIVE strategy for disassembling ELF files, JEB disassembler found the whole code area (all code sections were linearly disassembled). In particular this time we can see our main routine, dubbed main.main by the compiler:
Fig. 6: Extract of main.main routine’s disassembly
Are data mixed with code in Golang executables? If yes, that would make AGGRESSIVE disassembly a risky strategy. At this moment (version 1.13 with default Go compiler), this does not seem to be the case:
– Data are explicitly stored in different sections than code, on PE and ELF.
– Switch statements are not implemented with jumptables — a common case of data mixed with code, e.g. in Visual Studio or GCC ARM. Note that Golang provides several switch-like statements, as the select statement or the type switch statement.
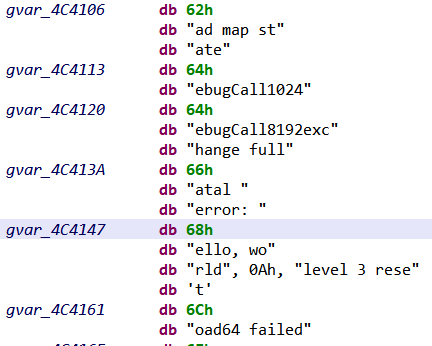
Yet, there is still something problematic in our ELF disassembly: the “hello world” string was not properly defined. Following the reference made by LEA instruction in the code, we reach a memory area where many strings have indeed been misrepresented as 1-byte data items:
Fig. 7: Dump of the memory area containing strings. Only the first byte of the strings is defined.
Now that we have a better idea of JEB’s current status, we are going to explain how we extended it with a Python script to ease Golang analysis.
Finding and Naming Routines
The first problem on our road is the incomplete control flow, specially on Windows executables. At first, it might seem that PE files disassembly could be improved simply by setting disassembler’s strategy to AGGRESSIVE, exactly as for ELF files. While it might be an acceptable quick solution, we can actually improve the control flow in a much safer way by parsing Go metadata.
Parsing “Pc Line Table”
Since version 1.2, Golang executables embed a structure called “pc line table”, also known as pclntab. Once again, this structure (and its name) is an heritage from Plan9, where its original purpose was to associate a program counter value (“pc”) to another value (e.g. a line number in the source code).
The structure has evolved, and now contains a function symbol table, which stores in particular the entry points and names of all routines defined in the binary. The Golang runtime uses it in particular for stack unwinding, call stack printing and garbage collection.
In others words, pclntab cannot be easily stripped from a binary, and provide us a reliable way to improve our disassembler’s control flow!
First, our script locates pclntab structure (refer to locatePclntab() for the details):
  # non-stripped binary: use symbol
  if findSymbolByName(golangAnalyzer.codeContainerUnit, 'runtime.pclntab') != None:
      pclntabAddress = findSymbolByName(..., 'runtime.pclntab')

  # stripped binary
  else:
    # PE: brute force search in .rdata. or in all binary if section not present
    if [...].getFormatType() == WellKnownUnitTypes.typeWinPe
    [...]

    # ELF: .gopclntab section if present, otherwise brute force search
    elif [...].getFormatType() == WellKnownUnitTypes.typeLinuxElf:
    [...]
On stripped binaries (i.e. without classic symbols), we search memory for the magic constant 0xFFFFFFFB starting pclntab, and then runs some checks on the possible fields. Note that it is usually easier to parse Golang ELF files, as important runtime structures are stored in distinct sections.
Second, we parse pclntab and use its function symbol table to disassemble all functions and rename them:
[...]
# enqueue function entry points from pclntab and register their names as labels
for myFunc in pclntab.functionSymbolTable.values():
 nativeCodeAnalyzer.enqueuePointerForAnalysis(EntryPointDescription(myFunc.startPC), INativeCodeAnalyzer.PERMISSION_FORCEFUL)
 if rename:
   labelManager.setLabel(myFunc.startPC, myFunc.name, True, True, False)

# re-run disassembler with the enqueued entry points
self.nativeCodeAnalyzer.analyze()
Running this on our original PE file allows to discover all routines, and gives the following navigation bar:
Fig. 8: Navigation bar for Golang PE file after running the script (blue is code, green is data, grey represents area without any code or data)
Interestingly, a few Golang’s runtime routines provide hints about the machine used to compile the binary, for example:
– runtime.schedinit(): references Go’s build version. Knowing the exact version allows to investigate possible script parsing failures (as some internal structures might change depending on Go’s version).
– runtime.GOROOT(): references Go’s installation folder used during compilation. This might be useful for malware tracking.
These routines are present only if the rest of the code relies on them. If it is the case, FunctionsFinder module highlights them in JEB’s console, and the user can then examine them.
The Remaining Unnamed Routines
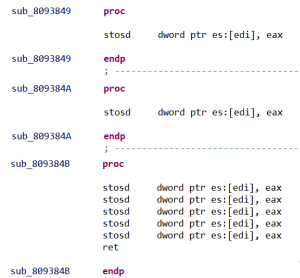
Plot twist! A few routines found by the disassembler remain nameless even after FunctionsFinder module parsed pclntab structure. All these routines are adjacent in memory and composed of the same instructions, for example:
Fig. 9: Series of unnamed routines in x86
Long story short, these routines are made for zeroing or copying memory blobs, and are part of two large routines respectively named duff_zero and duff_copy.
These large routines are Duff’s devices made for zeroing/copying memory. They are generated as long unrolled loops of machine instructions. Depending on how many bytes need to be copied/zeroed the compiler will call directly on a particular instruction. For each of these calls, a nameless routine will then be created by the disassembler.
DuffDevicesFinder module identifies such routines with pattern matching on assembly instructions. By counting the number of instructions, it then renames them duff_zero_N/duff_copy_N, with N the number of bytes zeroed/copied.
Source Files
Interestingly, pclntab structure also stores original source files‘ paths. This supports various Golang’s runtime features, like printing meaningful stack traces, or providing information on callers from a callee (see runtime.Caller()). Here is an example of a stack trace obtained after a panic():
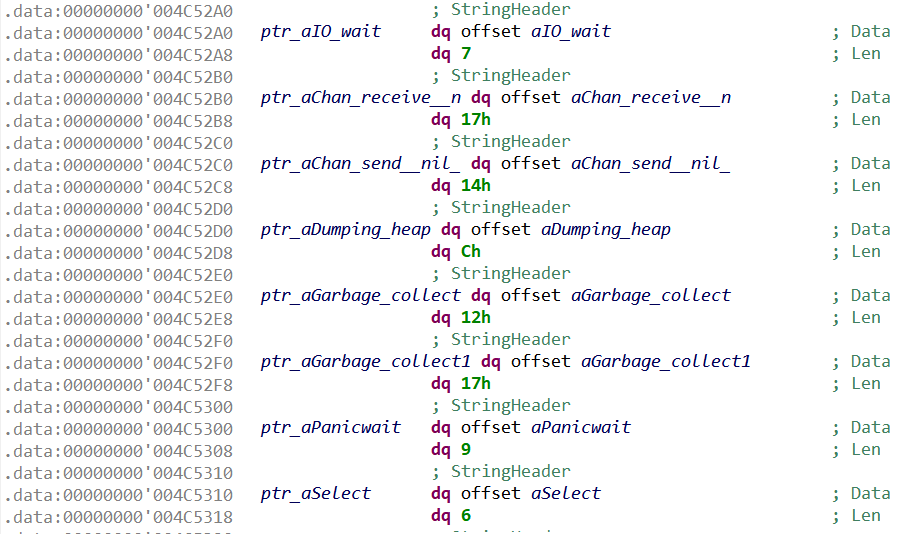
The second problem we initially encountered in JEB was the badly defined strings.
What Is a String?
Golang’s strings are stored at runtime in a particular structure called StringHeader with two fields:
type StringHeader struct {
        Data uintptr       // string value
        Len  int           // string size
}
The string’s characters (pointed by the Data field) are stored in data sections of the executables, as a series of UTF-8 encoded characters without null-terminators.
Dynamic Allocation
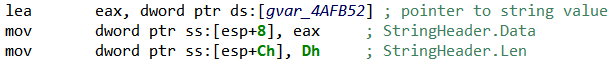
StringHeader structures can be built dynamically, in particular when the string is local to a routine. For example:
Fig. 10: StringHeader instantiation in x86
By default JEB disassembler defines a 1-byte data item (gvar_4AFB52 in previous picture) for the string value, rather than a proper string, because:
As the string value is referenced only by LEA instruction, without any hints on the data type (LEA is just loading an “address”), the disassembler cannot type the pointed data accordingly.
The string value does not end with a null-terminator, making JEB’s standard strings identification algorithms unable to determine the string’s length when scanning memory.
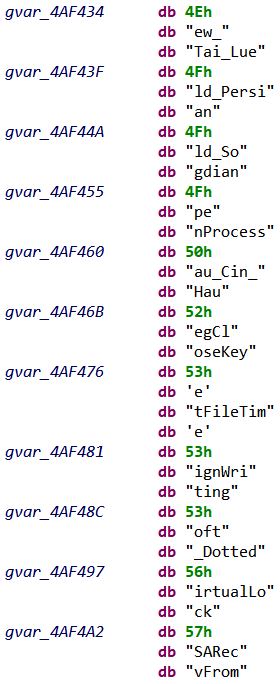
To find these strings, StringsBuilder module searches for the particular assembly instructions usually used for instantiating StringHeader structures (for x86/x64, ARM and MIPS architectures). We can then properly define a string by fetching its size from the assembly instructions. Here is an example of recovered strings:
Before strings recovery
After strings recovery
Of course, this heuristic will fail if different assembly instructions are employed to instantiate StringHeader structures in future Golang compiler release (such change happened in the past, e.g. x86 instructions changed with Golang 1.8).
Static Allocation
StringHeader can also be statically allocated, for example for global variables; in this case the complete structure is stored in the executable. The code referencing such strings employs many different instructions, making pattern matching not suitable.
The script employs twoadditional final heuristics, which scan memory for printable strings located between two already-defined strings. This allows to recover strings missed by previous heuristics.
When a small local string is used for comparison only, no StringHeader structure gets allocated. The string comparison is done directly by machine instructions; for example, CMP [EAX], 0x64636261 to compare with “abcd” on x86.
Types Recovery
Now that we extended JEB to handle the “basics” of Golang analysis, we can turn ourselves to what makes Golang-specific metadata particularly interesting: types.
Golang executables indeed embed descriptions for all typesmanipulated in the binary, including in particular those defined by developers.
To illustrate that, let’s compile the following Go program, which defines a Struct (Golang’s replacement for classes) with two fields:
package main

type DummyStruct struct{
	boolField bool
	intField int
}

func dummyFunc(s DummyStruct) int{
	return 13 * s.intField
}

func main(){
	s := DummyStruct{boolField: true, intField:37}
	t := dummyFunc(s)
	t += 1
}
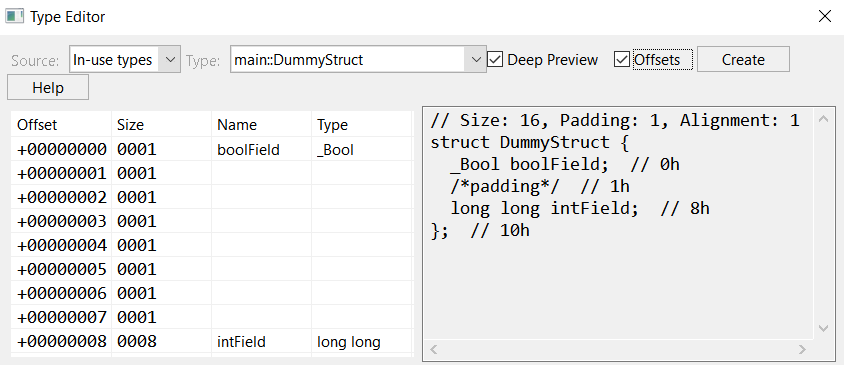
Now, if we compile this source code as a stripped x64 executable, and analyze it with TypesBuilder module, the following structure will be reconstructed:
Fig. 14: Structure reconstructed by TypesBuilder, as seen in JEB’s type editor
Not only did we get the structure and its fields’ original names, but we also retrieved the structure’s exact memory layout, including the padding inserted by the compiler to align fields. We can confirm DummyStruct‘s layout by looking at its initialization code in main():
Fig. 15: DummyStruct initialization: intField starts at offset 8, as extracted from type information
Why So Much Information?
Before explaining how TypesBuilder parses types information, let’s first understand why these information are needed at all. Here are a few Golang features that rely on types at runtime:
Dynamic memory allocation, usually through a call to runtime.newobject(), which takes in input the description of the type to be allocated
Dynamic type checking, with statements like type assertions or type switches. Roughly speaking, two types will be considered equals if they have the same type descriptions.
Reflection, through the built-in package reflect, which allows to manipulate objects of unknown types from their type descriptions
Golang type descriptions can be considered akin to C++ Run-Time Type Information, except that there is no easy way to prevent their generation by the compiler. In particular, even when not using reflection, types descriptors remain present.
For reverse engineers, this is another very good news: knowing types (and their names) will help understanding the code’s purpose.
Of course, it is certainly doable to obfuscate types, for example by giving them meaningless names at compilation. We did not find any malware using such technique.
What Is A Type?
In Golang each type has an associated Kind, which can take one the following values:
Struct: collection of fields, Golang’s replacement for classes
Interface: collection of methods, implemented by Structs
The type’s kind is the type’s “category”; what identifies the type is its complete description, which is stored in the following rtype structure:
    type rtype struct {
      size       uintptr
      ptrdata    uintptr  // number of bytes in the type that can contain pointers
      hash       uint32   // hash of type; avoids computation in hash tables
      tflag      tflag    // extra type information flags
      align      uint8    // alignment of variable with this type
      fieldAlign uint8    // alignment of struct field with this type
      kind       uint8    // enumeration for C
      alg        *typeAlg // algorithm table
      gcdata     *byte    // garbage collection data
      str        nameOff  // string form
      ptrToThis  typeOff  // type for pointer to this type, may be zero
    }
The type’s name is part of its description (str field). This means that, for example, one could define an alternate integer type with type myInt int, and myInt and int would then be distinct types (with distincttype descriptors, each of Int kind). In particular, assigning a variable of type myInt to a variable of type int would necessitate an explicit cast.
The rtype structure only contains general information, and for non-primary types (Struct, Array, Map,…) it is actually embedded into another structure (as the first field), whose remaining fields provides type-specific information.
For example, here is strucType, the type descriptor for types with Struct kind:
    type structType struct {
      rtype
      pkgPath name
      fields  []structField
    }
Here, we have in particular a slice of structField, another structure describing the structure fields’ types and layout.
Finally, types can have methods defined on them: a method is a function with a special argument, called the receiver, which describes the type on which the methods applies. For example, here is a method on MyStruct structure (notice receiver’s name after func):
func (myStruct MyStruct) method1() int{
    ...
}
Where are methods’ types stored? Into yet another structure called uncommonType, which is appended to the receiver’s type descriptor. In other words, a structure with methods will be described by the following structure:
type UncommonStructType struct {
      rtype
      structType
      uncommonType
}
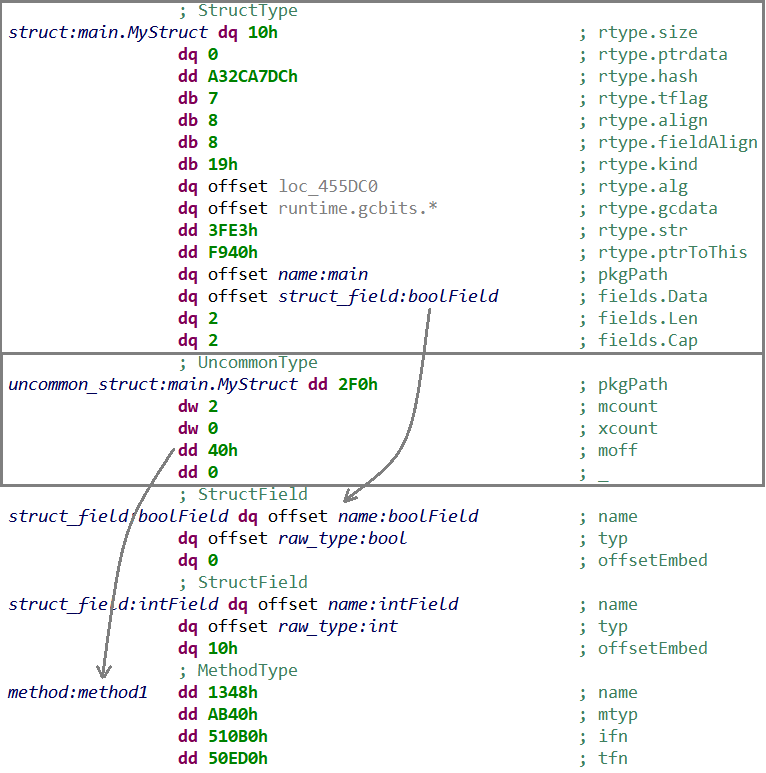
Here is an example of such structure, as seen in JEB after running TypesBuilder module:
Fig. 16: Type descriptor for a structure with methods: StrucType (with embedded rtype, and referencing StructField), followed by UncommonType (referencing MethodType)
Parsing type descriptors can therefore be done by starting from rtype (present for all types), and adding wrapper structures around it, if needed. Properly renaming type descriptors in memory greatly helps the analysis, as these descriptors are passed as arguments to many runtime routines (as we will see in StealthWorker’s malware analysis).
The final step is to transform the type descriptors into the actual types — for example, translating a structType into the memory representation of the corresponding structure –, which can then be imported in JEB types. For now, TypesBuilder do this final import step for named structures only.
Describing in details all Golang’s type descriptors is out-of-scope for this blog. Refer to TypesBuilder module for gory details.
Locating Type Descriptors
The last question we have to examine is how to actually locate type descriptors in Golang binaries. This starts with a structure called moduledata, whose purpose is to “record information about the layout of the executable“:
This structure defines in particular a range of memory dedicated to storing type information (from types to etypes). Then, typelink field stores offsets in the range where type descriptors begin.
So first we locate moduledata, either from a specific symbol for non-stripped binaries, or through a brute-force search. For that, we search for the address of pclntab previously found (first moduledata field), and then apply some checks on its fields.
There is no backward compatibility requirement on runtime’s internal structures — as Golang executables embed their own runtime. In particular, moduledata and type descriptions are not guaranteed to stay backward compatible with older Golang release (and they were already largely modified since their inception).
In others words, TypesBuilder module’s current implementation might become outdated in future Golang releases (and might not properly work on older versions).
Use-Case: StealthWorker
We are now going to dig into a malware dubbed StealthWorker. This malware infects Linux/Windows machines, and mainly attempts to brute-force web platforms, such as WordPress, phpMyAdmin or Joomla. Interestingly, StealthWorker heavily relies on concurrency, making it a target of choice for a first analysis.
The sample we will be analyzing is a x86 Linux version of StealthWorker, version 3.02, whose symbols have been stripped (SHA1: 42ec52678aeac0ddf583ca36277c0cf8ee1fc680)
Reconnaissance
Here is JEB’s console after disassembling the sample and running the script with all modules activated (FunctionsFinder, StringsBuilder, TypesBuilder, DuffDevicesFinder, PointerAnalyzer):
>>> Golang Analyzer <<<
> pclntab parsed (0x84B79C0)
> first module data parsed (0x870EB20)
> FunctionsFinder: 9528 function entry points enqueued (and renamed)
> FunctionsFinder: running disassembler... OK
 > point of interest: routine runtime.GOROOT (0x804e8b0): references Go root path of developer's machine (sys.DefaultGoroot)
 > point of interest: routine runtime.schedinit (0x8070e40): references Go version (sys.TheVersion)
> StringsBuilder: building strings... OK (4939 built strings)
> TypesBuilder: reconstructing types... OK (5128 parsed types - 812 types imported to JEB - see logs)
> DuffDevicesFinder: finding memory zero/copy routines... OK (93 routines identified)
> PointerAnalyzer: 5588 pointers renamed
> see logs (C:\[REDACTED]\log.txt)
Let’s start with some reconnaissance work:
The binary was compiled with Go version 1.11.4 (referenced in runtime.schedinit‘s code, as mentioned by the script’s output)
Go’s root path on developer’s machine is /usr/local/go (referenced by runtime.GOROOT‘s code)
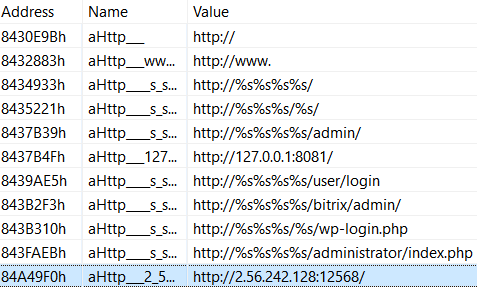
Now, let’s turn to the reconstructed strings; there are too many to draw useful conclusions at this point, but at least we got an interesting IP address (spoiler alert: that’s the C&C’s address):
Fig. 17: Extract of StealthWorker’s strings as seen in JEB after running the script
More interestingly, the list of source files extracted from pclntab (outputted in the script’s log.txt) shows a modular architecture:
Each main.go corresponds to a Go package, and its quite obvious from the paths that each of them targets a specific web platform. Moreover, there seems to be mainly two types of packages: WorkerTARGET_brut, and WorkerTARGET_check.
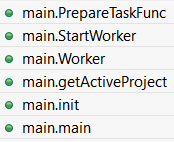
Let’s dig a bit further by looking at main package, which is where execution begins; here are its routines with pretty informative names:
Fig. 18: main’s package routines
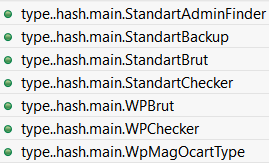
Additionally there is a series of type..hash* and type..eq* methods for main package:
Fig. 19: Hashing methods (automatically generated for complex types)
These methods are automatically generated for types equality and hashing, and therefore their presence indicates that non-trivial custom types are used in main package (as we will see below).
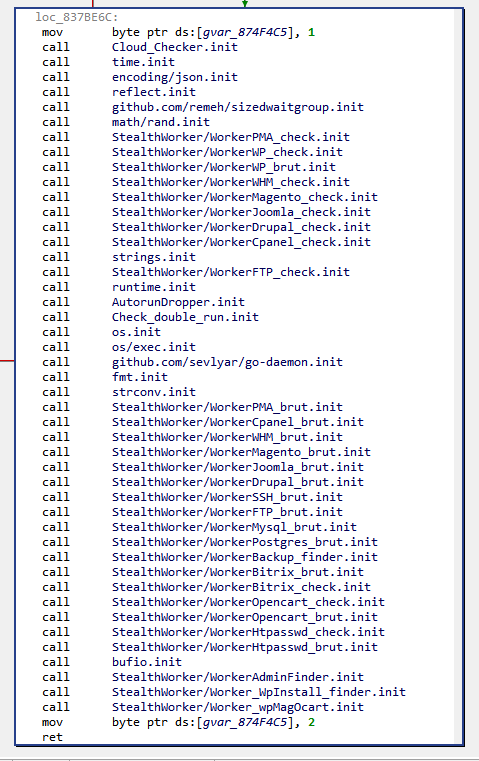
We can also examine main.init() routine. The init() routine is generated for each package by Golang’s compiler to initialize others packages that this package relies on, and the package’s global variables:
Fig. 20: Packages initialization from main.init()
Along the previously seen packages, one can notice some interesting custom packages:
github.com/remeh/sizedwaitgroup: a re-implementation of Golang’s WaitGroup — a mechanism to wait for goroutines termination –, but with a limit in the amount of goroutines started concurrently. As we will see, StealthWorker’s developer takes special care to not overload the infected machine.
Golang packages’ paths are part of a global namespace, and it is considered best practice to use GitHub’s URLs as package paths for external packages to avoid conflicts.
Concurrent Design
In this blog, we will not dig into each StealthWorker’s packages implementation, as it has been already been done severaltimes. Rather, we will focus on the concurrent design made to organize the work between these packages.
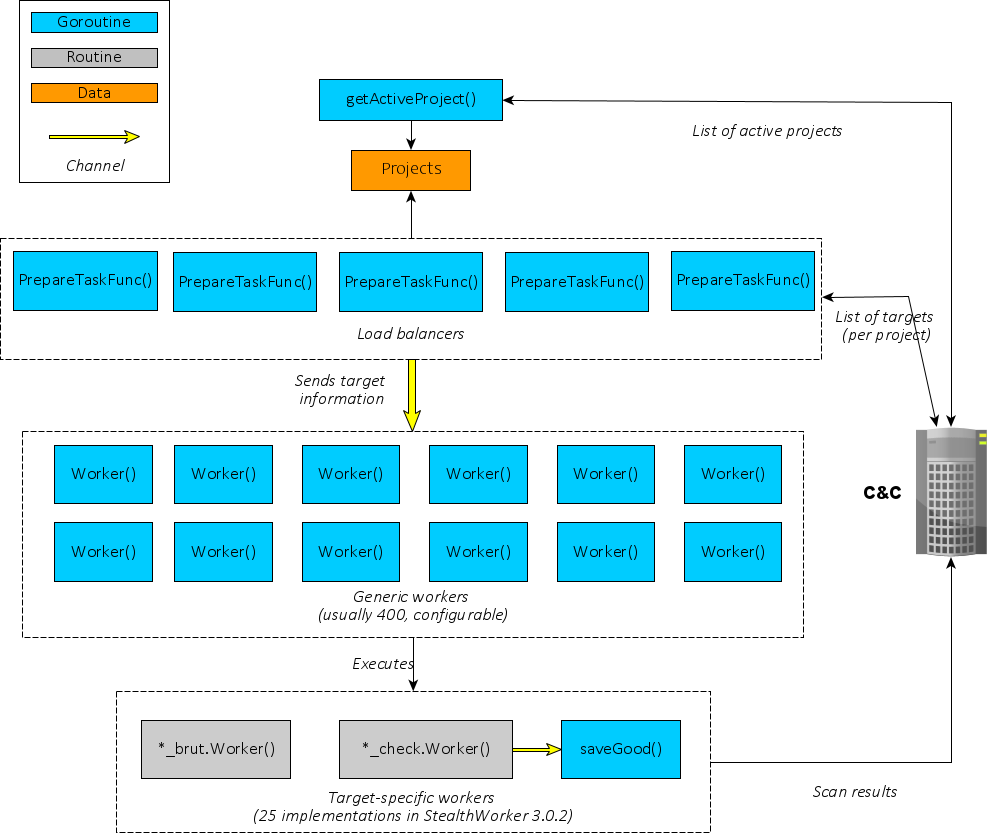
Let’s start with an overview of StealthWorker’s architecture:
Fig. 21: StealthWorker’s design overview
At first, a goroutine executing getActiveProject() regularly retrieves a list of “projects” from the C&C server. Each project is identified by a keyword (wpChk for WordPress checker, ssh_b for SSH brute-forcer, etc).
From there, the real concurrent work begins: five goroutines executing PrepareTaskFunc() retrieve a list of targets for each project, and then distribute work to “Workers”. There are several interesting quirks here:
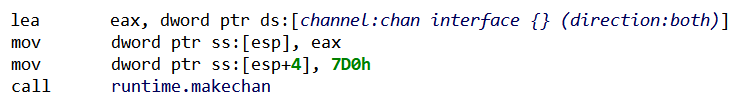
To allow PrepareTaskFunc() goroutines to communicate with Worker() goroutines, a Channel is instantiated:
Fig. 22: Channel’s instantiation
As can be seen from the channel type descriptor — parsed and renamed by the script –, the Channel is made for objects of type interface {}, the empty interface. In others words, objects of any type can be sent and received through it (because “direction:both”).
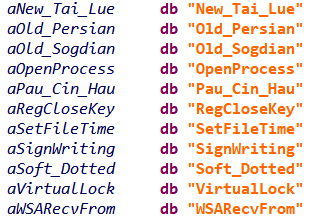
PrepareTaskFunc() will then receive from the C&C server a list of targets for a given project — as JSON objects –, and for each target will instantiate a specific structure. We already noticed these structures when looking at main package’s routines, here are their reconstructed form in the script’s logs:
Note that all structures have Worker and Host fields. The structure (one per target) will then be sent through the channel.
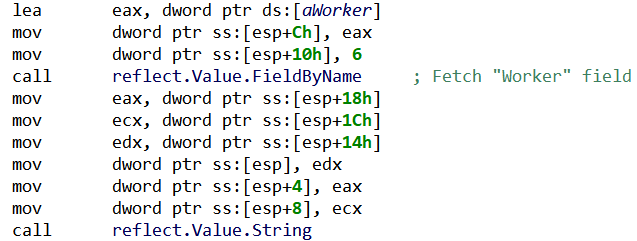
On the other side of the channel, a Worker() goroutine will fetch the structure, and use reflection to generically process it (i.e. without knowing a priori which structure was sent):
Fig. 23: StealthWorker’s use of reflection to retrieve a field from an unknown structure
Finally, depending on the value in Worker field, the corresponding worker’s code will be executed. There are two types of workers: brute-forcing workers, which try to login into the target through a known web platform, and checking workers, which test the existence of a certain web platform on the target.
From a design point-of-view, there is a difference between the two types of workers: checking workers internally relies on another Channel, in which the results are going to be written, and fetched by another goroutine named saveGood(), which reports to the C&C. On the other hand, brute-forcing workers do their task and directly report to the C&C server.
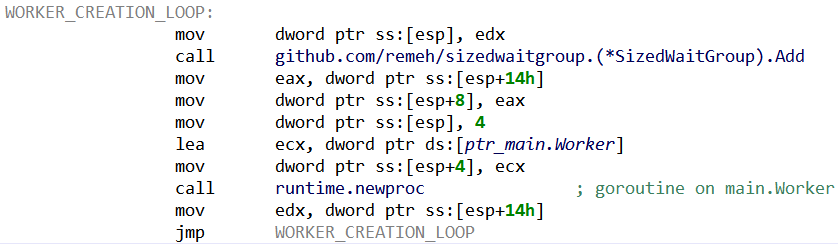
Interestingly, the maximum number of Worker() goroutines can be configured by giving a parameter to the executable (preceded by the argument dev). According to the update mechanism, it seems that the usual value for this maximum is 400. Then, the previously mentioned SizedWaitGroup package serves to ensure the number of goroutines stay below this value:
Fig. 24: Worker’s creation loop SizeWaitGroup.Add() is blocking when the maximum number of goroutines has been reached. Each main.Worker() will release its slot when terminating.
We can imagine that the maximum amount of workers is tuned by StealthWorker’s operators to lower the risk of overloading infected machines (and drawing attention).
There are two additional goroutines, respectively executing routines KnockKnock() and CheckUpdate(). Both of them simply run specific tasks concurrently (and infinitely): the former sends a “ping” message to the C&C server, while the latter asks for an updated binary to execute.
What’s Next? Decompilation!
The provided Python script should allow users to properly analyze Linux and Windows Golang executables with JEB. It should also be a good example of what can be done with JEB API to handle “exotic” native platforms.
Regarding Golang reverse engineering, for now we remained at disassembler level, but decompiling Golang native code to clean pseudo-C is clearly a reachable goal for JEB. There are a few important steps to implement first, like properly handling Golang stack-only calling convention (with multiple return values), or generating type libraries for Golang runtime.
So… stay tuned for more Golang reverse engineering!
As usual, if you have questions, comments or suggestions, feel free to:
The Golang compiler was originally inherited from Plan9 and was written in C, in order to solve the bootstrapping problem (how to compile a new language?), and also to “easily” implement segmented stacks — the original way of dealing with goroutines stack. The process of translating the original C compiler to Golang for release 1.5 has been described in details here and here. ↩
There are alternate compilers, e.g. gccgo and a gollvm↩
Golang also allows to compile ‘modules’, which can be loaded dynamically. Nevertheless, for malware writers statically-linked executables remain the usual choice. ↩
Readers interested in the internals of JEB disassembler engine should refer to our recent REcon presentation↩
In part 1 of this series, we gave an overview of the Intermediate Representation used by JEB’s Native Analysis Pipeline, as well as a simple Python script demonstrating how to use the API to access and print out IR-CFG of decompiled routines.
In part 2, we continue our exploration of JEB IR. We will show how to write a custom IR optimizer plugin to clean-up a custom obfuscation used in a piece of code. The resulting decompiled C code will end up very readable as well.
Before you proceed, make sure to update JEB Pro to version 3.1.1+.
Obfuscated Crypto-stealer Code
The sample we are going to look at monitors Windows clipboards for cryptocurrency-looking wallet addresses, and replaces them with a desired target address. The sample is specifically targeting Ethereum wallet addresses. It is a neutered final stage payload – the recipient address has been scrambled to render the code ineffective.
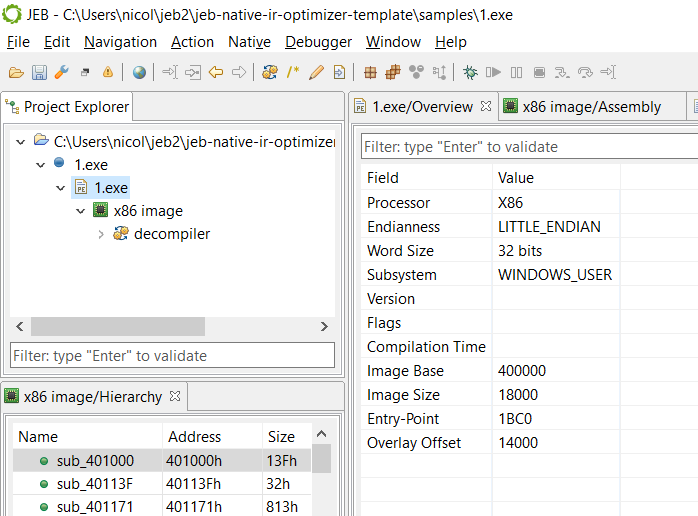
PE characteristics of file 1.exe
Although the payload is unpacked, what is interesting is that one of its key routines is obfuscated: custom garbage code was inserted.
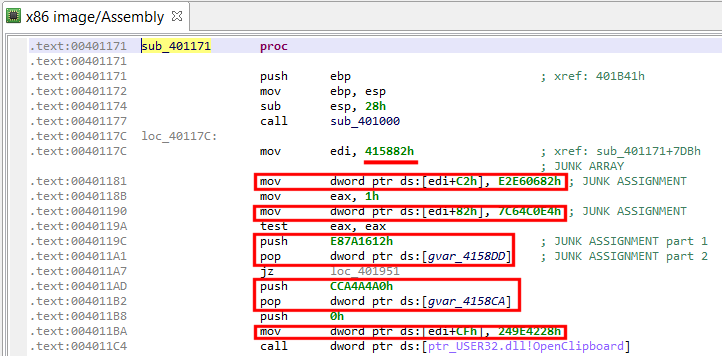
Junk (useless) assignments
The garbage code is easy to go through: a bit of manual analysis shows that junk instructions are assigning pseudo-random values to an array whose bytes are never used. Two types of assembly patterns are present:
1- mov dword ptr [edi + offset], junk_value ; edi previously init. to
                                            ; junkarray address
2- push junk_value
   pop dword ptr [junkarray_address + offset]
If we decompile that code and look at the final IR (as shown below), we can see that those instructions ended up being converted and optimized to the following type of assignment:
Assign(Mem(mem_address), Imm(junk_value))
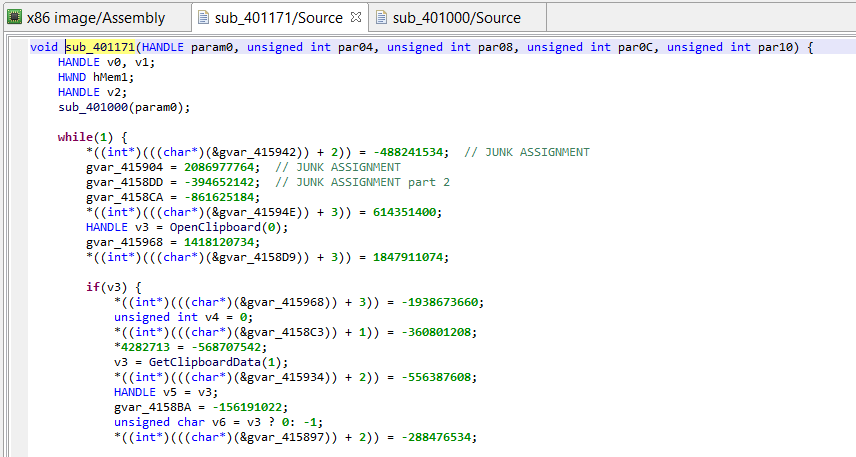
Currently, the decompiled code looks like the following, hard-to-digest blob:
Snippet of decompiled code (obfuscated)
Although quite painful to read, we can follow the program’s logic by abstracting away the junk assignments. (Essentially, win32 functions’ OpenClipboard, GetClipboardData, and SetClipboardData are used to retrieve, check, and replace copy-pasted Ascii and Unicode text, if they match the following pattern “/0x(..){20}/”. The replacement string target wallet address, previously decrypted by sub_401000.)
Cleaning the Intermediate Representation
Recall that the native analysis pipeline can be simplifed as the workflow below:
CodeObject (*) -> Reconstructed Routines & Data -> Conversion to IR (low-level, non-optimized) -> IR Optimizations<--- this is where we'll work -> Final IR (higher-level, optimized, typed) -> Generation of AST -> AST Optimizations -> Final AST (final, cleaned) -> High-level output (eg, C variant)
Our custom IR optimizer will look for junk assignments and remove them. The important criteria are: What is the junk array start and end addresses? Is it common to all routines in the binary, or is there one array per routine? Those questions may be hard to answer in the general case. However, for our specific sample file, we can assert with a high-degree of certainty that the junk array: – starts at address 0x415882 – is at most 256 bytes long – is used solely by sub_401171, the routine we want to analyze
Because of the above restrictions, the IR optimizer we are going to write should be qualified as a custom or ad-hoc IR optimizer. Chances are, we won’t be able to reuse it as-is in other programs without some amount of tweaking.
Let’s get started, we will: – create an Eclipse project with scaffold code for a Java back-end plugin – write and test a custom IR optimizer with a headless client – deploy the plugin and make it usable and accessible from the UI desktop client
Creating a Plugin Project
Before we proceed, make sure to:
Define an environment variable JEB_HOME, that points to your JEB installation folder
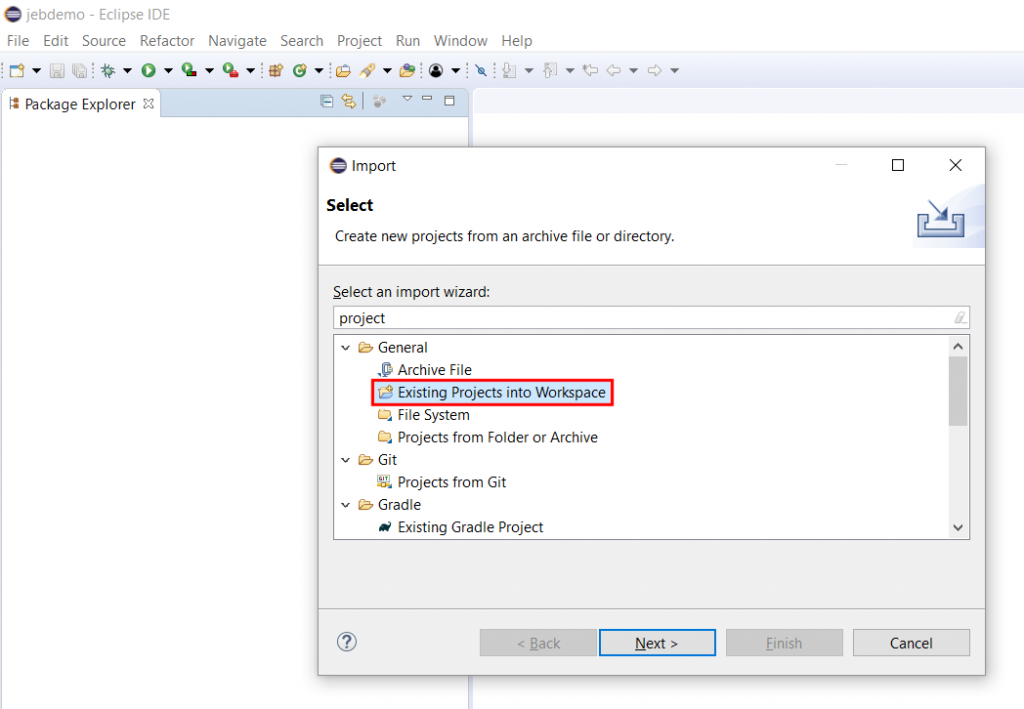
Open Eclipse and import the newly-created project into your Workspace (File, Import, Existing Projects into the Workspace, select the cloned repository folder, proceed)
Importing an existing project into Eclipse
Debugging the Obfuscation
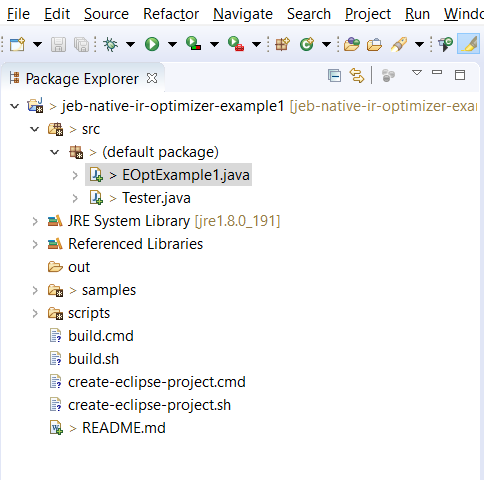
Now that your project is imported in Eclipse, you should be able to see two source files in src’s default package:
Tester.java
EOptExample1.java
EOptExample1 is the IR optimizer plugin we will be working on. (Note that several classes of plugins exist, this one is a native IR optimizer, and therefore inherits from AbstractEOptimizer or one its subclasses.)
Tester creates a headless JEB instance that loads the plugin EOptExample1.
Package Explorer view of the newly-created project
Then, create a JEB project and load the artifact file samples/1.exe (IMPORTANT: unzip 1.zip to 1.exe first – password: password)
Analyze the artifact
Retrieve a handle on the native decompiler
Retrieve a handle on the to-be-analyzed routine sub_401171
Perform a full decompilation of that routine
Let’s have a preliminary look at EOptExample1: This IR optimizer type is set to STANDARD, which is not ideal when you use custom optimizers tailored for specific code. A better IR optimizer class for those is ON_DEMAND: those optimizers are to be manually invoked, e.g. from JEB UI (menu: File, Advanced Unit Options). However, during development, since we are focusing on a particular file and routine, STANDARD type may be fine. Standard optimizers are called during regular IR optimization phases of the decompilation pipeline.
public class EOptExample1 extends AbstractEOptimizer {

    public EOptExample1() {
        super(DataChainsUpdatePolicy.UPDATE_IF_OPTIMIZED);
        getPluginInformation().setName("Sample IR Optimizer #1");
        getPluginInformation().setDescription("Remove IR-statements reduced to \"*(&garbage + delta) = xxx\"");
        getPluginInformation().setVersion(Version.create(1, 0, 0));
        // Standard optimizers are normally run, as part of the IR optimization stages in the decompilation pipeline
        setType(OptimizerType.STANDARD);
    }

    // replace all IR statements previously reduced to EMem ("[junk_address] = xxx") to ENop
    @Override
    public int perform(boolean updateDFA) {
        logger.info("IR-CFG before running custom optimizer \"%s\":\n%s", getName(),
                DecompilerUtil.formatIRCFGWithContext(2, cfg, ectx));
        // ...
        // optimizer code
    }
}
Note the plugin’s data-chains update policy, set to UPDATE_IF_OPTIMIZED. Optimizations that specify this flag tell their runner, aka the master optimizer that orchestrate them, that identifiers may be modified – hence, if optimizations occurred, a data flow analysis (DFA) pass needs to take place again. DFA update policies are a topic for another article.
Lines 3-5 are plugin metadata information, such as name and description, authorship, version numbers (including minimum/maximum JEB back-end versions), etc.
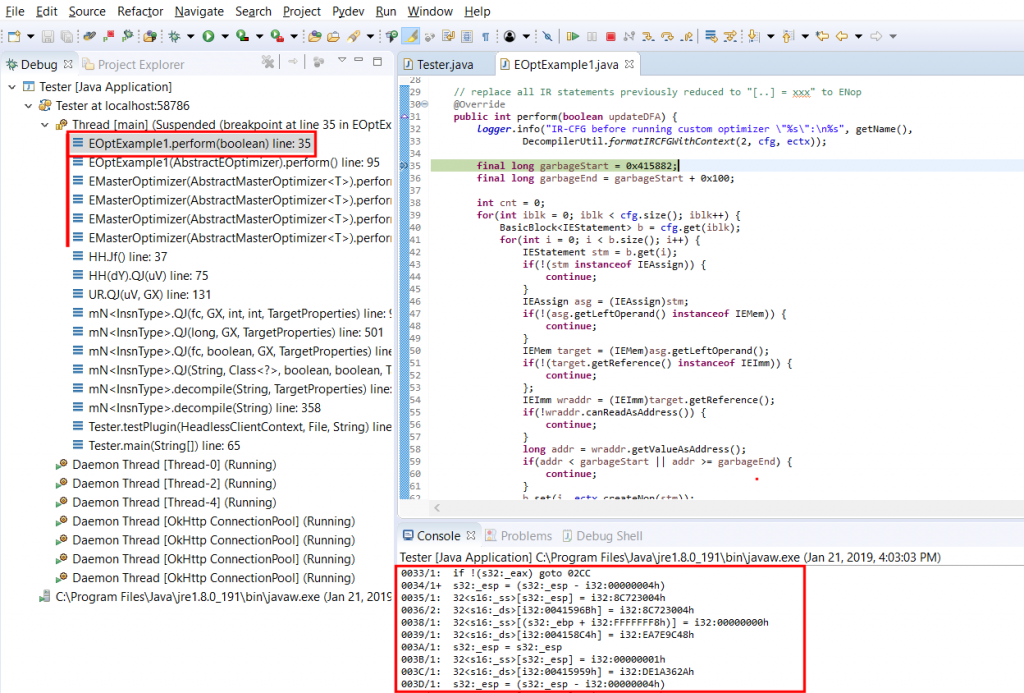
Before we deep-dive into perform(), let’s first set a breakpoint on line 15, where logger.info(…) is called. Then, start a debugging session for Tester: menu Run, command Debug (hotkey: F11.)
After a few seconds of analysis, your breakpoint should be hit; it corresponds to the first-time invocation of your custom optimizer. The logger prints out the IR-CFG that’s about to be optimized. Let’s have a look at it:
IR-CFG before running custom optimizer "Sample IR Optimizer #1":
>> IN(@0): ecx={@D} esp={@0} ebp={@1} ss={@1,@C,@18,@1D,@21,@24,@25,@27,@30,@35,@38,@3B,@3E,@3F,@41,@43,@46,@4F,@51,@54,@56,@59,@5C,@5D,@5F,@6B,@77,@81,@84,@9B,@9E,@A0,@AC,@B8,@BA,@BD,@BF,@C3,@C5,@C7,@CB,@CD,@D1,@D2,@D4,@E0,@E9,@EF,@F1,@F5,@F7,@FB,@FC,@FE,@100,@103,@106,@107,@109,@10C,@10E,@112,@114,@116,@11A,@11C,@11F,@122,@123,@12E,@131,@133,@137,@139,@13D,@13E,@140,@143,@145,@149,@14B,@14F,@150,@152,@15D,@173,@176,@179,@17C,@17D,@17F,@181,@18A,@18C,@18F,@191,@194,@196,@19A,@19D,@19E,@1A0,@1B3,@1BF,@1C2,@1D9,@1DC,@1E0,@1EC,@1EF,@1F1,@1F3,@1F7,@1F9,@1FC,@1FF,@202,@203,@205,@211,@21D,@220,@222,@226,@227,@229,@22B,@22E,@231,@232,@234,@237,@23A,@23C,@23E,@242,@244,@246,@24A,@24C,@250,@251,@25C,@25F,@262,@263,@265,@268,@26A,@26E,@271,@272,@27A,@27F,@295,@298,@29A,@29D,@2A4,@2A9,@2AD,@2B0,@2B2,@2B6,@2B7,@2BA,@2BC,@2C0,@2C2,@2C6,@2C7,@2CA,@2CD,@2D2,@2DE,@2E4,@2E7,@2E8,@2EA} ds={@F,@11,@19,@1E,@22,@28,@31,@36,@39,@3C,@40,@44,@4C,@4E,@52,@55,@57,@5A,@60,@6C,@74,@78,@7B,@82,@85,@86,@87,@8E,@90,@92,@9C,@A1,@A3,@A4,@AD,@B5,@B7,@BB,@C0,@C4,@C8,@CE,@D5,@E1,@EA,@ED,@F2,@F8,@FD,@FF,@101,@104,@10A,@10F,@113,@117,@11B,@11D,@120,@124,@12F,@134,@13A,@13F,@141,@146,@14C,@153,@15A,@15C,@163,@165,@166,@167,@170,@171,@174,@177,@17A,@17E,@180,@187,@189,@18D,@192,@197,@19B,@1A1,@1AB,@1B4,@1B7,@1B9,@1C0,@1C3,@1C4,@1C5,@1CC,@1CE,@1D0,@1DA,@1DD,@1DE,@1E1,@1E9,@1ED,@1F0,@1F4,@1FA,@1FD,@200,@206,@212,@219,@21B,@21E,@223,@228,@22A,@22C,@22F,@235,@238,@23B,@23F,@243,@247,@24D,@252,@25B,@25D,@260,@264,@266,@26B,@26F,@273,@27B,@27E,@285,@287,@288,@289,@292,@293,@296,@29B,@2A5,@2AA,@2AE,@2B3,@2B8,@2BD,@2C3,@2C8,@2CE,@2D0,@2D3,@2DF,@2E1,@2E2,@2E5,@2EB} OpenClipboard={@25} GetClipboardData={@3F,@17D} GlobalAlloc={@FC,@227} GlobalLock={@107,@232} GlobalUnlock={@13E,@263} SetClipboardData={@150,@272,@2B7,@2C7} CloseClipboard={@2CB} Sleep={@2E8} sub_401000={@D} sub_405010={@5D} sub_404F80={@D2} sub_4024E0={@123,@251} sub_404E54={@19E} sub_404E14={@203}
0000/1>  s32:_esp = (s32:_esp - i32:00000004h)                                                                 DU: esp={@1,@2,@B}                 | UD: esp={}
0001/1:  32<s16:_ss>[s32:_esp] = s32:_ebp                                                                      DU:                                | UD: esp={@0} ebp={} ss={}
0002/9:  s32:_ebp = s32:_esp                                                                                   DU: ebp={@38,@41,@46,@4F,@54,@56,@84,@9E,@B8,@BD,@C5,@FE,@100,@10C,@114,@11C,@131,@140,@15D,@176,@17F,@181,@18A,@18F,@194,@1C2,@1DC,@1EF,@1F1,@1FC,@229,@22B,@237,@23C,@244,@25C,@265,@27F,@298,@29D}  | UD: esp={@0}
000B/1:  s32:_esp = (s32:_esp - i32:0000002Ch)                                                                 DU: esp={@C,@D,@17}                | UD: esp={@0}
000C/1:  32<s16:_ss>[s32:_esp] = i32:0040117Ch                                                                 DU:                                | UD: esp={@B} ss={}
000D/1:  call s32:_sub_401000(s32:_ecx)->(s32:_eax){32[s32:_esp]}                                              DU: eax={}                         | UD: ecx={} esp={@B} sub_401000={}
000E/1+  s32:_edi = i32:00415882h                                                                              DU: edi={}                         | UD:
000F/1:  32<s16:_ds>[i32:00415944h] = i32:E2E60682h                                                            DU:                                | UD: ds={}
0010/1:  s32:_eax = i32:00000001h                                                                              DU: eax={}                         | UD:
0011/6:  32<s16:_ds>[i32:00415904h] = i32:7C64C0E4h                                                            DU:                                | UD: ds={}
0017/1:  s32:_esp = (s32:_esp - i32:00000004h)                                                                 DU: esp={@18,@1A}                  | UD: esp={@B,@2EC}
0018/1:  32<s16:_ss>[s32:_esp] = i32:E87A1612h                                                                 DU:                                | UD: esp={@17} ss={}
0019/1:  32<s16:_ds>[i32:004158DDh] = i32:E87A1612h                                                            DU:                                | UD: ds={}
001A/1:  s32:_esp = (s32:_esp + i32:00000004h)                                                                 DU: esp={@1C}                      | UD: esp={@17}
001B/1:  nop                                                                                                   DU:                                | UD:
001C/1+  s32:_esp = (s32:_esp - i32:00000004h)                                                                 DU: esp={@1D,@20}                  | UD: esp={@1A}
001D/1:  32<s16:_ss>[s32:_esp] = i32:CCA4A4A0h                                                                 DU:                                | UD: esp={@1C} ss={}
001E/2:  32<s16:_ds>[i32:004158CAh] = i32:CCA4A4A0h                                                            DU:                                | UD: ds={}
0020/1:  s32:_esp = s32:_esp                                                                                   DU: esp={@21,@23}                  | UD: esp={@1C}
0021/1:  32<s16:_ss>[s32:_esp] = i32:00000000h                                                                 DU:                                | UD: esp={@20} ss={}
0022/1:  32<s16:_ds>[i32:00415951h] = i32:249E4228h                                                            DU:                                | UD: ds={}
0023/1:  s32:_esp = (s32:_esp - i32:00000004h)                                                                 DU: esp={@24,@25,@26}              | UD: esp={@20}
0024/1:  32<s16:_ss>[s32:_esp] = i32:004011CAh                                                                 DU:                                | UD: esp={@23} ss={}
0025/1:  call s32:_OpenClipboard(32<s16:_ss>[(s32:_esp + i32:00000004h)])->(s32:_eax){32[s32:_esp]}            DU: eax={@33}                      | UD: esp={@23} ss={} OpenClipboard={}
...
... (trimmed)
...
The above IR listing is a human-friendly representation of IR statements. The general format of this listing is:
- offset: IR statement offset - length: IR statement length (generally, 1) - C: indicates whether the instruction is - the entry-point instruction (>) - the first of a basic-block (+) - any other instruction (:) - insn: IR statement instruction (refer to Part 1 of this blog series) - DU/UD: routine def-use and use-def chains - IN: live input variables at the entry-point - OUT: reaching output variables at a given exit point
We breakpoint’ed on logger.info(), and single-stepped one line. The output can be seen in the console view. It may be better (depending on how large your console buffer is) to examine the full output dumped to jeb-plugin-tester.log in your Temp folder.
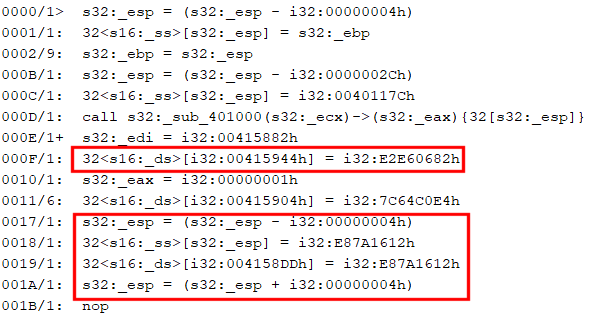
The IR listing is relatively readable, although quite verbose at this early stage of optimization (roughly, the first pass in tier 1 of the analysis pipeline). The important idioms to look at here are:
Preliminary conversion of low-level junk inserts
a/ The first one is an Assign(Mem(Imm), Imm), which corresponds to optimized “mov [edi + offset], value”, where the value of edi was determined, propagated further, and the addition folded and converted to an immediate address.
b/ The second one is a partially optimized “push value / pop [address]”. Later optimizations phases will find and remove esp updates or esp-based operations, as was shown in the pseudo-code earlier. What we need to focus on here is the Assign(Mem(Imm), Imm), like the one in a/.
Those are the bits we will look for and modify: Assuming those assignments are useless, we will simply replace them by Nop statements.
Writing the Optimizer
At this point, our preliminary understanding of the obfuscation is enough to start writing the clean-up optimizer. Its code is extremely simple, for two main reasons: – The obfuscation scheme itself is relatively trivial – Other built-in JEB optimizers are giving us clean IR assignments to work on
Let’s look at the code of proceed():
    @Override
    public int perform(boolean updateDFA) {
        final long garbageStart = 0x415882;
        final long garbageEnd = garbageStart + 0x100;
        int cnt = 0;
        for(int iblk = 0; iblk < cfg.size(); iblk++) {
            BasicBlock<IEStatement> b = cfg.get(iblk);
            for(int i = 0; i < b.size(); i++) {
                IEStatement stm = b.get(i);
                if(!(stm instanceof IEAssign)) {
                    continue;
                }
                IEAssign asg = (IEAssign)stm;
                if(!(asg.getLeftOperand() instanceof IEMem)) {
                    continue;
                }
                IEMem target = (IEMem)asg.getLeftOperand();
                if(!(target.getReference() instanceof IEImm)) {
                    continue;
                };
                IEImm wraddr = (IEImm)target.getReference();
                if(!wraddr.canReadAsAddress()) {
                    continue;
                }
                long addr = wraddr.getValueAsAddress();
                if(addr < garbageStart || addr >= garbageEnd) {
                    continue;
                }
                b.set(i, ectx.createNop(stm));
                cnt++;
            }
        }
        return postPerform(updateDFA, cnt);
    }
This optimizer inherits from AbstractEOptimizer. Therefore, the perform() method works on an IR-CFG. (Not all optimizers may choose to do so; it is sometimes easier to work directly on statements or expressions.)
process() goes through all statements or every basic block of the IR-CFG. Using the instanceof operator, we check that the statement is an assignment such as: Mem(address) = Imm. The address is retrieved, and we make sure that it falls within the junk array. If those checks succeed, we replace the assignment by a Nop.
And that is it. Clean and simple – although, not quite portable, since the junk array address and size are hard-coded into the code! But that is not the point of this blog, and neither is portability a first-class goal when writing optimizers for custom code.
Next up, let’s see how to use the plugin in an interactive session using the desktop client.
Building, Deploying, Interactive Use
In order to use the optimizer within the JEB desktop client, we either:
Register the plugin as a development plugin;
Or build the plugin as a Jar and drop it in JEB’s coreplugins/ folder.
Development Plugin
This is the easiest option. You may consider it as an intermediate step between prototyping with the headless client, as demonstrated above, and a full-blown, deployed Jar plugin.
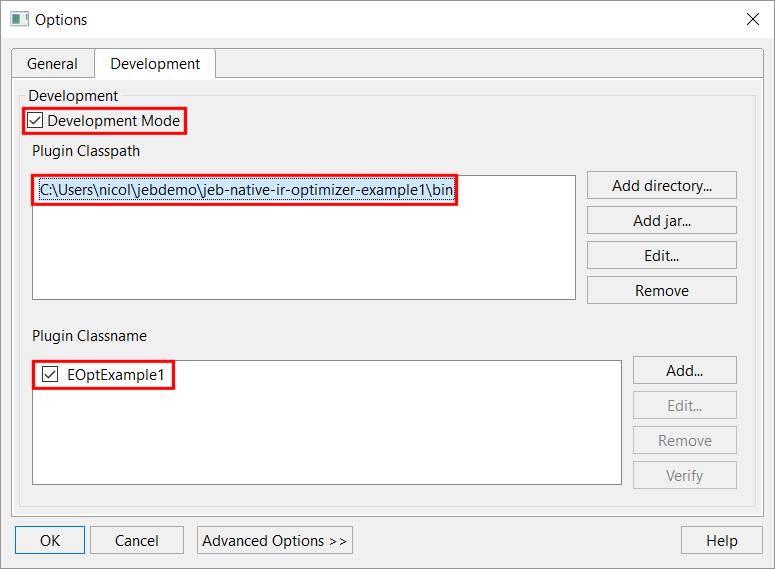
Open the Options panel, Development tab, tick the option “Development Mode”, add the bin/ folder of your plugin’s project to the classpath, and add the classname of your plugin entry-point:
Setting up a development plugin in JEB UI
Press OK and restart JEB. Your plugin will be loaded and ready to use. You may now skip to the section “Using the IR optimizer plugin”.
Building a Jar plugin
The alternative is to run build.cmd (on Windows) or build.sh (on Linux/macOs), which calls an Ant script in the scripts/ folder, therefore, make sure to have Ant installed on your system first. You may also customize the plugin name and version before building.
The resulting Jar plugin file will be generated in your project’s out/ folder. Copy it to your JEB coreplugins/ folder and start the JEB client. Your plugin will be automatically loaded, along with the other plugins.
Using the IR Optimizer Plugin
If your plugin has the type STANDARD (default), then, as explained earlier, it will be invoked by the optimizations’ orchestrator automatically, at various times during the decompilation pipeline. If that’s the mode you’d like to choose, make sure that your plugin is generic enough to handle all types of input routines, else you’re in for some strange surprises if you ever forget to remove it from your coreplugins/ folder.
An alternative is to convert it to an on-demand plugin:
public EOptExample1() {
        super(DataChainsUpdatePolicy.UPDATE_IF_OPTIMIZED);
        getPluginInformation().setName("Sample IR Optimizer #1");
        getPluginInformation().setDescription("Remove IR-statements reduced to \"*(&garbage + delta) = xxx\"");
        getPluginInformation().setVersion(Version.create(1, 0, 0));

        // Standard optimizers are normally run, as part of the IR optimization stages in the decompilation pipeline
        //setType(OptimizerType.STANDARD);

        // alternative (better for production / in UI use):
        setType(OptimizerType.ON_DEMAND);
        setPreferredExecutionStage(-NativeDecompilationStage.LIFTING_COMPLETED.getId());
        setPostProcessingActionFlags(PPA_OPTIMIZATION_PASS_FULL);
    }
– Line 11 makes the optimizer on-demand. Users must manually activate it, on specific code. – Line 12 is recommended for on-demand optimizers: we specify at which point in in the pipeline the plugin should be called. – Finally, we set some post-processing flags, specifying that a full round of standard optimizations must be performed after our custom optimizer has run: this will allow cleaning up code remnants, and optimize our IR-CFG further – something made possible after running an optimization pass like this one.
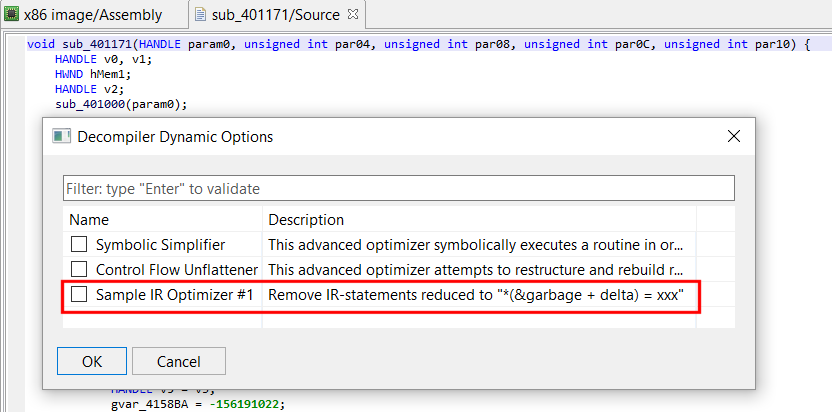
On-demand optimizer plugins show up in the File, Advanced Unit Options dialog box, that you may bring up when a decompiled routine has the focus:
List of on-demand optimizers managed by a given decompiler instance
Tick the optimizer box, press OK. The routine will be re-decompiled.
Clean Code
Regardless which method you choose, once cleaned up, the IR will allow for better downstream pipeline phases, including typing, AST generation, AST optimizations, etc.
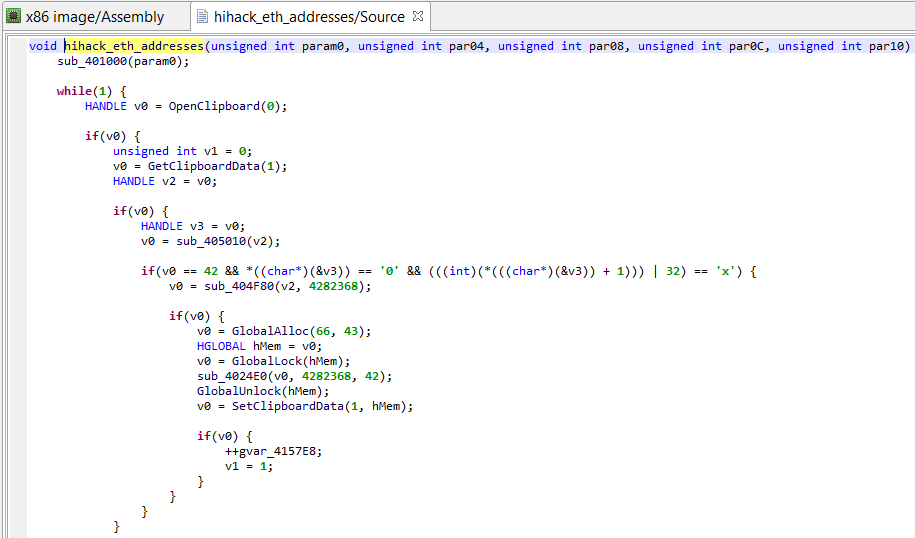
The pseudo-C code has become quite readable:
The same decompiled method, after deobfuscation by the custom plugin.
Conclusion
That is it for part 2. We scratched the surface of IR optimizers (which themselves are a relatively small – albeit important – part of the overall decompilation pipeline 2) but it’s a good start. I strongly encourage you to experiment and ask your questions on our Slack channel. One ongoing effort right now is to bring the API documentation up to speed in terms of contents and sample code.
In part 3, we will continue exploring IR optimizers. Later on in the series, we will show how to write AST optimizers 3, how to write decompilation modules, and show how existing decompilers can be cutomized further. Stay tuned!
JEB must have been previously run, at least once: EULA accepted, license key generated, etc. ↩
The decompilation pipeline is one component of the native analysis pipeline, which is one module, among tens, of the JEB back-end: the public API is worth exploring if you’re into advanced use cases. ↩
AST generation is one of the very final decompilation phases – working on the syntax tree serves different purposes than working on the IR ↩
JEB native code analysis components make use of a custom intermediate representation (IR) to perform code analysis.
Some background: after analysis of a code object, the native assembly of a reconstructed routine is converted to an intermediate representation. 1 That IR subsequently goes through a series of transformation passes, including massages and optimizations. Final stages include the generation of high-level C-like code. Most stages in this pipeline can be customized by users via the use of plugins. A high-level, simplified view of the pipeline could be as follows:
CodeObject (*)
  -> Reconstructed Routines & Data
    -> Conversion to IR (low-level, non-optimized)
      -> IR Optimizations
        -> Final IR (higher-level, optimized, typed)
          -> Generation of AST
            -> AST Optimizations
              -> Final AST (final, cleaned)
                -> High-level output (eg, C variant)
(*) Examples of code objects: a Windows PE file with x86-code, an ELF library with with MIPS code, a headless ARM firmware, a Wasm binary file, an Ethereum smart contract, etc.
Two important JEB API components to hook into and customize the native analysis pipeline are: – The IR classes – The AST classes We will start looking at IR components through the rest of this part 1.
IR Description
JEB IR can be seen as a low-level, imperative assembly language, made of expressions. Highest-level expressions are statements. Statements contain expressions. Generally, expressions can contain expressions. IR can be accessed via interfaces in the JEB API. The top-level interface for all IR expressions is IEGeneric. All IR elements start with IExxx. 2
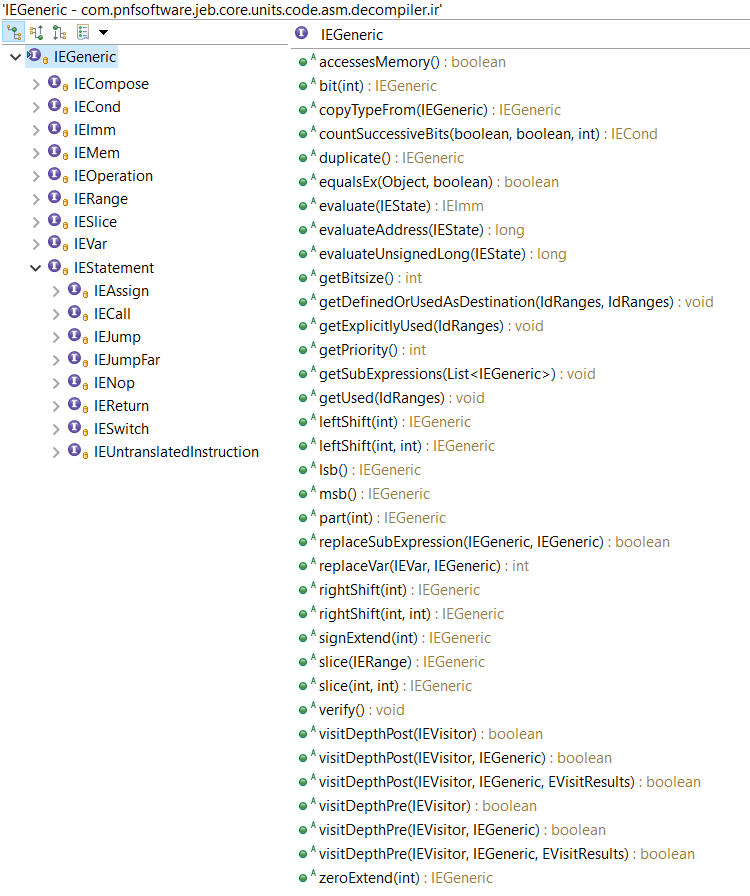
The diagram below shows the current hierarchy of IR expression interfaces:
Note that IEGeneric sits at the top. All other IRE’s (short for IR Expressions from now on) derive from it. Let’s go through those interfaces:
IEImm: Integer immediate of arbitrary length. Eg, Imm(0x1122, 64) would represent the 64-bit integer value 0x1122.
IEVar: Generic IRE to represent variables. Variables can represent underlying physical registers, virtual registers, local function variables, global program variables, etc.
IEMem: Piece of memory of arbitrary length. The memory address itself is an IRE; the accessed bitsize is not.
IECond: A ternary expression “c ? a: b”, where a, b and c are IRE’s.
IERange: A fixed integer range, commonly used with Slice
IESlice: A chunk (contents range) of an existing IR. Eg, Slice(Imm(0x11223344, 32), 16, 24)) can be simplified to Imm(0x22, 8)
IECompose: The concatenation of two or more IRE’s (IR0, IR1, …), resulting in an IR of size SUM(i=0->n, bitsize(IRi))
IEOperation: A generic operation expression, with IRE operands and an operator. Eg, Operation(ADD,Imm(0x10,8),Mem(Imm(0x10000,32),8)). Most standard operators are supported, as well as less standard operators such as the Parity function or Carry function.)
IEStatement: the super-interface for IR statements; we will detail them below.
An IR translation unit, resulting from the conversion of a native routine, consists of a sequential list of IEStatement objects. An IR statement has a size (generally, but not necessarily, 1) and an address (generally, a 0-based offset relative to its position in the translation unit).
As of JEB 3.0.8, IR statements can be:
IEAssign: The most common of all statements: an assignment from a right-side source to a left-side destination. While the source can be virtually anything, the destination IRE is restricted to a subset of expressions.
IENop: This statement does nothing but consumes virtual size in the translation unit.
IEJump: An unconditional or conditional jump within the translation unit, expressed using IR offsets.
IEJumpFar: An unconditional or conditional far jump (can be outside the translation unit), expressed using native addresses.
IECall: Represent a well-formed static or dynamic dispatch to another IR translation unit. The dispatch expression can be any IRE (eg, an Imm for a static dispatch; a Var or Mem for a dynamic dispatch).
IEReturn: A high-level expression used to denote a return-to-caller from a translation unit representing a routine. This IRE is always introduced by later optimization passes.
IEUntranslatedInstruction: This powerful statement can be used to express anything. It is generally used to represent native instructions that cannot be readily translated using other IR expressions. (Users may see it as an IECall on steroid, using native addresses. In that sense, it is to IECall what IEJumpFar is to IEJump.)
Now, let’s look at a few examples of conversions.
IR Examples
Let’s assume the following EVars were previously defined by an Intel x86 (or x86-64) converter: tmp (a 32-bit EVar representing a virtual placeholder register); eax (an EVar representing the physical register %eax); ?f (1-bit EVars representing standard x86 flags).
x86: mov eax, 1
s32:_eax = s32:00000001h
Translating this mov instruction is straight-forward, and can be done with a single Assign IR statement.
x86-64: not r9d
s64:_r9 = C(~(s64:_r9[0:32[), i32:00000000h)
Translating a not-32-bit-register on an x86-64 platform is slightly more complex, as the upper 32-bit of the register are zeroed out. Here, the converter is making use of three nested IREs: (IECompose(IEOperation(NOT, Slice(r9, 0, 32))))
Reading IR.IECompose are pretty-printed as C(lo, …, hi), IESlice as Expr[m:n[
One side-effect of arithmetic operations on x86 is the modification of flag registers. A converter explicits those side effects. Consequently, translating the exclusive-or above resulted in several Assign IR statements to represent register and flags updates. 3
Reading IR. IEMem are pretty-printed as bitsize<SegmentIR>[AddressIR]
The translation of add makes use of the temporary, virtual EVar tmp. It holds the original value of %eax, before the addition was done. That value is necessary for some flag update computations (eg, the overflow flag.) Also take note of the use of special operators Parity and Carry in the converted stub.
Note that a native address is written to the RIP-IEVar (or any EVar representing the Program Counter – PC). PC-assignments like those can later be optimized to IEJump, making use of IR Offsets instead of Native Addresses.
Also note that the Control Flow Graph (CFG) of the native instruction in the examples thus far are isomorphic to their IR-CFG translated counterparts. That is not always the case, as seen in the example below.
Reading IR. conditional IEJump are pretty-printed “if (cond) goto IROffset”. Unconditional IEJump are rendered as simple “goto IROffset”.
This IR-CFG is not isomorphic to the native CFG. Additional edges (per the presence of 2x IEJump) are used to represent the compare “[esi+xxx] to [edi+xxx]” loop.
Accessing IR
The JEB back-end API allows full access to several IR-CFG’s, from low-level, raw IR to partially optimized IR, to fully lifted IR just before AST generation phases.
Navigating the IR in the GUI
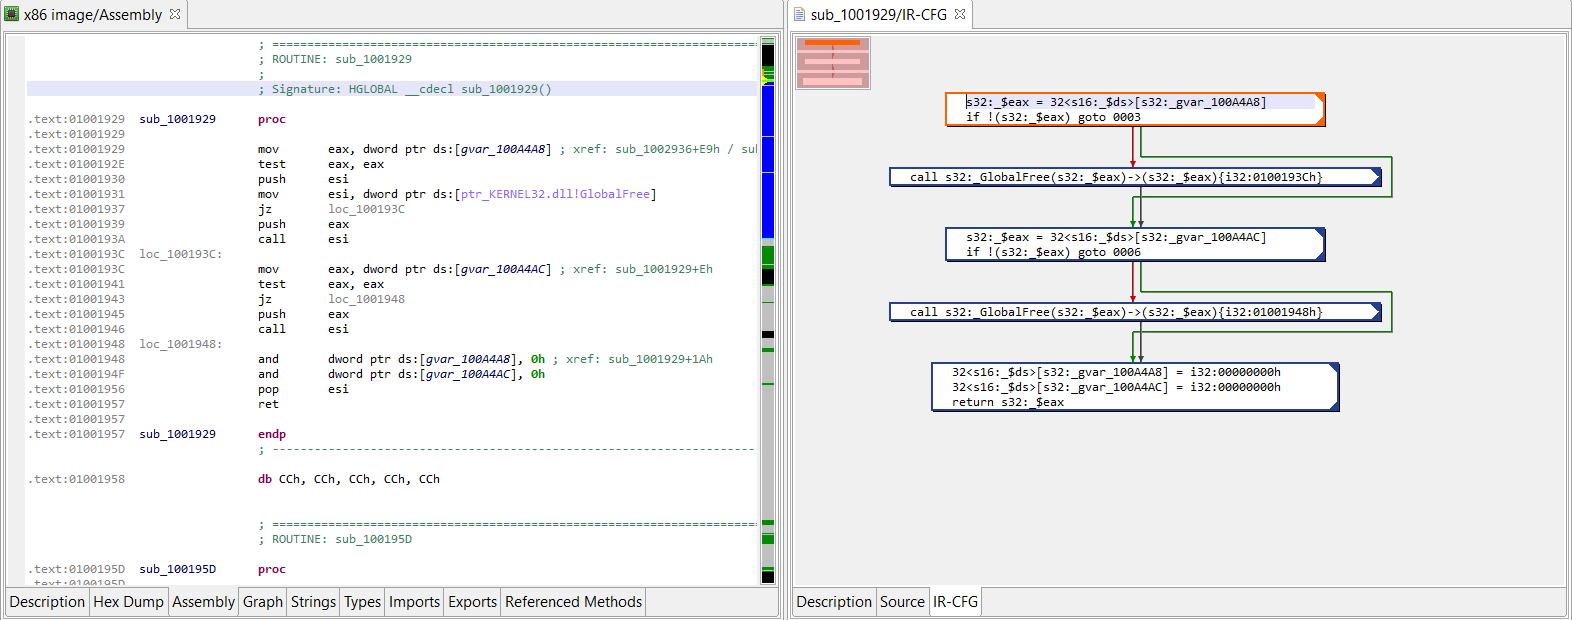
The UI client currently provides access to the most optimized IR of routines. Those IR-CFG’s can be examined in the apt-named fragment right next to the source fragment showing decompiled code. Here is an example of a side-by-side assemblies (x86, IR). The next screenshot shows the decompiled source.
Left-side: x86 routine / Right-side: optimized IR of the converted routine (Click to enlarge)
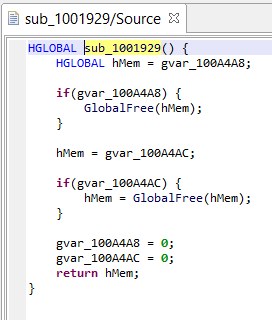
Decompiled source
IR via API
The API is the preferred method when it comes to power-users wanting to manipulate the IR for specific needs, such as writing a custom optimizer, as we will see in the next blog in this series.
Reminder: JEB back-end plugins can be written in Java (preferably) or Python. JEB front-end scripts can be written in Python, and can run both in headless clients (eg, using the built-in command line client) or the UI client.
For now, let’s see how to write a Python script to:
Retrieve a decompiled routine
Get the generated Intermediate Representations
Print it out
The following script does retrieve the first internal routine of a Native unit, decompiles it, retrieve the default (latest) IR, and prints out its CFG. The full scripts is available on GitHub.
# retrieve `unit`, the code unit

# GlobalAnalysis is assumed to be on (default)
decomp = DecompilerHelper.getDecompiler(unit)
if not decomp:
  print('No decompiler unit found')
  return

# retrieve a handle on the method we wish to examine
method = unit.getInternalMethods().get(0)#('sub_1001929')
src = decomp.decompile(method.getName(True))
if not src:
  print('Routine was not decompiled')
  return
print(src)

decompTargets = src.getDecompilationTargets()
print(decompTargets)

decompTarget = decompTargets.get(0)
ircfg = decompTarget.getContext().getCfg()
# CFG object reference
# see package com.pnfsoftware.jeb.core.units.code.asm.cfg
print("+++ IR-CFG for %s +++" % method)
print(ircfg.formatSimple())
Running on Desktop Client. Run this script in the UI client via File, Scripts, Run… (hotkey: F3). Remember to open a binary file first, with a version of JEB that ships with the decompiler for that file’s architecture.
Running on the command-line. You may also decide to run it on the command-line. Example, on Windows:
That is it for part 1. In part 2, we will continue our exploration of the IR and see how we can hook into the decompilation pipeline to write our custom optimizers to clean packer-specific obfuscation, as well as make use of the data flow analysis components available with the IR-CFG. Stay tuned!
Working on IR presents several advantages, two of which being: a/ the reduction of coupling between the analysis pipeline and the input native architecture; b/ and offering a side-effect free representation of a program. ↩
The design choices of JEB IR are out-of-scope for this blog. They may be the subject of a separate document. ↩
When decompiling routines, IR optimization passes will iteratively refactor and clean-up unnecessary operations. In practice, most flag assignments will end up being removed or consolidated. ↩