This is the second entry in our series showing how to use JEB and its well-known and lesser-known features to reverse engineer malware more efficiently. Part 1 is here.
Today, we’re having a look at an interesting portion of a x86-64 Windows malware that carries encrypted strings. Those strings happen to be decrypted on the fly, the first time they’re required by some calling routine.
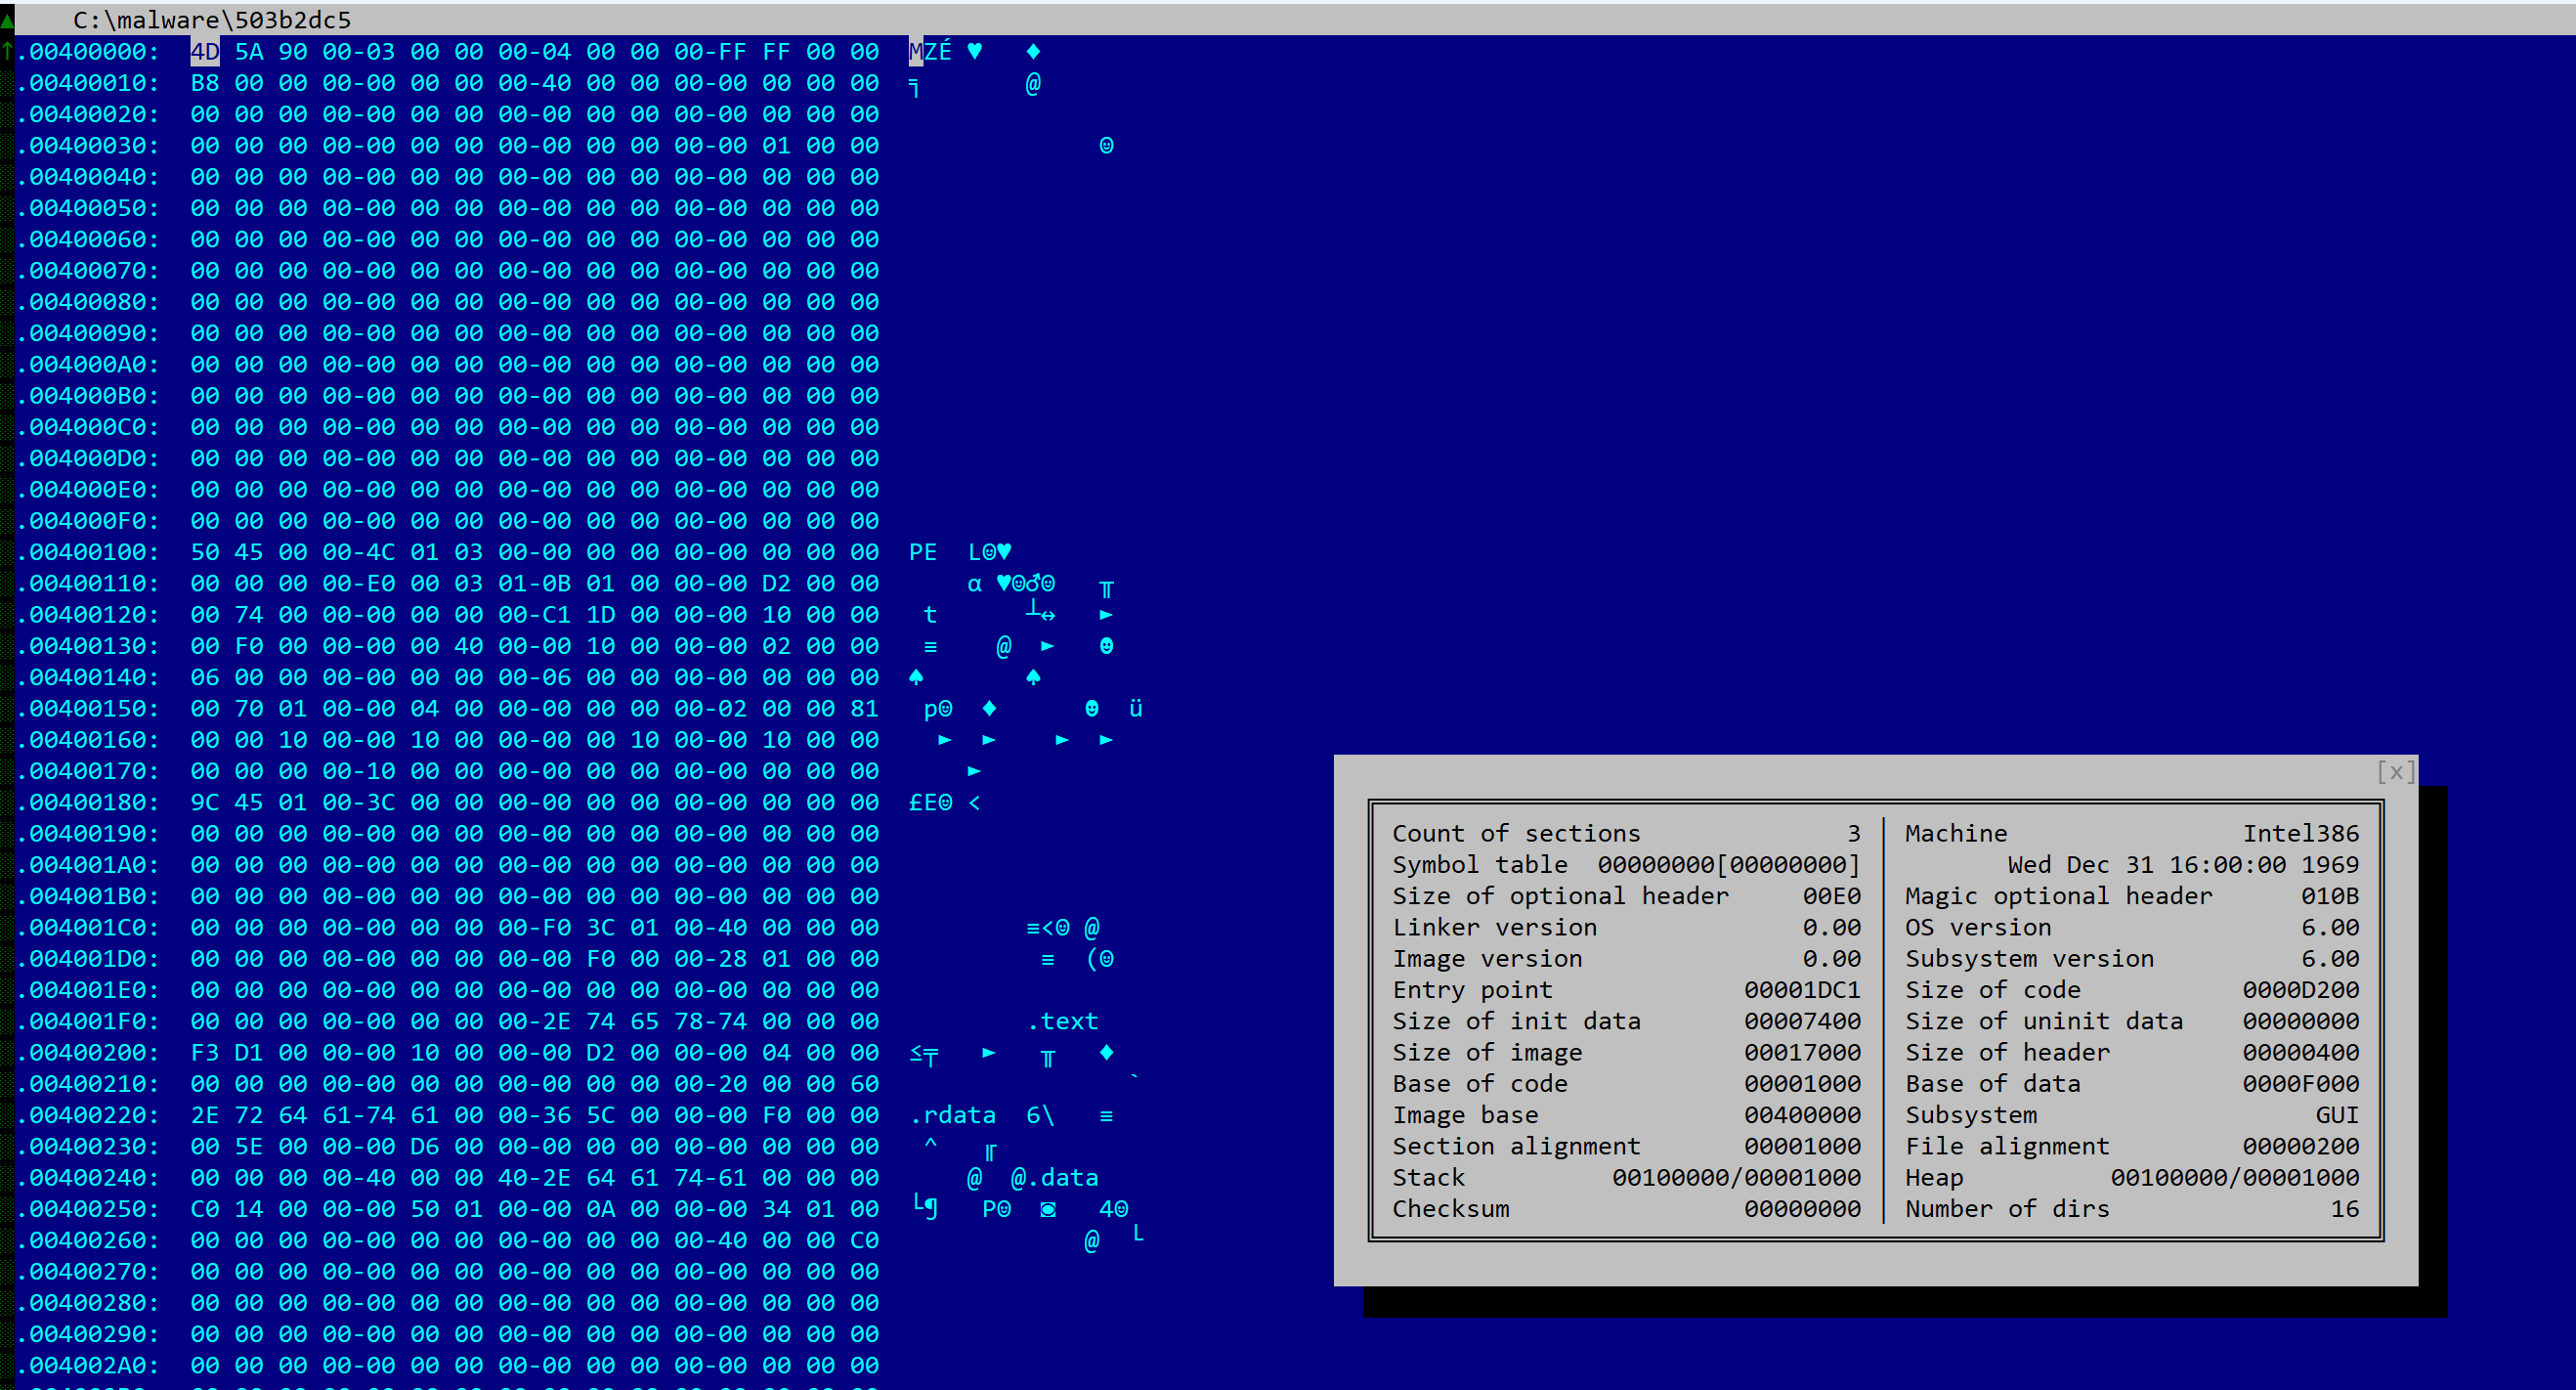
SHA256: 056cba26f07ab6eebca61a7921163229a3469da32c81be93c7ee35ddec6260f1. The file is not packed, it was compiled for Intel x86 64-bit processors, using an unknown version of Visual Studio. The file is dropped by another malware and its purpose is reconnaissance and information gathering. Let’s load it in JEB 5.8 and do a standard analysis (default settings).
Initial decompilations
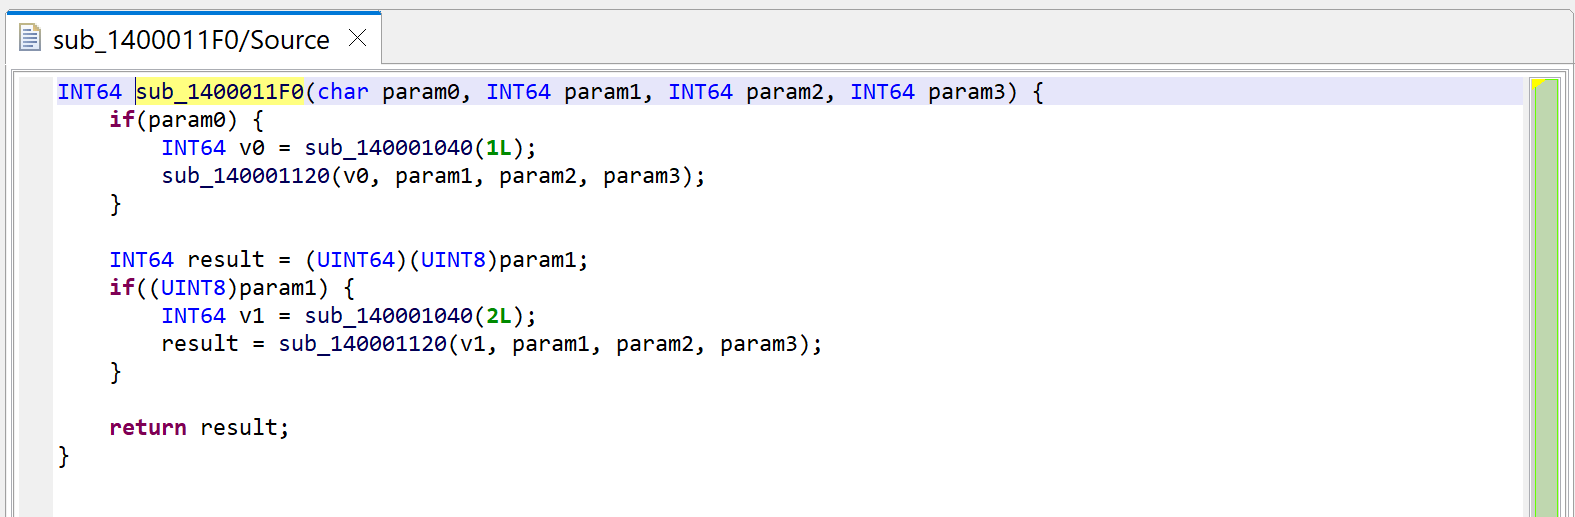
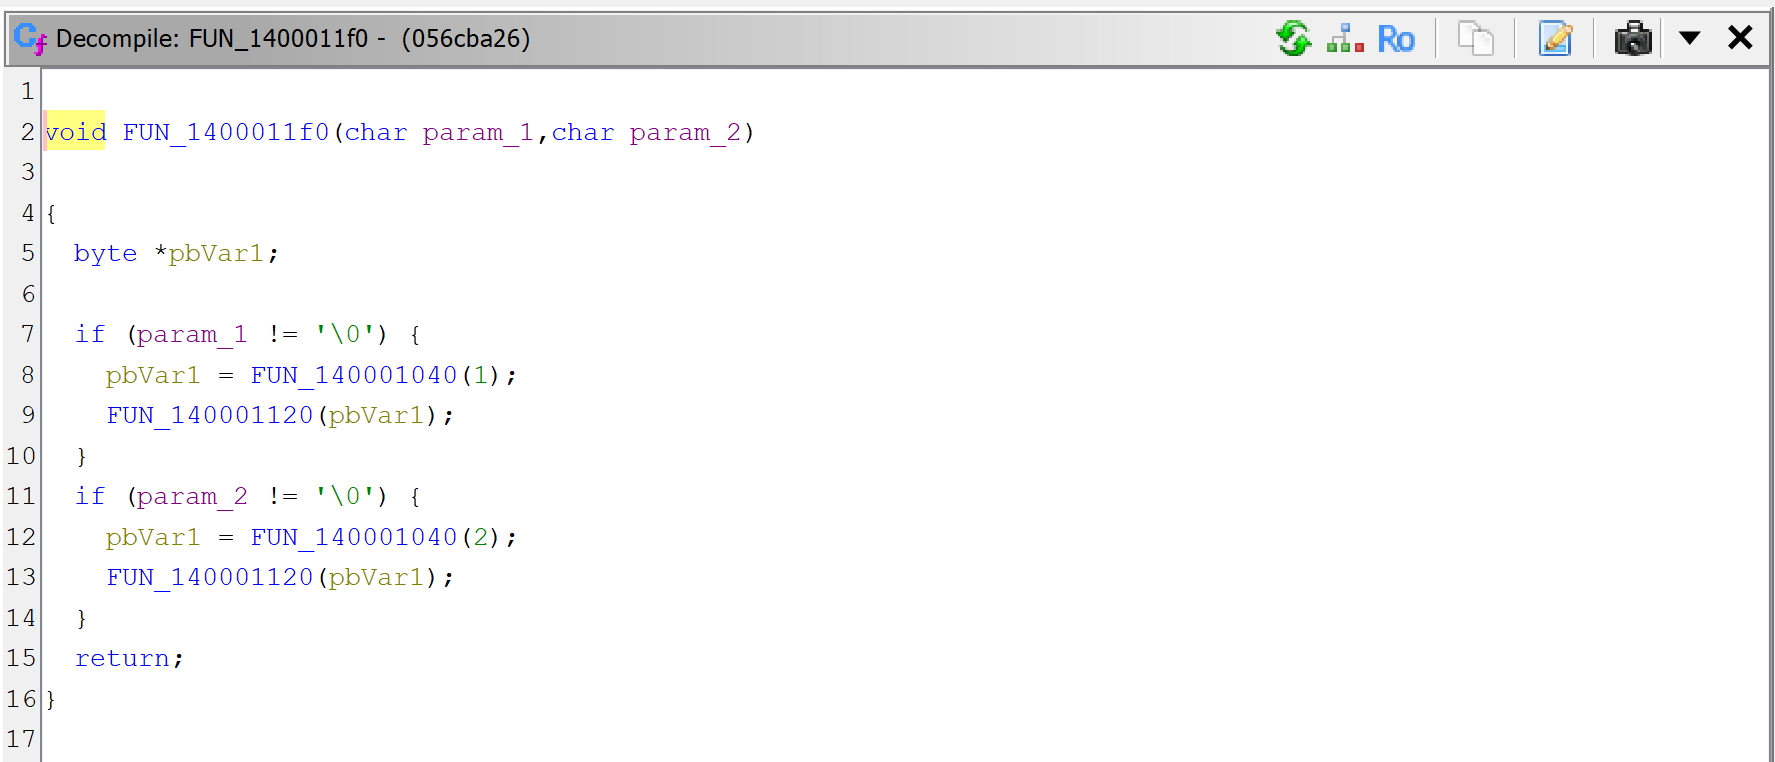
For the sake of showing what mechanism is at play, we’re first looking at sub_1400011F0. Let’s decompile it by pressing the TAB key (menu: Action, Decompile…).
Raw decompilation of sub_1400011F0, before examining its callees.
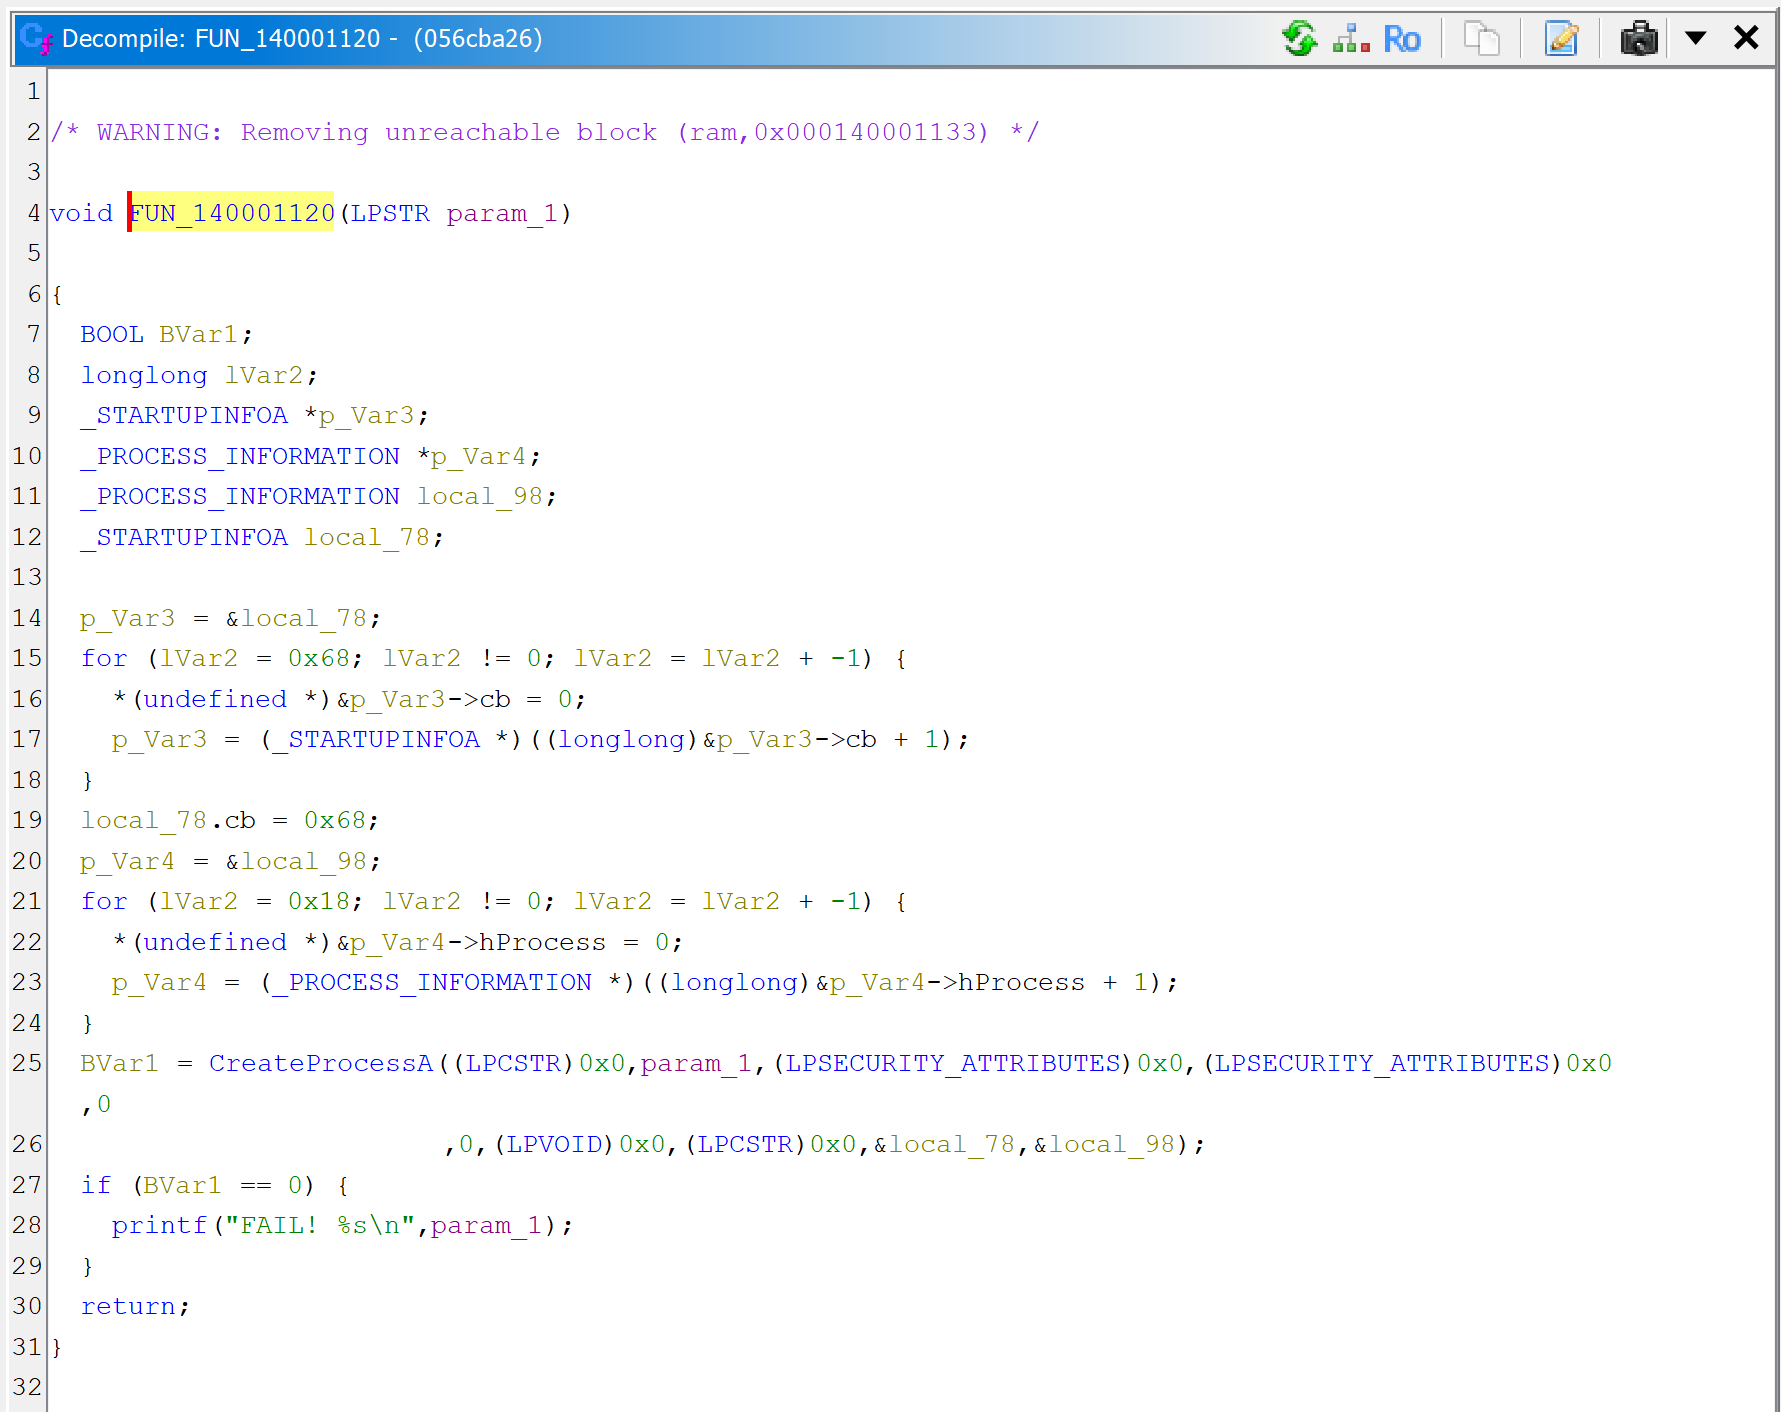
Then, let’s decompile the callee sub_140001120.
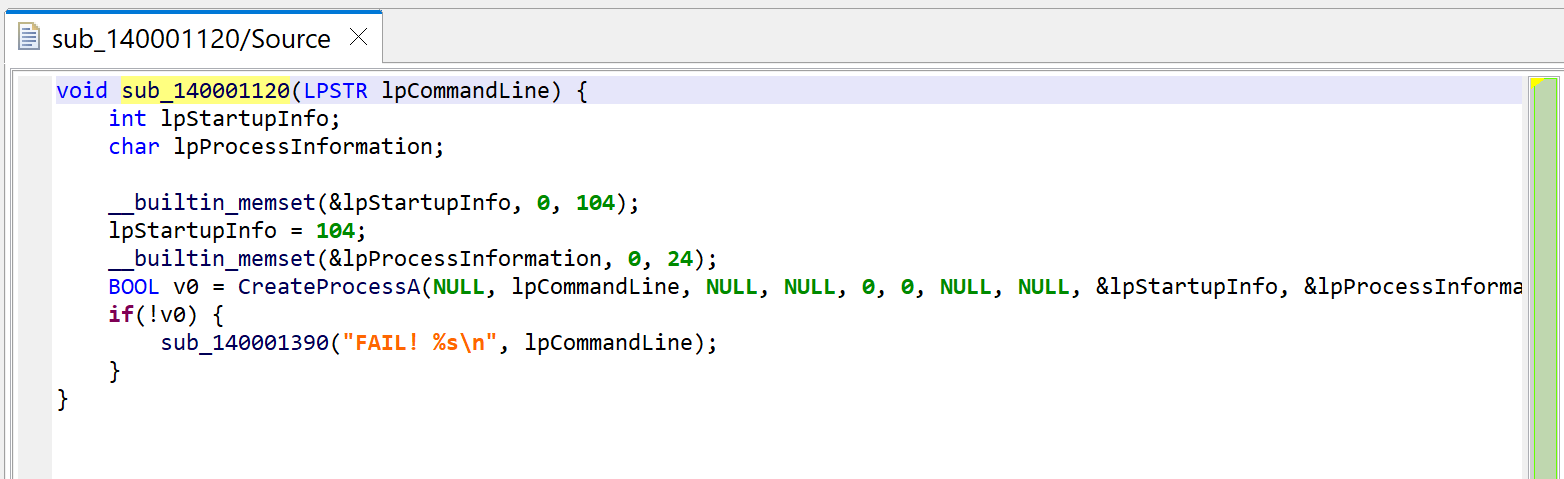
JEB can now thoroughly look at the routine and refines the initial prototype that was applied earlier, when the caller sub_1400011F0 was decompiled. It is now set to: void(LPSTR).
The code itself is a wrapper around CreateProcess; it executes the command line provided as argument.
sub_140001120 executes a command-line with CreateProcess. Note the refined prototype, void(LPSTR).
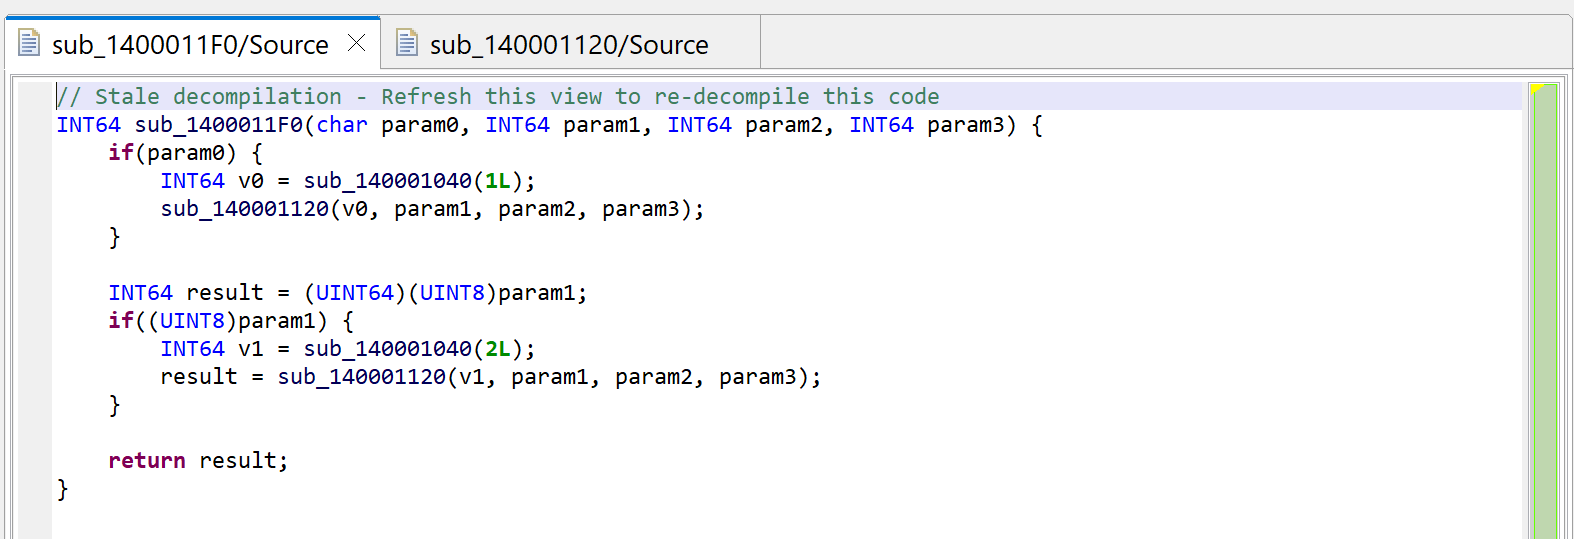
Press escape to navigate back to the caller, or alternatively, examine the callers by pressing X (menu: Action, Cross-references…) and select sub_1400011F0. You will notice that JEB is now warning us that the decompilation is “stale”.
The initial decompilation of sub_1400011F0 is stale after the decompilation of sub_140001120 yielded a better prototype.
Second decompilation
The reason is that the prototype of sub_140001120 was refined by the second decompilation (to void(LSPTR)), and the method can be re-decompiled to a more accurate version.
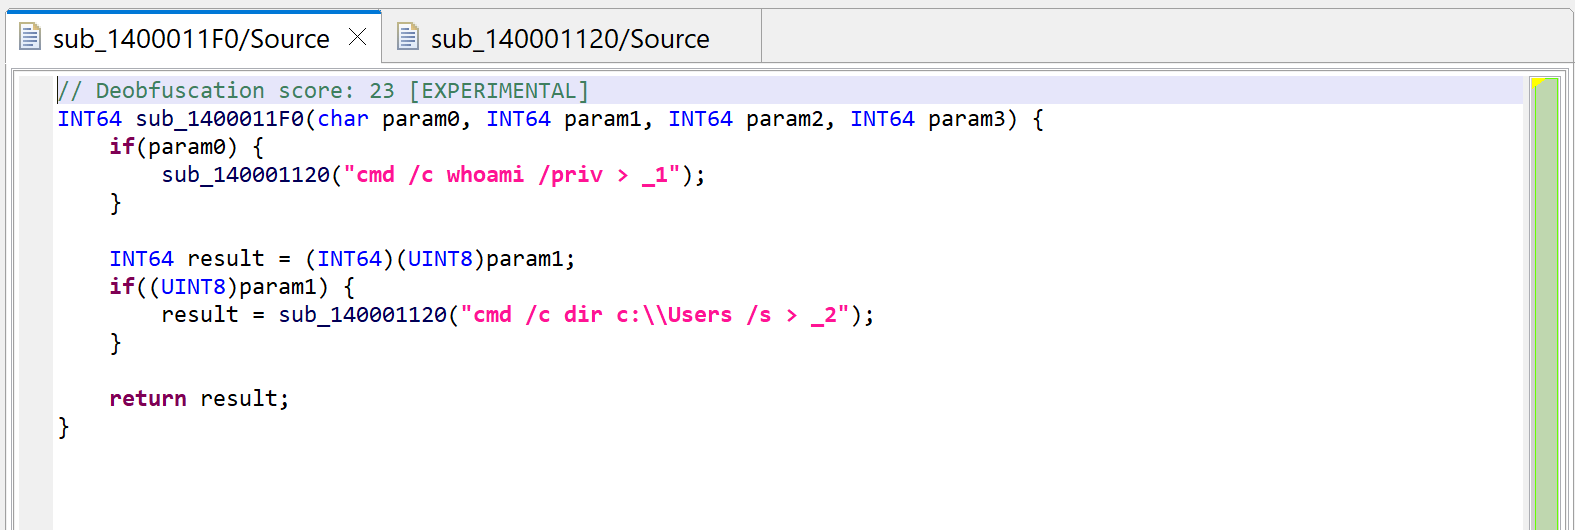
Let’s redecompile it: press F5 (menu: Window, Refresh). You can see that second decompilation below. What happened to the calls to sub_140001040?
Second decompilation of sub_1400011F0, showing some decrypted strings instead of calls to sub_140001040.
String auto-decryption
Notice the following:
A “deobfuscation score” note was added as a method comment (refer to part 1 of the series)
The calls to sub_140001040 are gone, they have been replaced by dark-pink strings
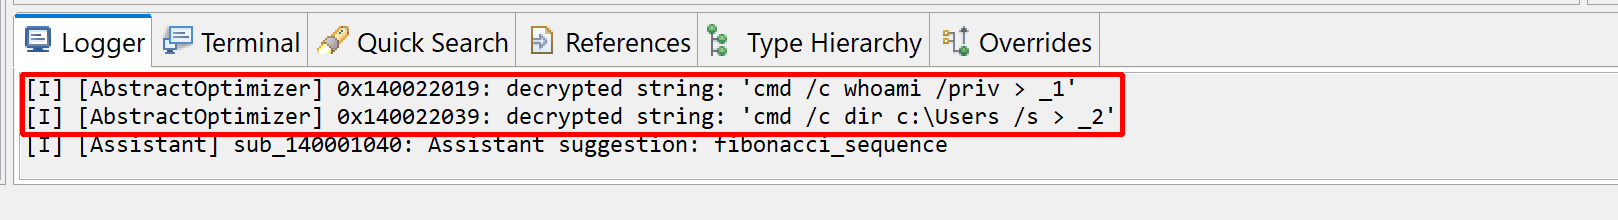
JEB also notified us in the console:
Notifications about decrypted strings replace in decompiled code.
Dark-pink strings represent synthetic strings not present in the binary itself. Here, they are the result of JEB auto-decrypting buffers by emulating the calls to routine sub_140001040, which was identified as a string provider. Indeed, the decompilation of sub_140001120 helped, since the inferred parameter LPSTR was back-propagated to the callers, which in that case, was the return value of sub_140001040.
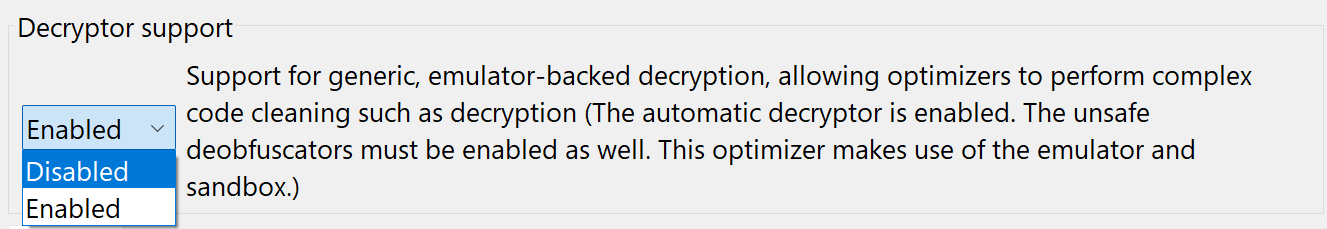
Auto-decryption can be very handy. In the case of this malware, we can immediately see what will be executed by CreateProcess: shells executing whoami and dir and redirecting outputs to files in the local folder. However, if necessary, this feature can be disabled via the “Decryptor Options” in the decompiler properties:
Menu: Options, Back-end properties… to globally disable this in the future, except for your current project
Menu: Options, Specific Project properties… for the current project only
Or you may simply redecompile the method with CTRL+TAB (menu: Action, Decompile with options…) and disable string decryptor for specific code
The string auto-decryptor may be enabled or disabled in the options
The decryptor routine
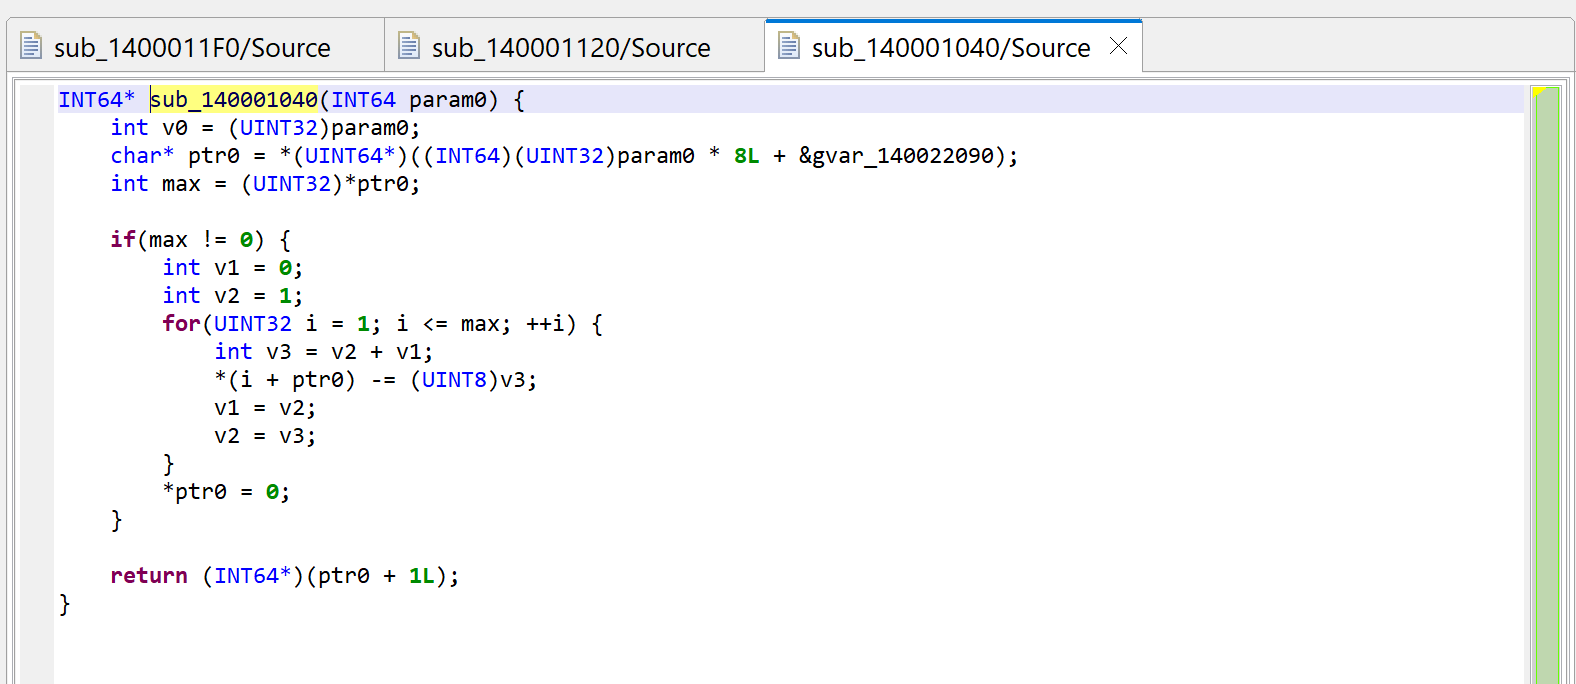
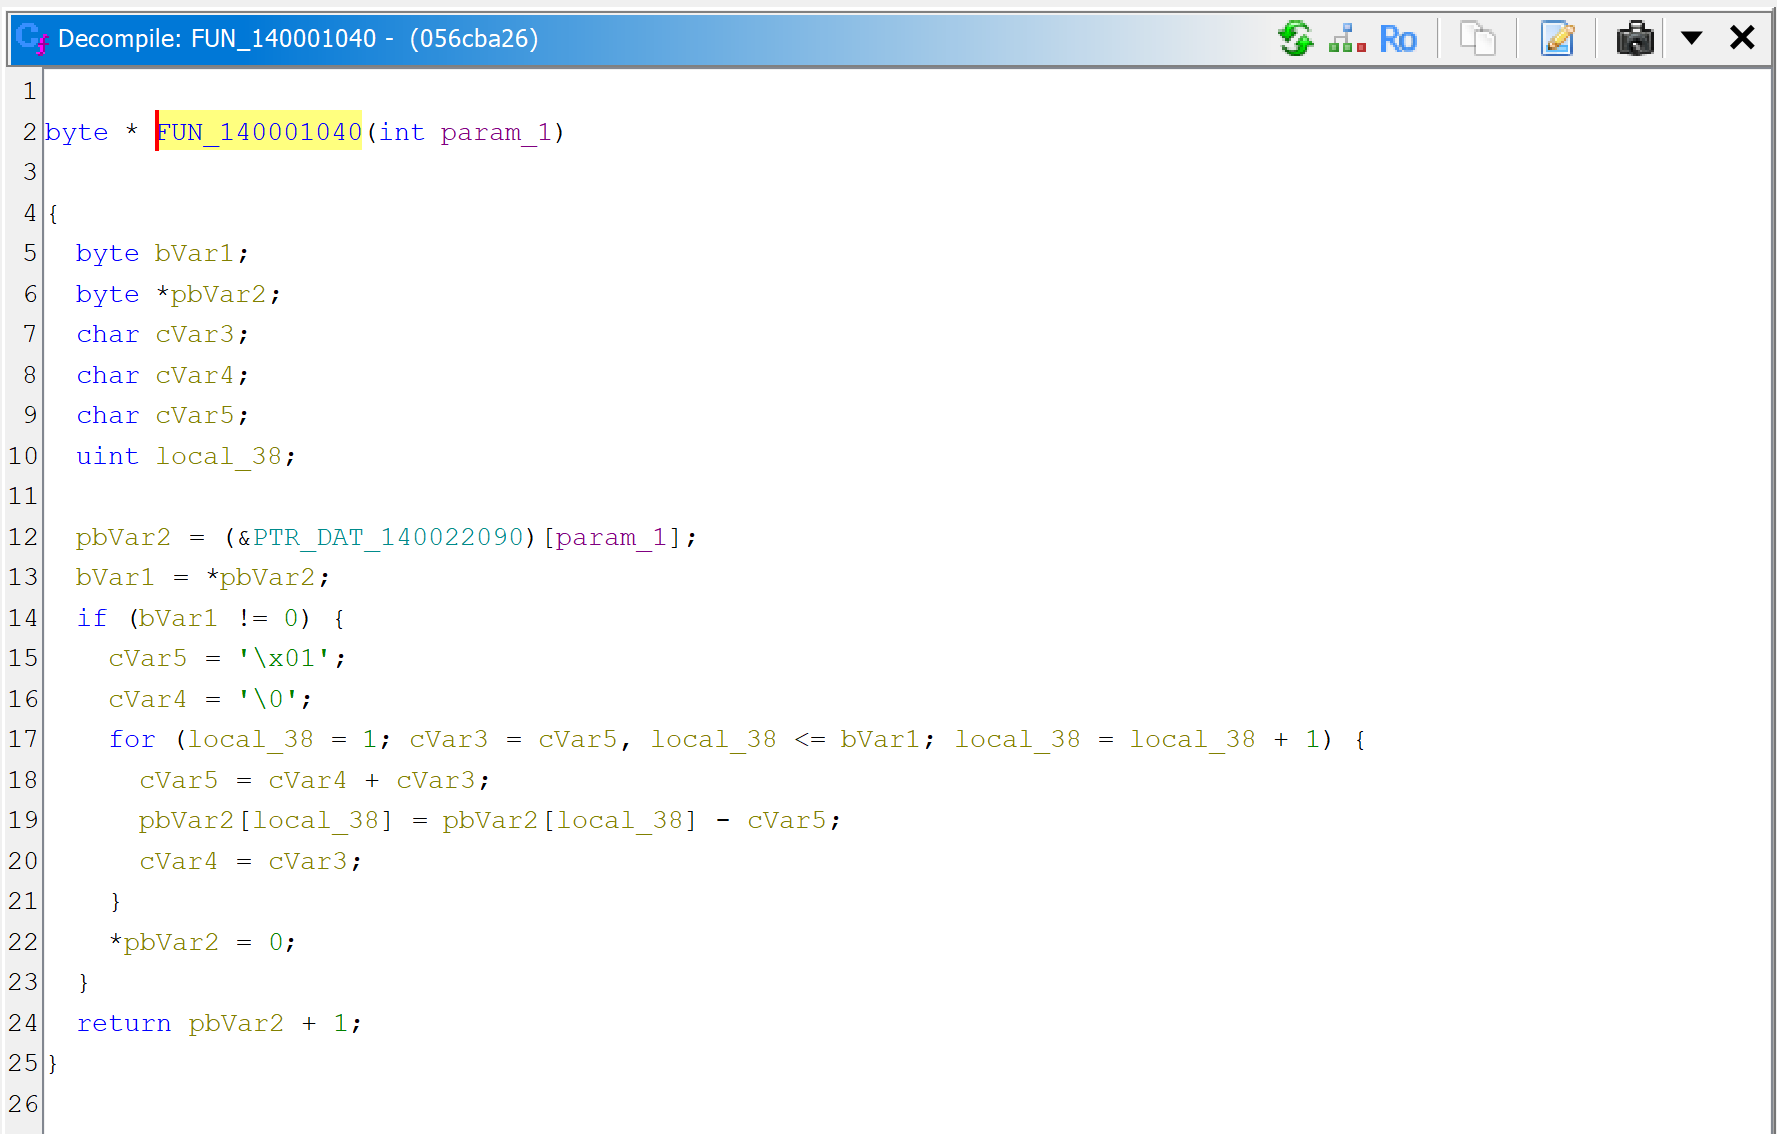
What is sub_140001040 anyway? Let’s navigate to the routine in the disassembly and decompile it.
A raw decompilation of the decryptor code, sub_140001040
After examination of the code, we can adjust things slightly:
The global gvar_140022090 is an array of PCHAR (double-click on the item; rename it with N; change the type to a PCHAR using Y; create an array from that using the * key).
The prototype is really PCHAR(int), we can adjust that with Y.
The first byte of an entry into encrypted_strings is the number of encrypted bytes remaining in the string; if 0, it is fully decrypted and subsequent calls will not attempt to decrypt bytes again.
The key variable is v3 is the key; let’s rename it with N. Note that the key at (i) is the sum of the previous two keys used by indices (i-1), (i-2); the initial tuple is (0, 1). This looks like a Fibonacci sequence.1
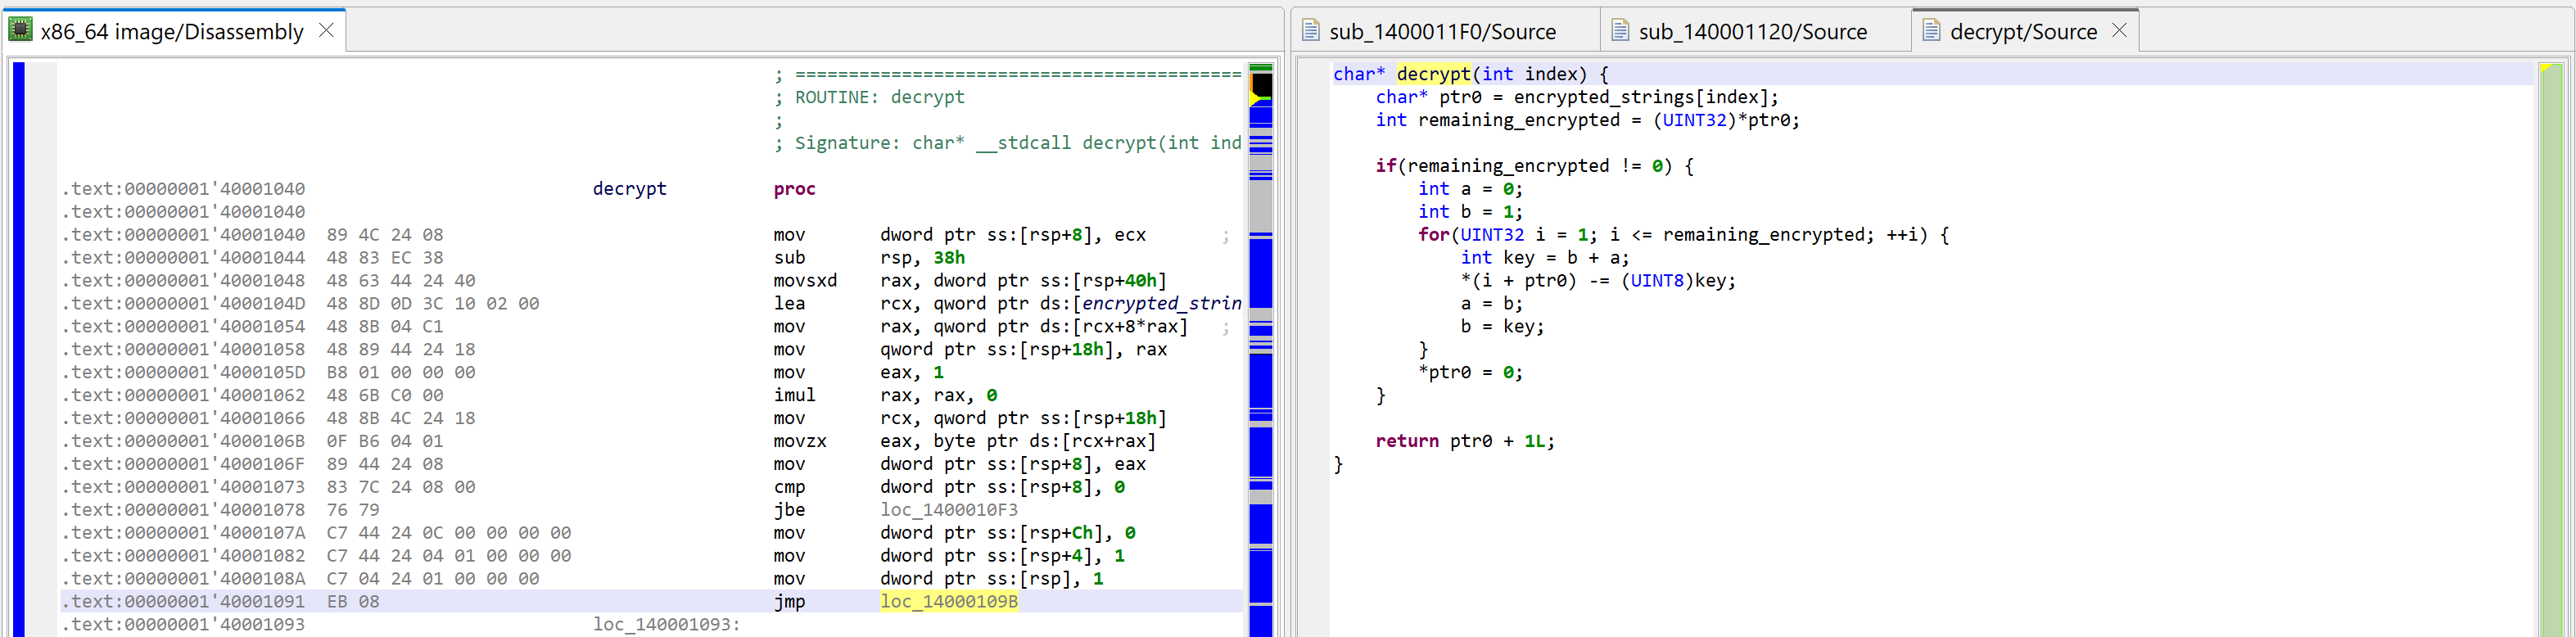
The decryptor (sub_140001040) after analysis.
Comparison with GHIDRA
For comparison sake, here are GHIDRA 11 decompilations.
The caller (sub_1400011F0) decompiled by GHIDRA 11.0.The decryptor (sub_140001040) decompiled by GHIDRA 11.0.The CreateProcess wrapper (sub_140001120) decompiled by GHIDRA 11.0. Notice that the low-level structure initialization code adds quite a bit of confusion.
Conclusion
JEB decompilers2 do their best to clean-up and restore code, and that includes decrypting strings when it is deemed reasonable and safe.
That concludes our second entry in this “How to use JEB” series. In the next episodes, we will look at other features and how to write interesting IR and AST plugins to help us further deobfuscate and beautify decompiled code.
As always, thank you for your support, and happy new year 2024 to All 😊 – Nicolas
–
Interestingly, the JEB assistant (call it with the BACKTICK key, or menu: Action, Request Assistant…) would like to rename this method to “fibonacci_sequence“! Not quite it, but that’s a relevant hint!) ↩
Note the plural: dexdec – the Dex decompiler – has had string auto-decryption via emulation for a while; its users are well-accustomed to seeing dark-pink strings in deobfuscated code! ↩
We’re kicking off a malware analysis series explaining how to use JEB Decompiler to perform reverse engineering tasks ranging from out-of-the-box actions to complex use cases requiring scripts or custom plugins.
In this first entry, we look at a Windows malware compiled for x86 32-bit targets. The malware is an Ethereum cryptocurrency stealer. It monitors and intercepts clipboard activity to find and replace wallet addresses by an address of its own — presumably, one controlled by the malware authors to collect stolen ether.
Quick look at the malware
The file has a size of 81Kb, is compiled for x86 platforms. Although it does not appear to be packed, most metadata elements of the PE header were scraped. There is no rich data or timestamp.
If you are familiar with JEB, its terminology, and the organization of its UI elements, you may skip the next section and go directly to “Examining the code”.
Opening the file in JEB
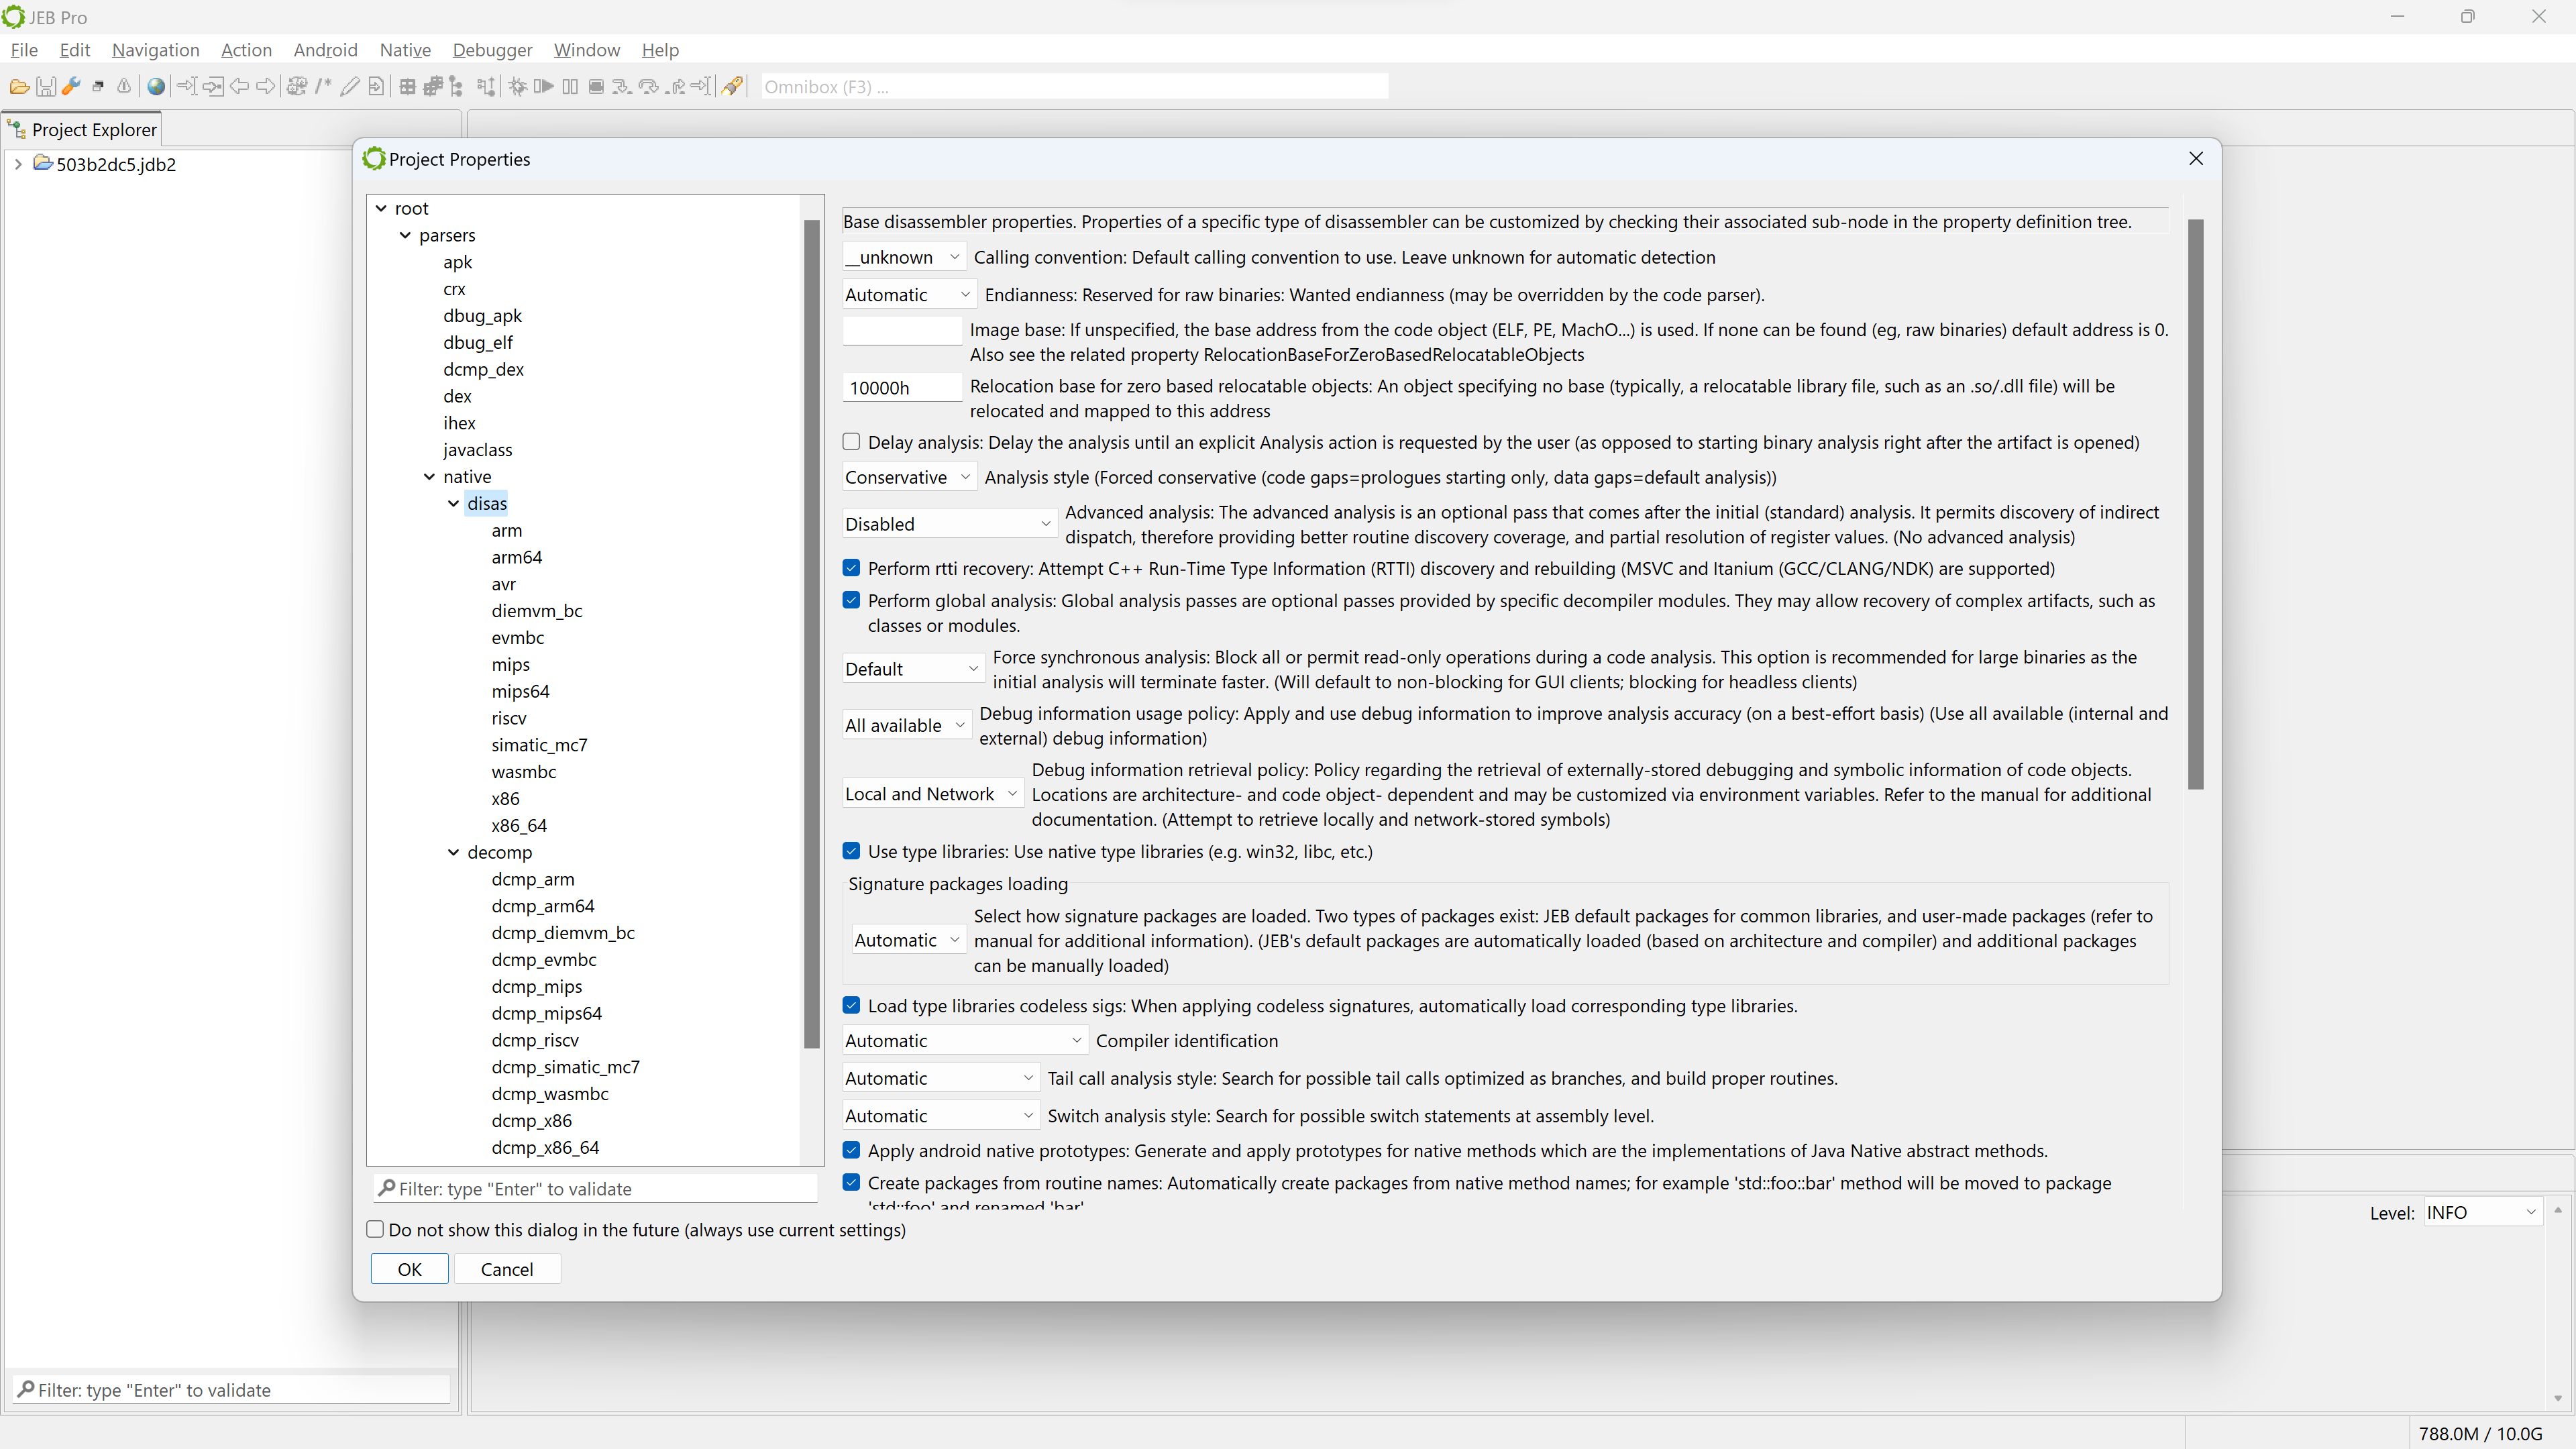
Let’s fire up JEB. Any recent build (5.7+) with the x86 analysis modules and decompiler will do, i.e. JEB Community Edition or JEB Pro.
We open the file and keep the default settingsA view of the GUI after the initial analysis (from top-left, clockwise: project explorer, main workspace, and code hierarchy)
Project and units
The top-left view shows the project, along with a single artifact (the input file) and the analysis units created by JEB:
The artifact file has a blue-round icon
The top-level unit is a winpe unit
It has one child unit at the moment, named “x86 image”, of type x86.
The bottom-left view shows a list of code routines resulting from the analysis of the file.
Disassembly
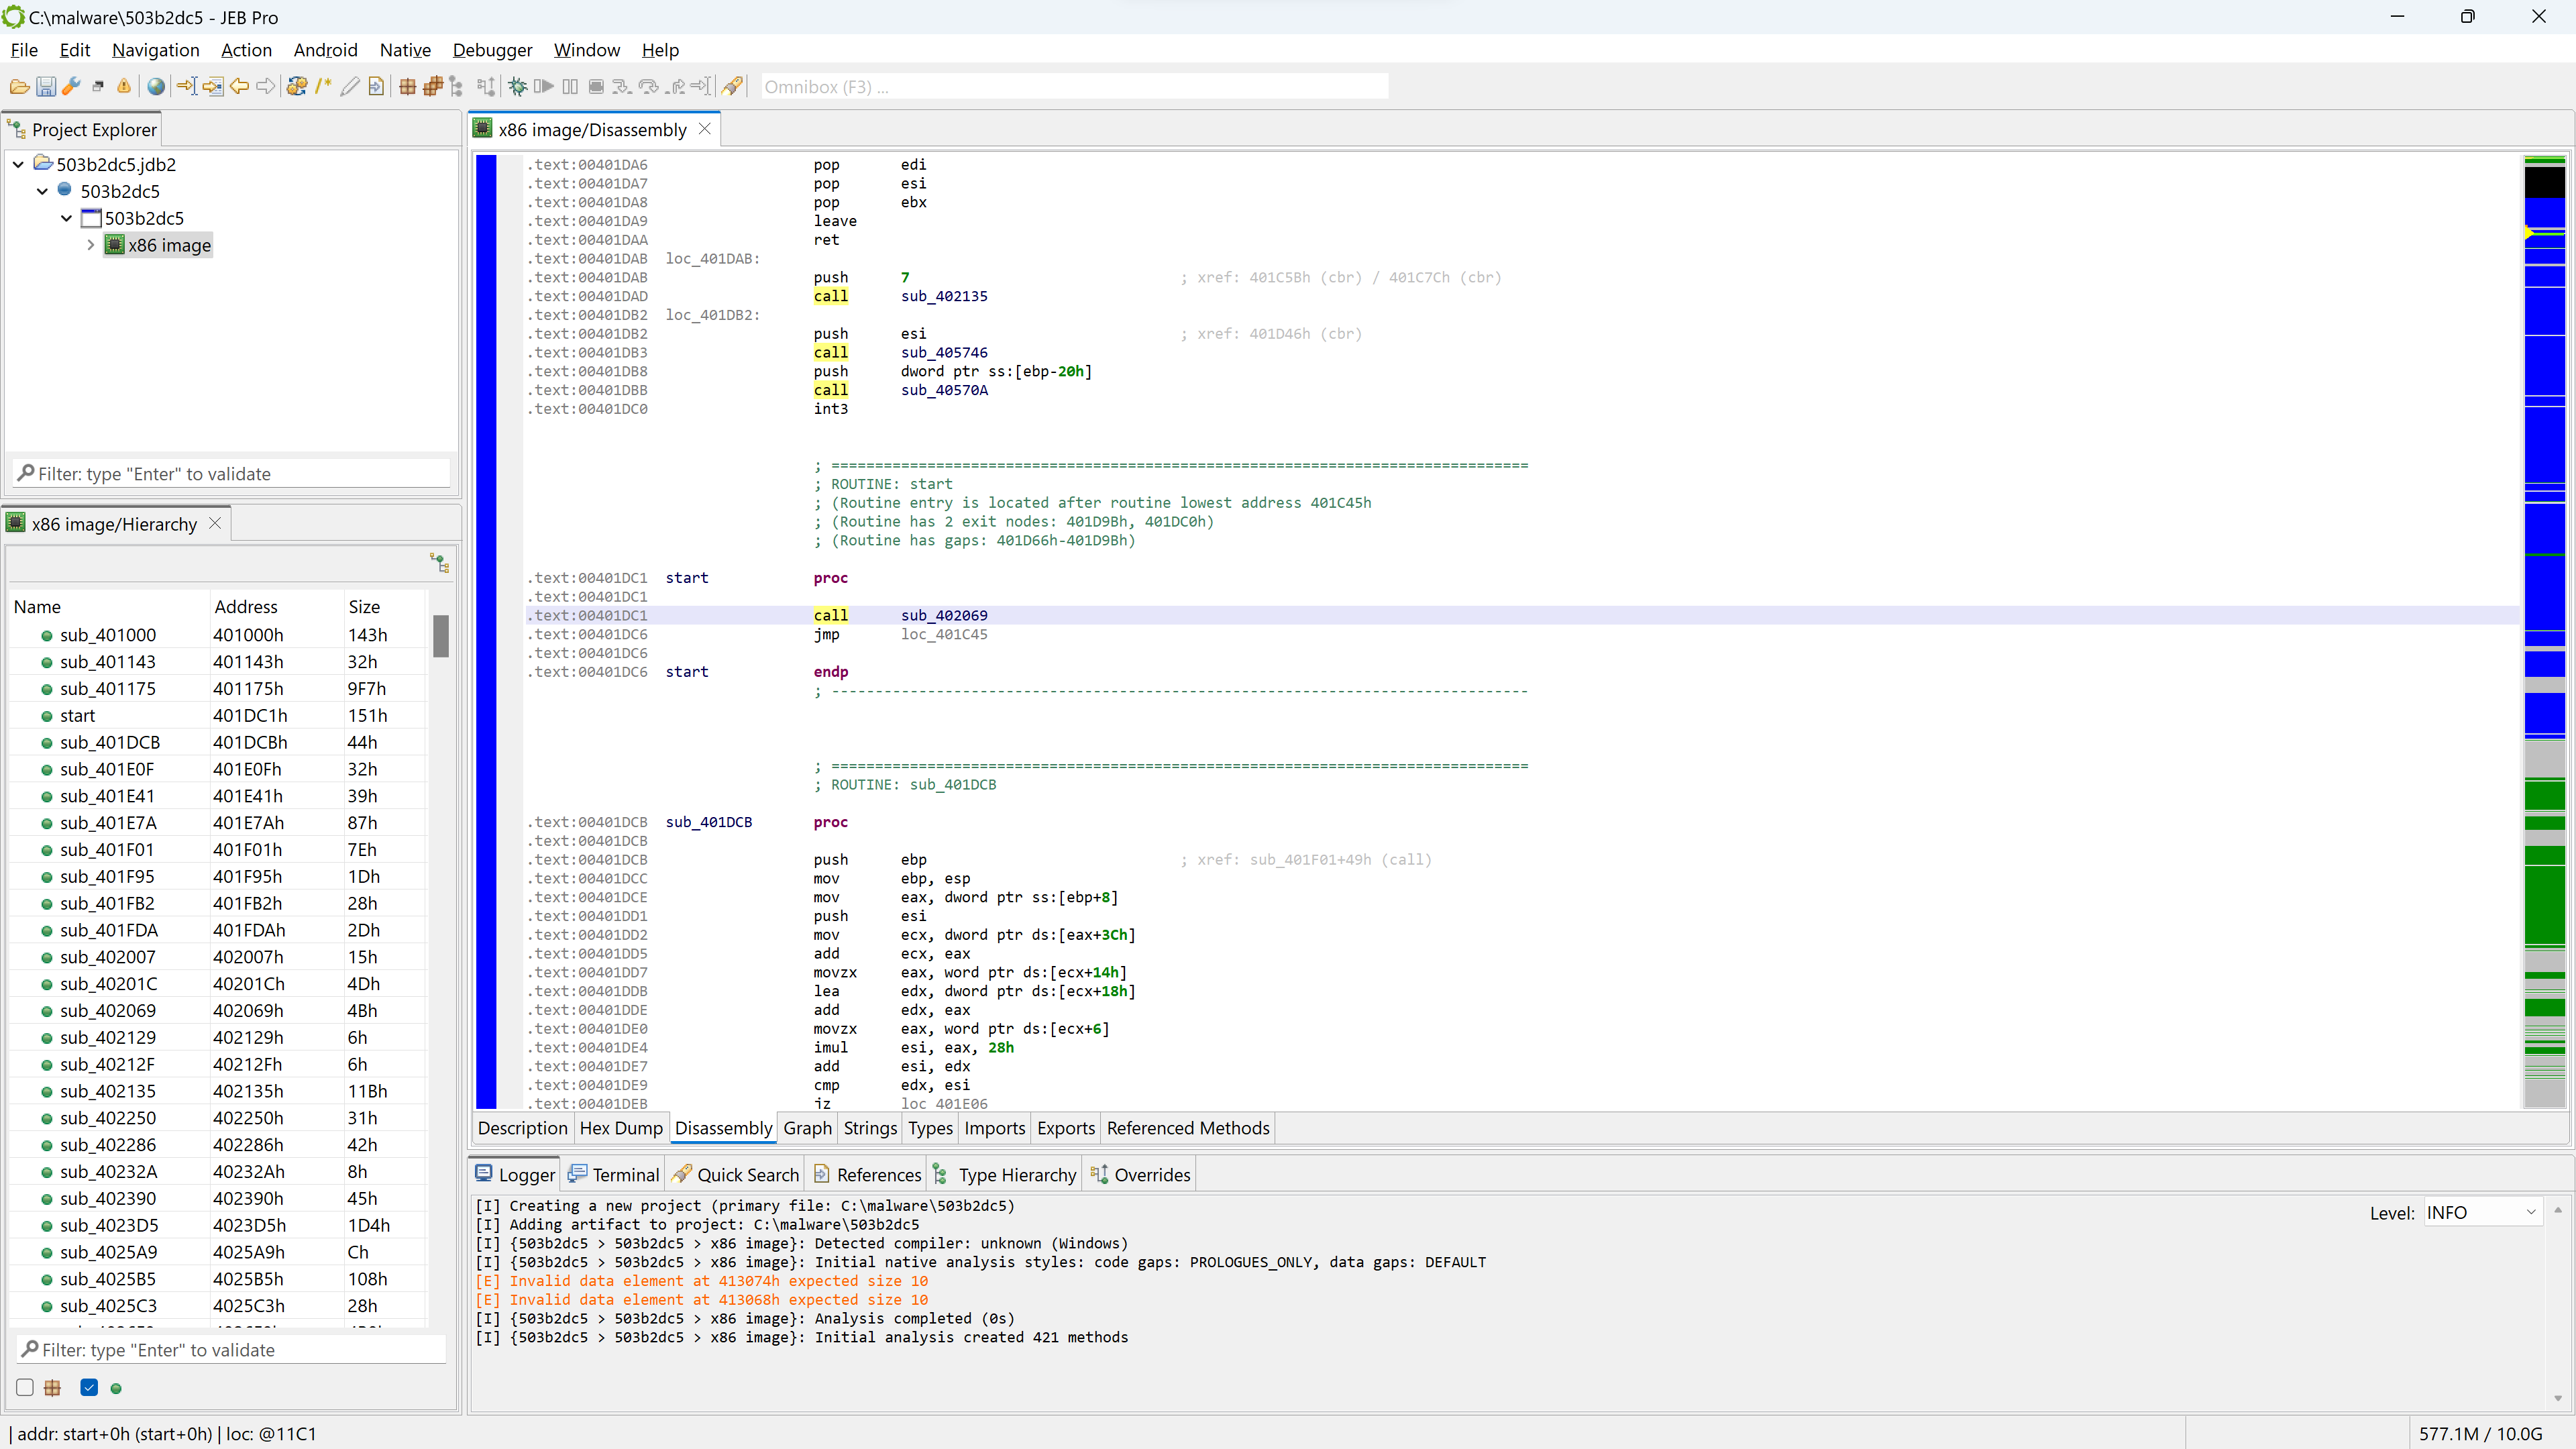
By default, the main panel shows the disassembly window.
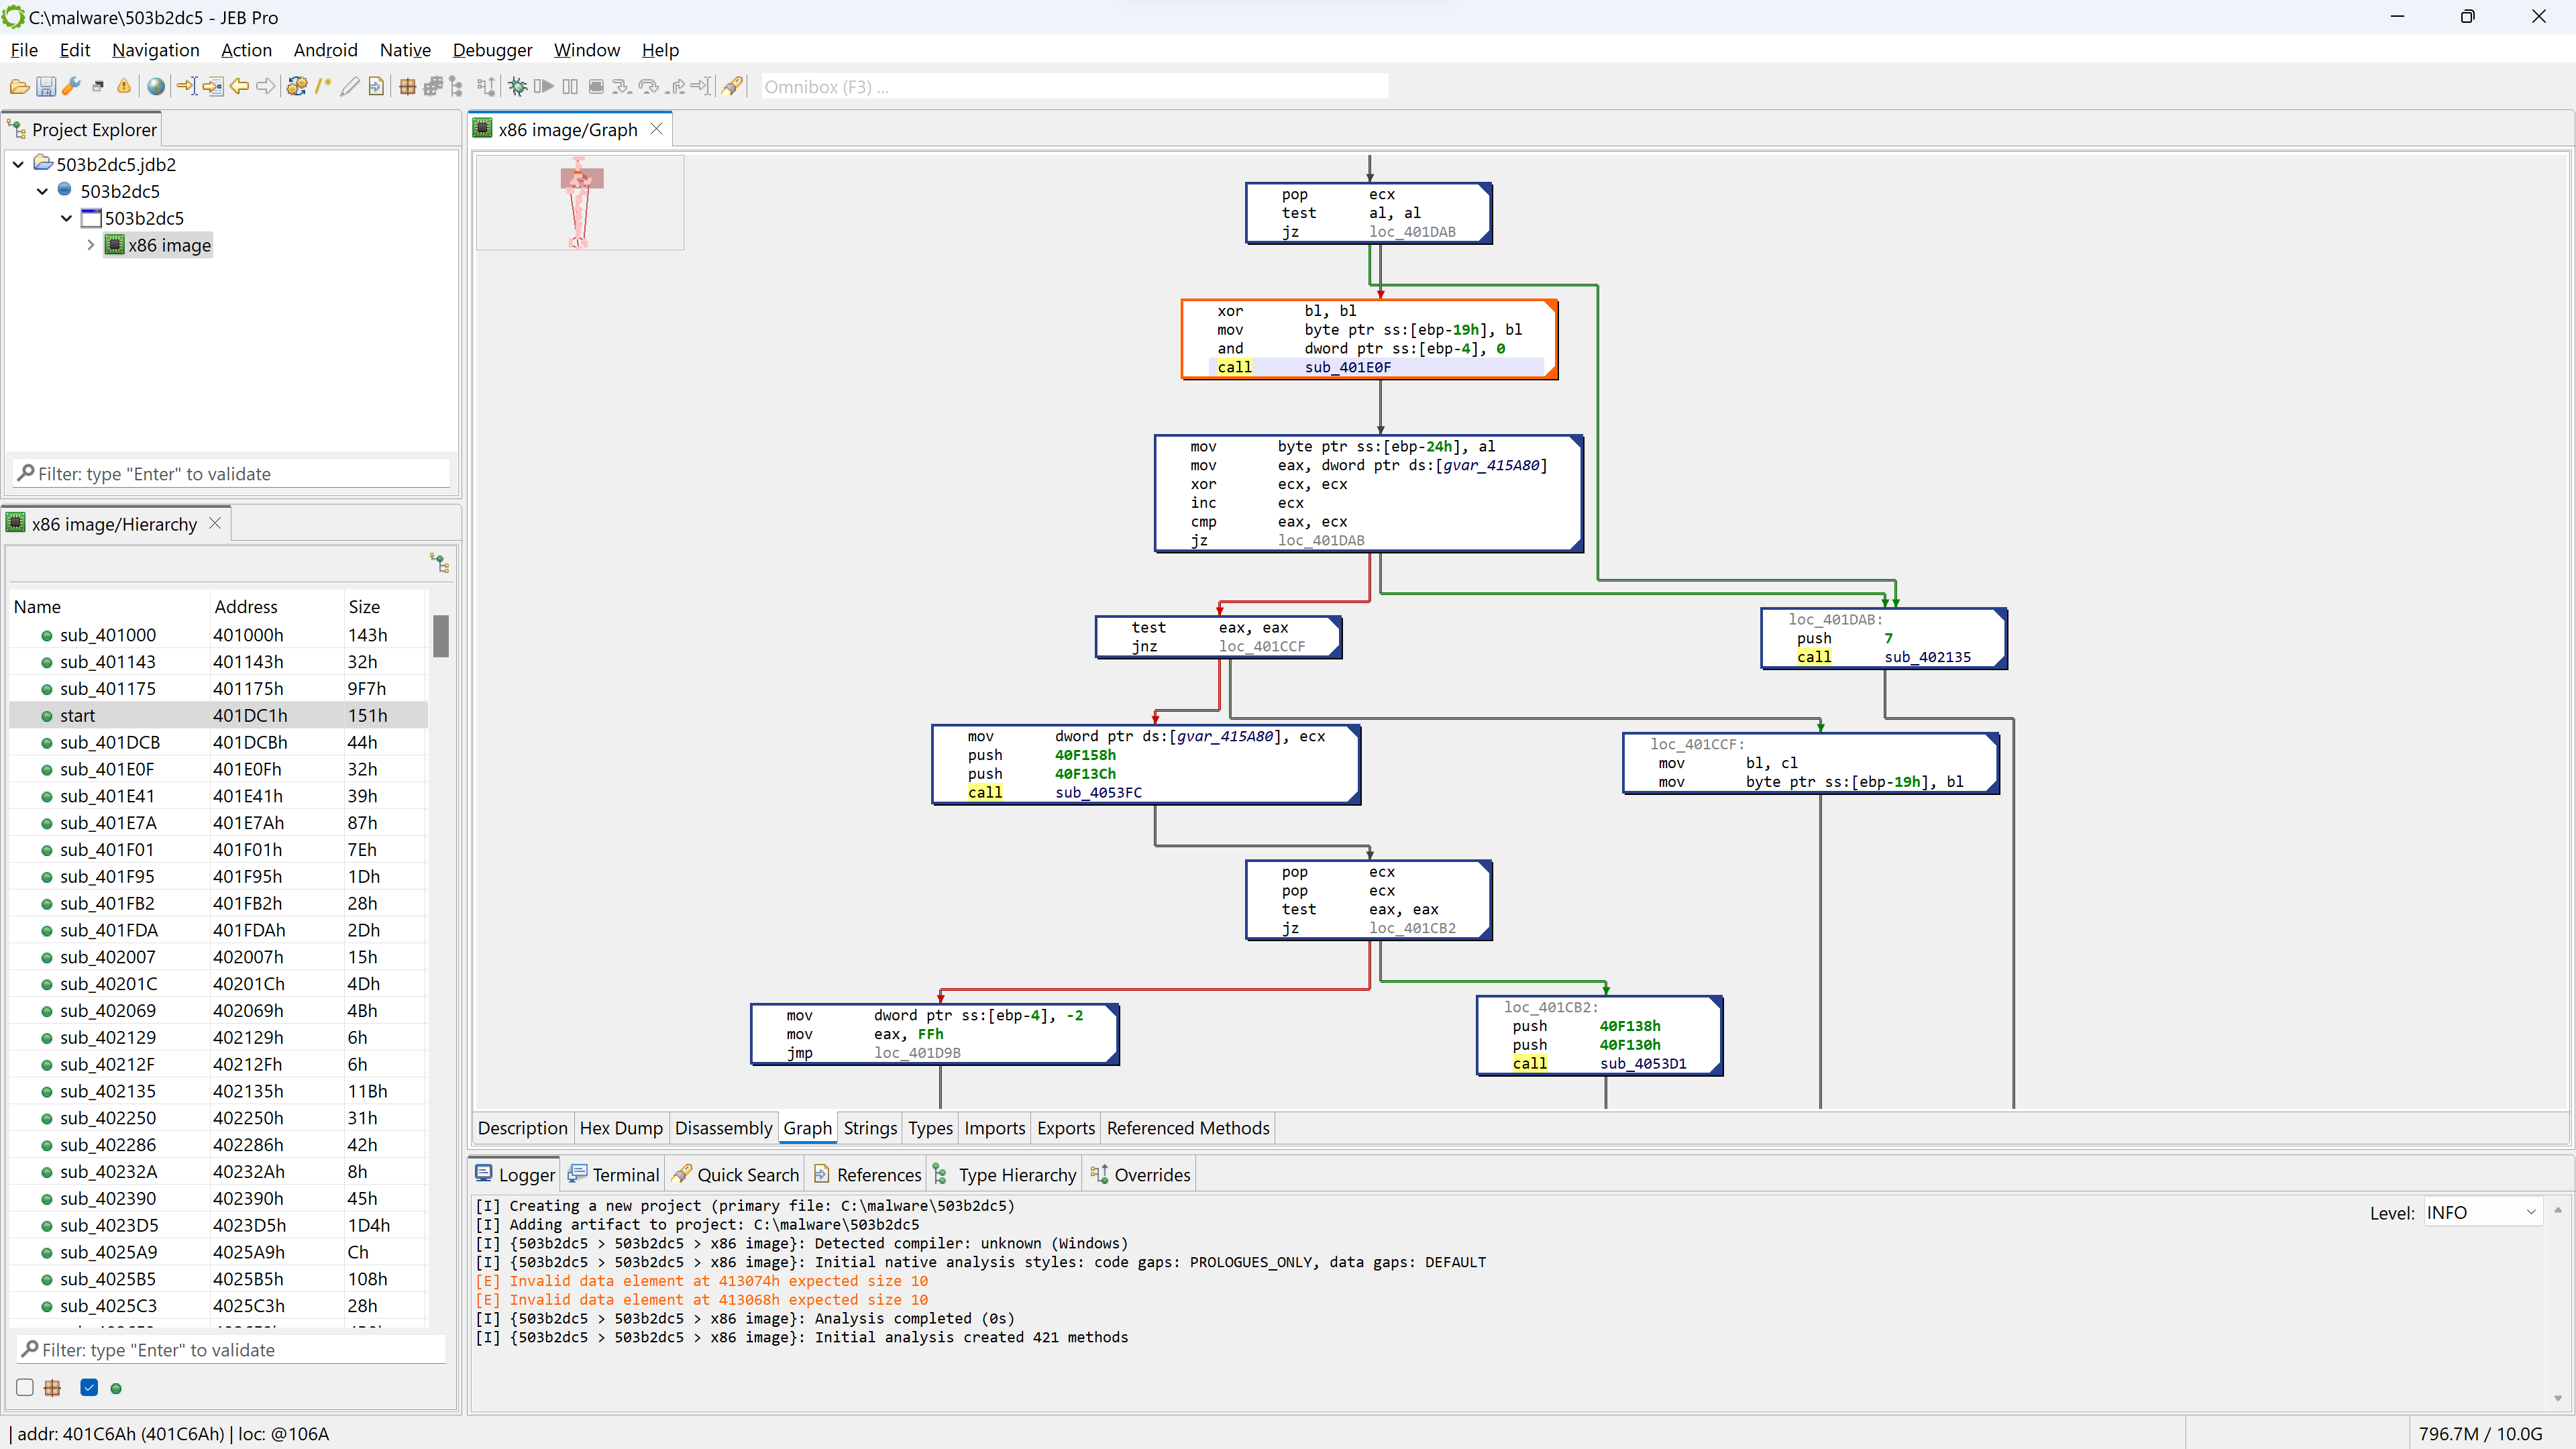
You may press the SPACE bar to switch to a graph view of the code (menu: Action, Graph…). In the graph view, only a single method is rendered at a time.
CFG (control flow graph) view of a disassembled routine
PE unit
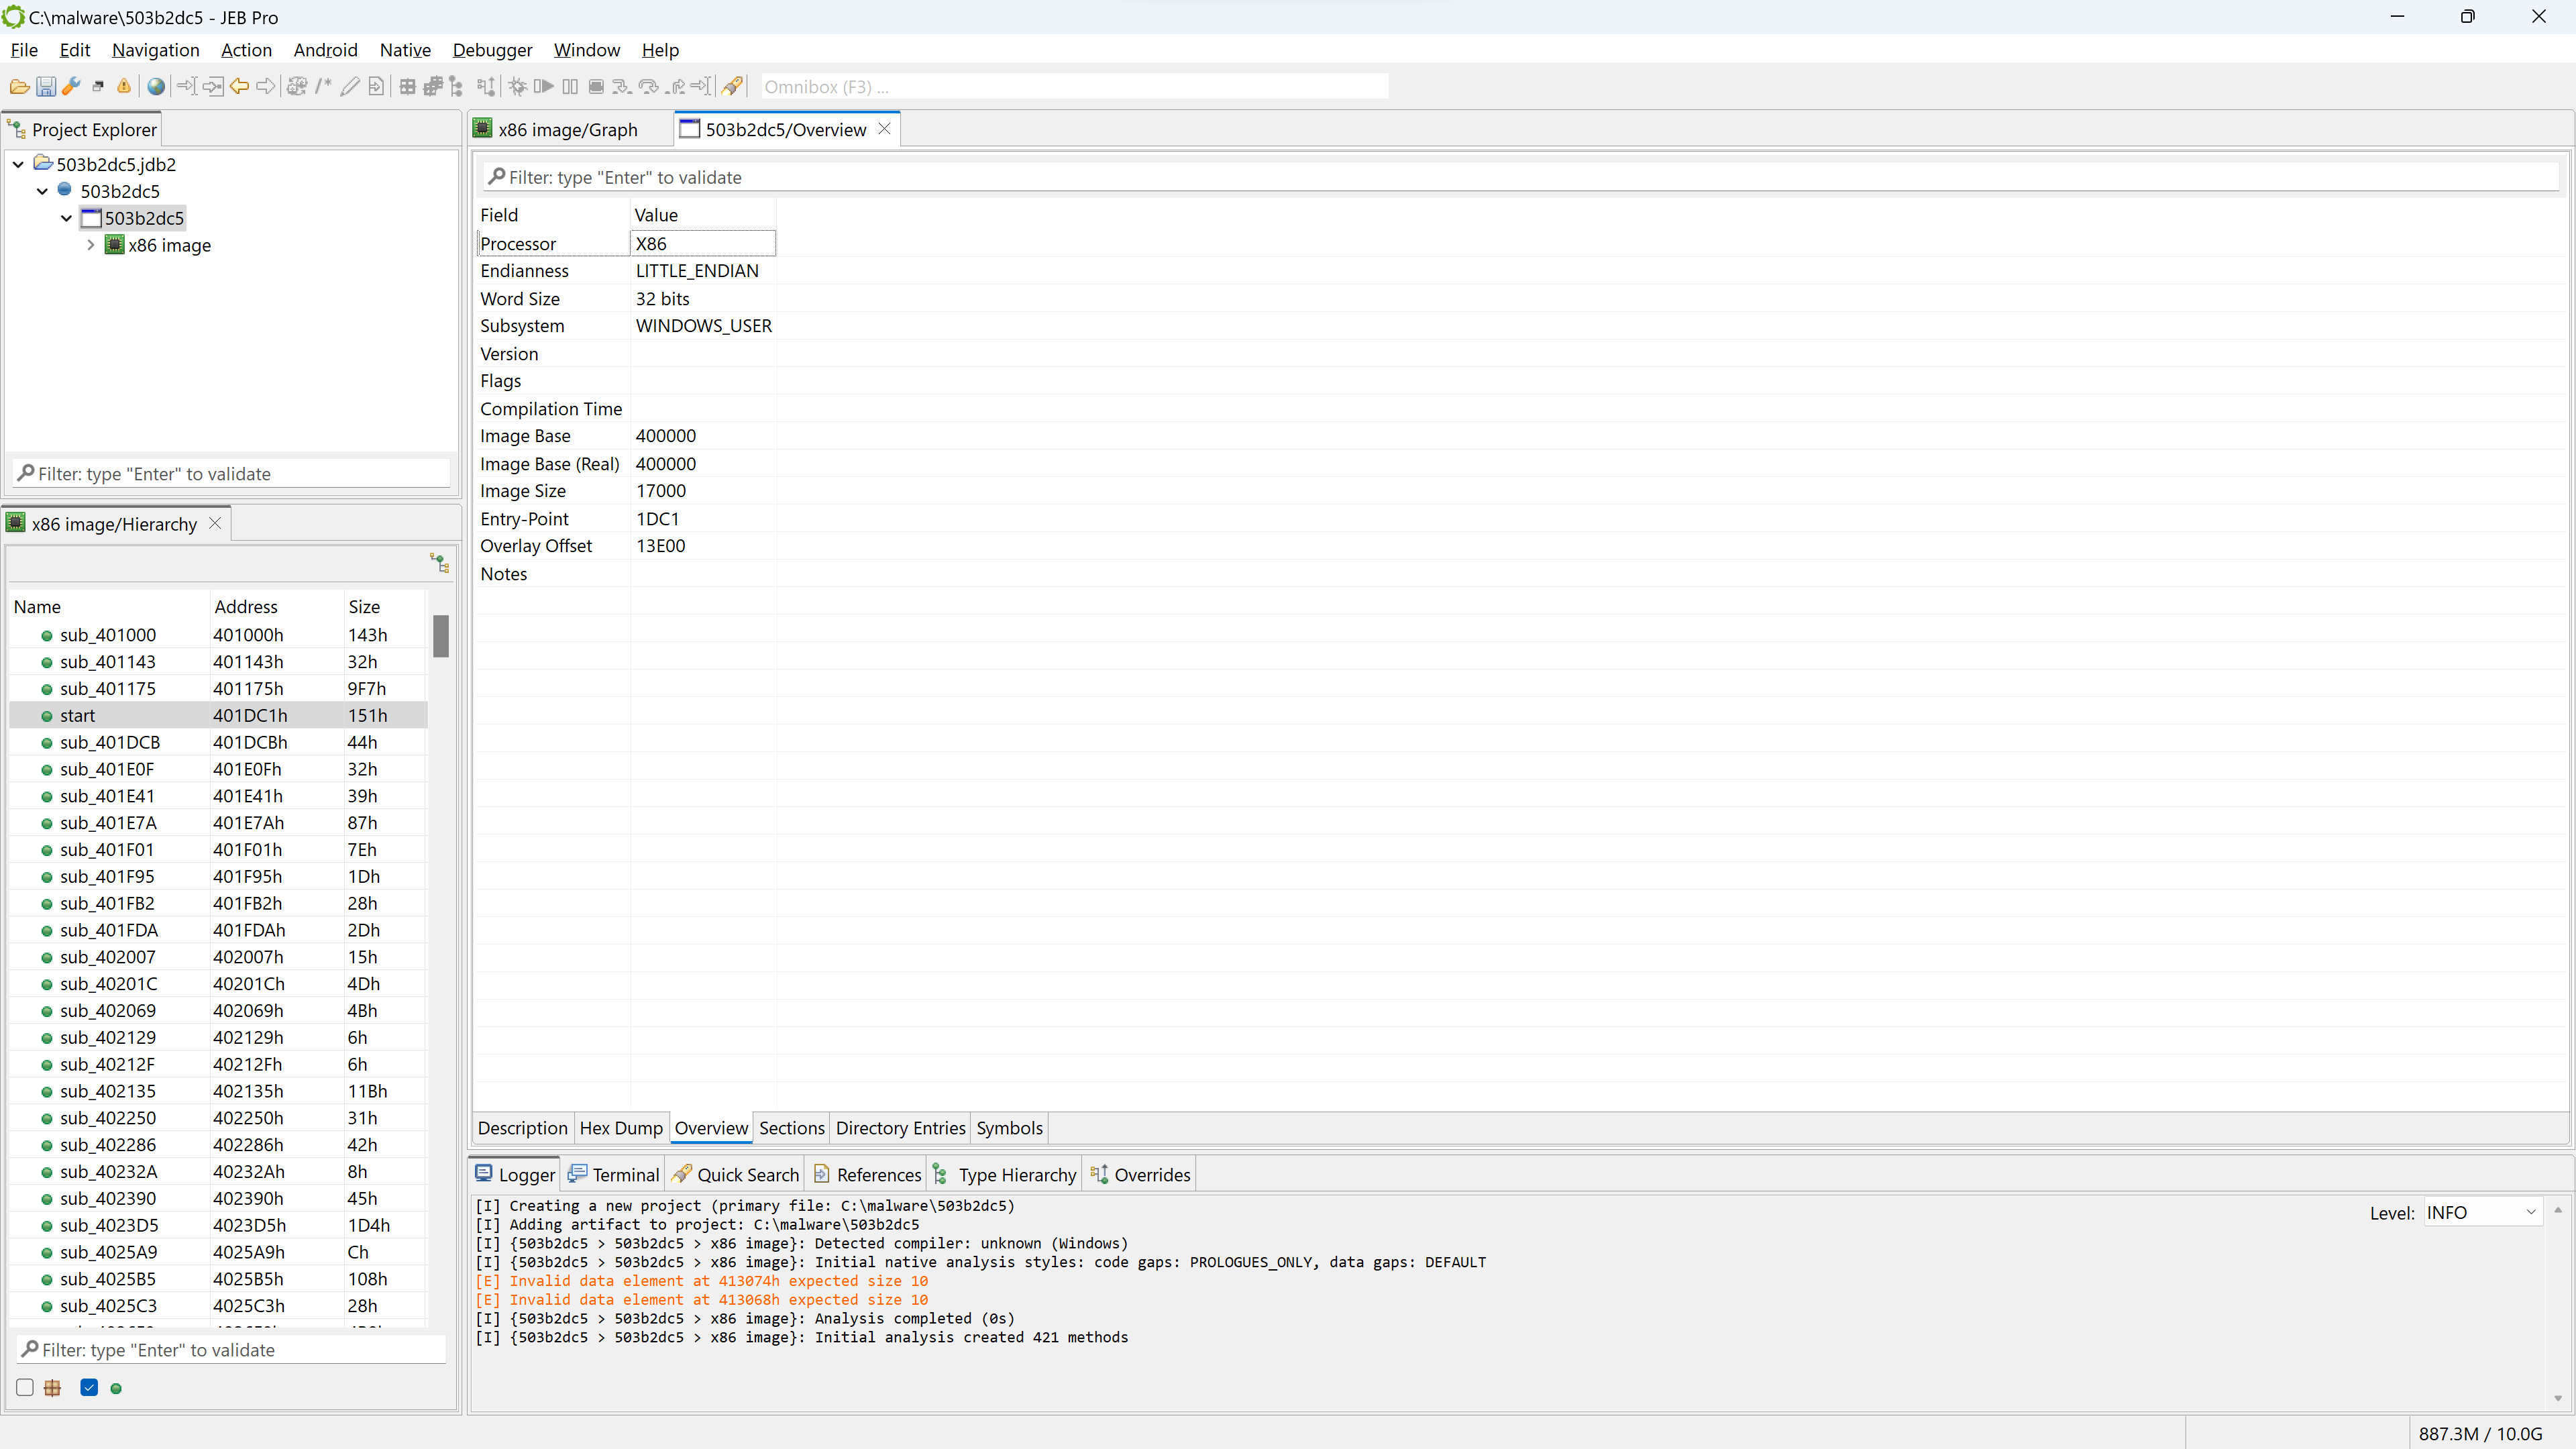
If you wish to have a look at the PE file in more details, open the winpe unit. Double-click the corresponding node in the project hierarchy.
View of a winpe unit’s “Overview” fragment
The winpe unit view provides several information, organized in fragments that can be seen below the unit view: Description, Hex Dump, Overview (the default fragment), Sections, Directory Entries, Symbols, etc.
Note that if the PE had not been stripped, we would probably see a compilation timestamp as well as additional sub-units detailing the Rich Header data. For Windows executables, that data is important to perform fine-grained compiler identification.
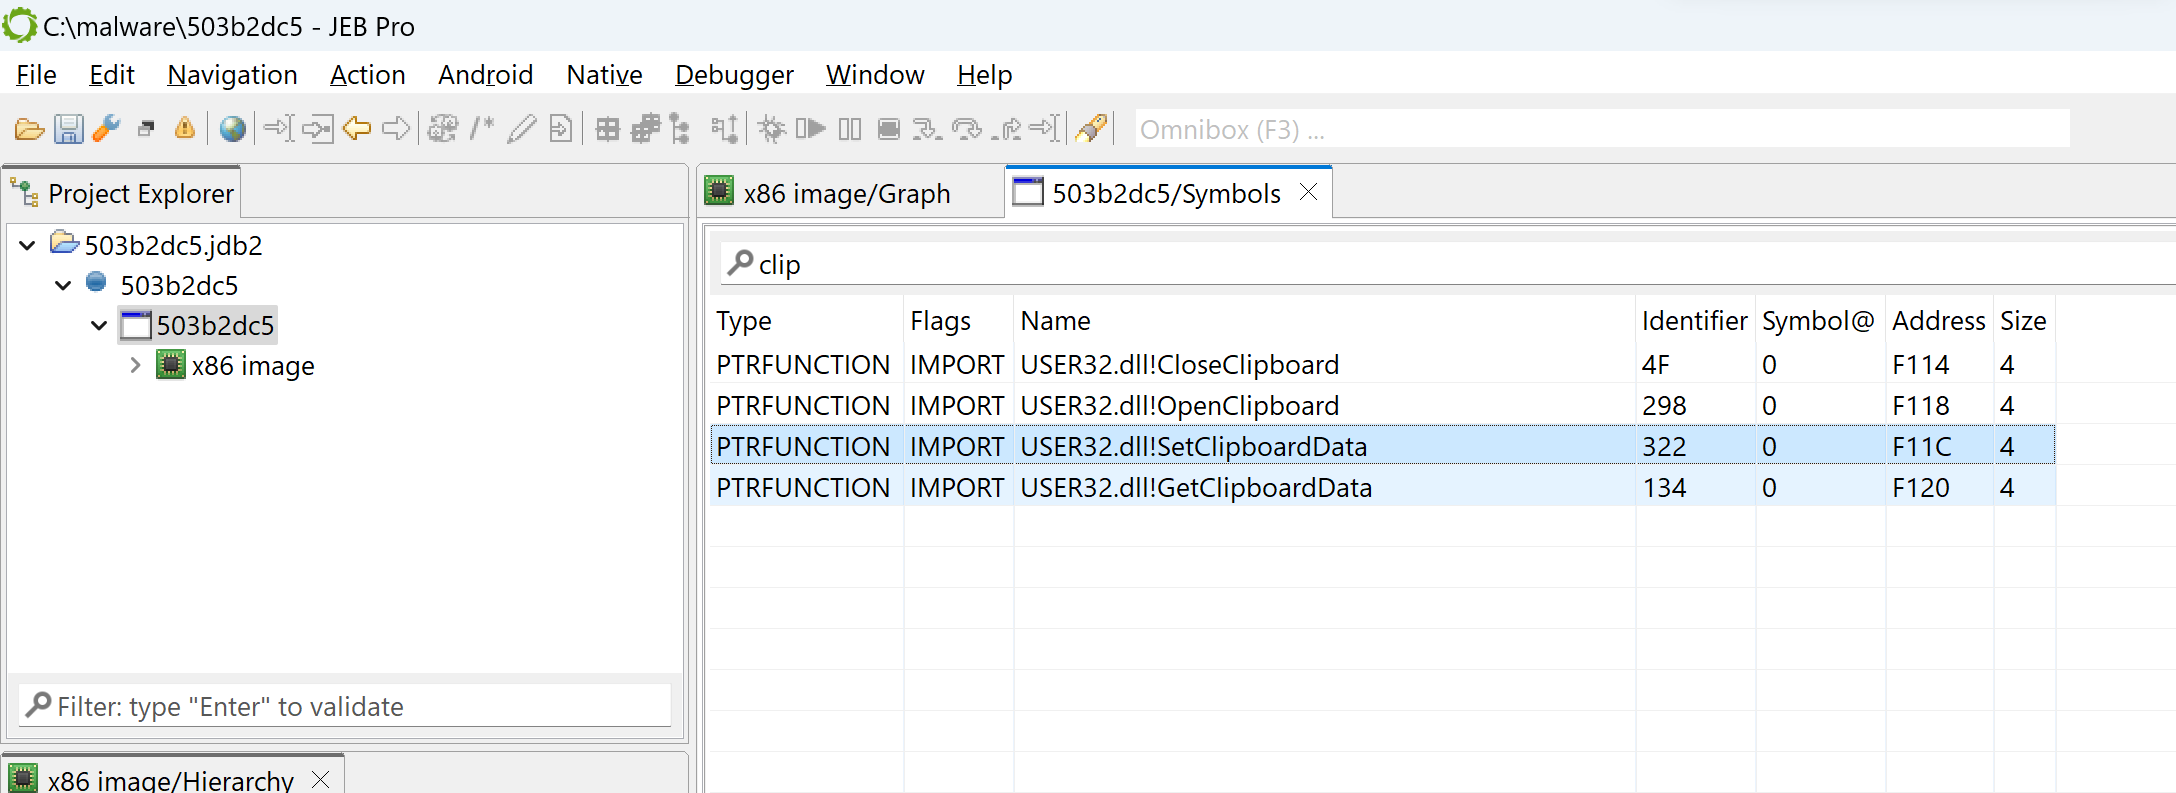
The Symbols tab lists all symbols advertised by the PE, including imported and exported routines. For example, if you filter on “clip”, you can see multiple win32 routines relating to clipboard access, such as OpenClipboard or SetClipboardData:
The Symbols fragment of the winpe unit view, with a filter applied (“clip”)
Examining the code
Let’s go back to the disassembly offered by the x86 unit. First, notice that the code hierarchy view does not seem to contain well-known methods (static code), typically standard library routines linked at compile-time.
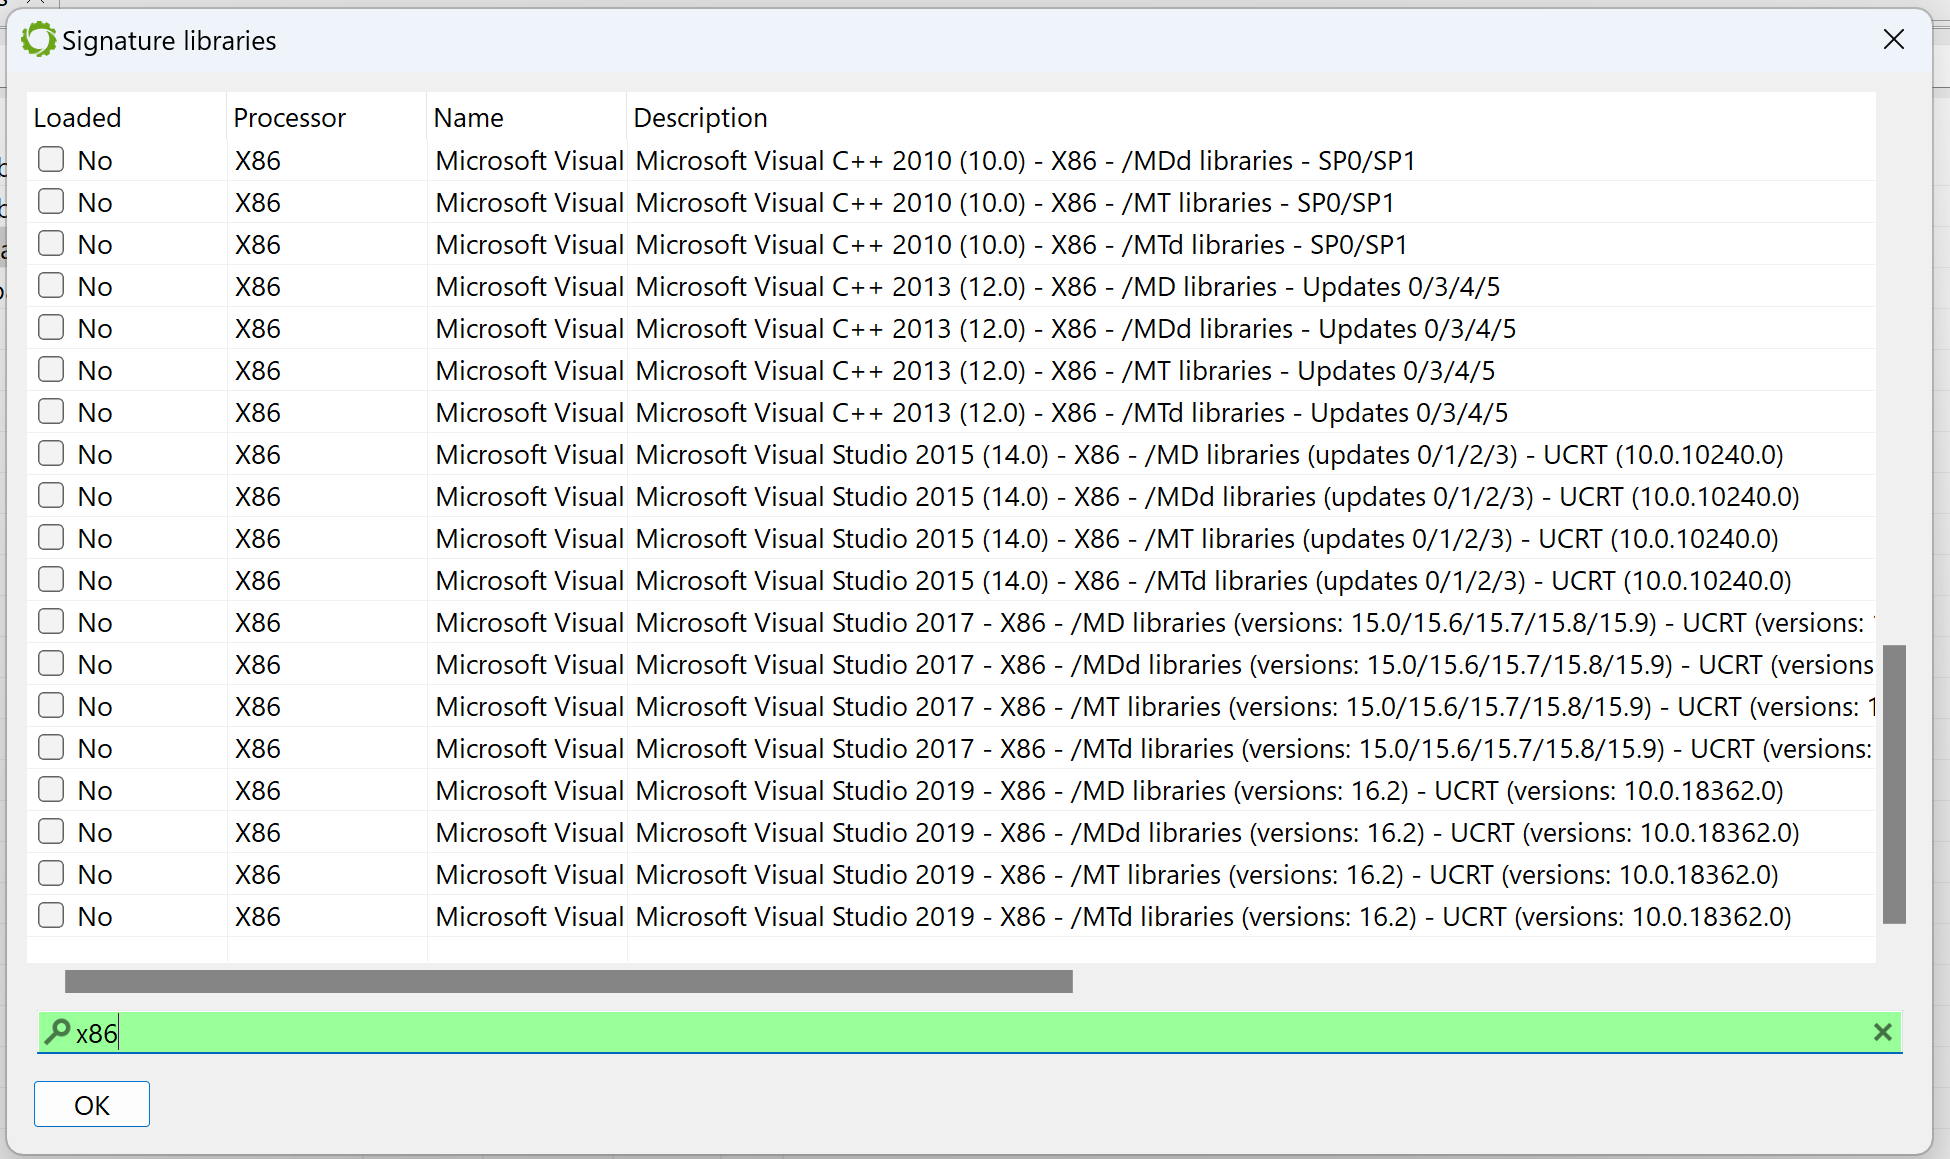
Let’s see why by looking at which siglibs (signature libraries) were applied during the initial analysis (menu: Native, Signature Libraries…). It looks like none were loaded:
The Signatures Libraries dialog
Library code identification
Normally, when JEB performs the initial auto-analysis of the code, compiler identification is used to determine whether well-known signature libraries of static code (siglibs) should be loaded and applied to the binary. In this case, compiler identification failed because all header data had been discarded. JEB decided to not load and apply signatures.
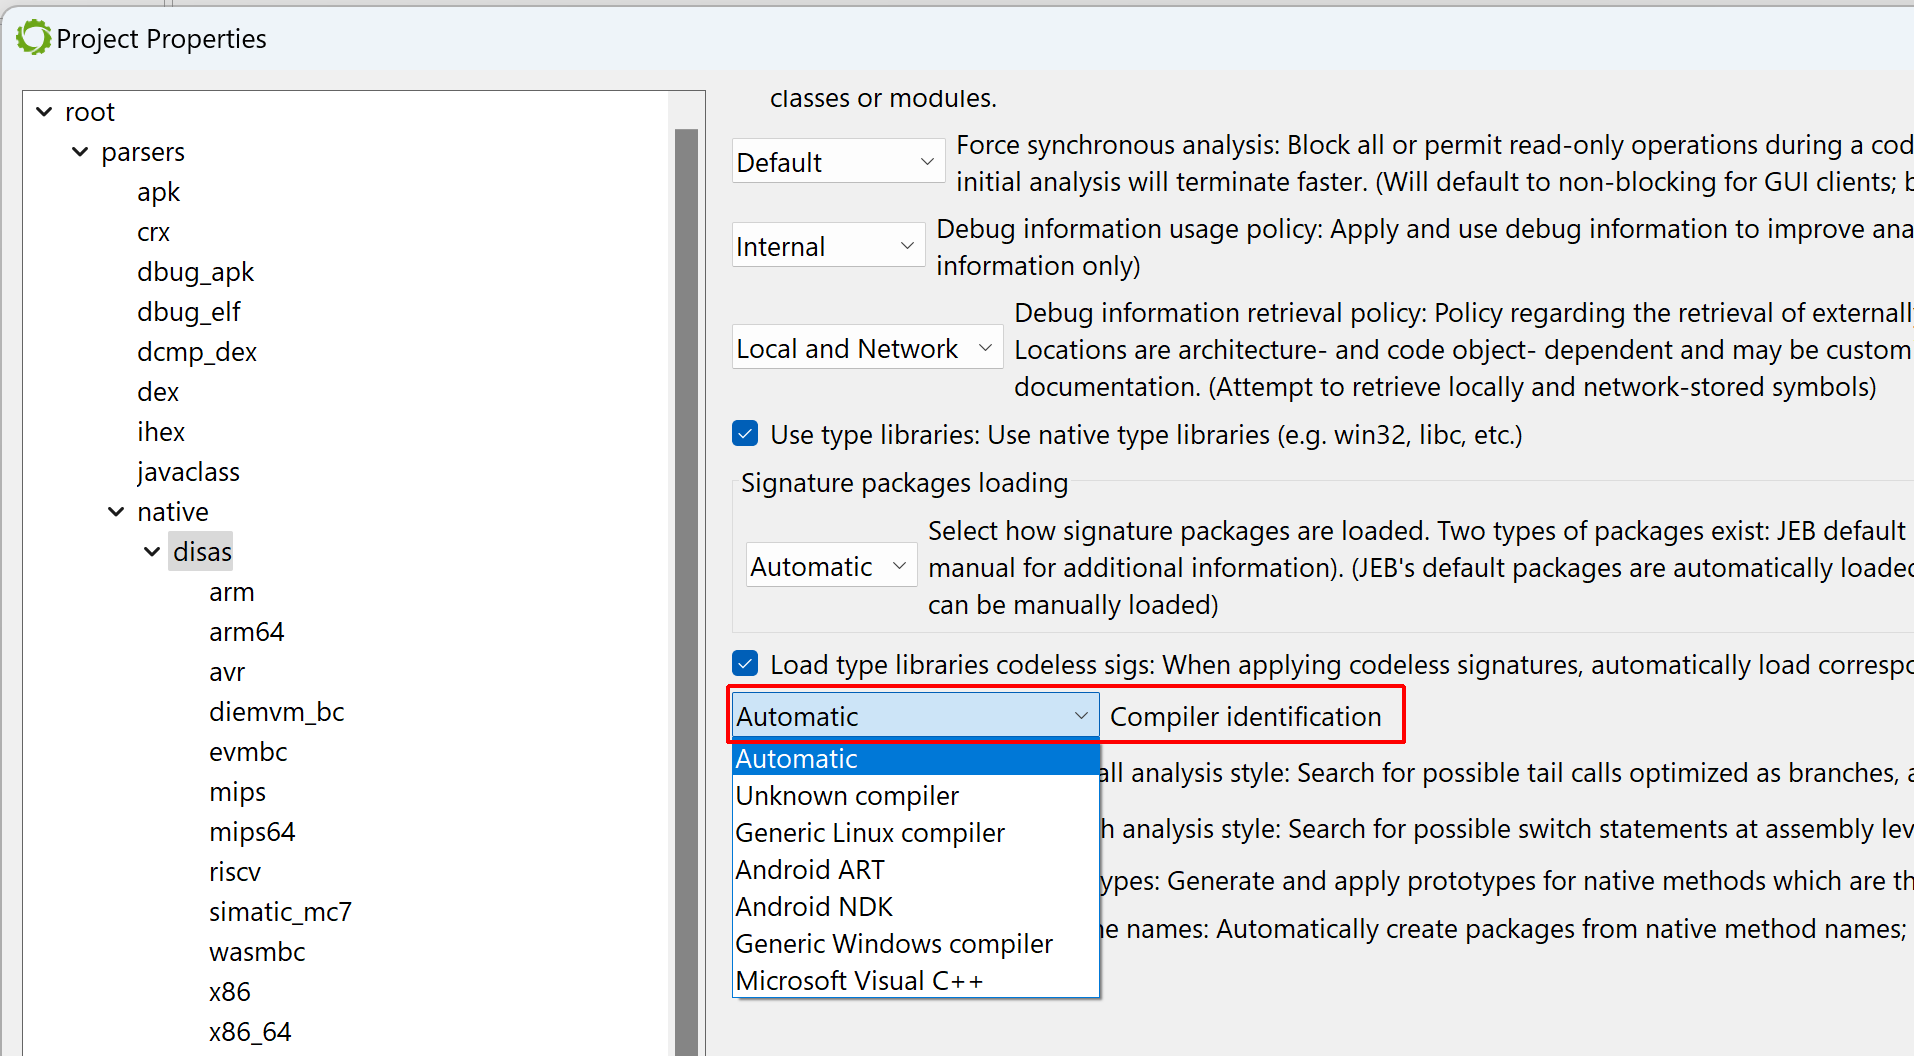
To apply them manually, tick the “MSVC x86” boxes. (An alternative is to let JEB know that the file was compiled with MSVC before the analysis starts: when opening the artifact, when the Options panel is displayed, the user may decide to force the compiler to a set-value.)
Forcing a compiler setting before the initial analysis
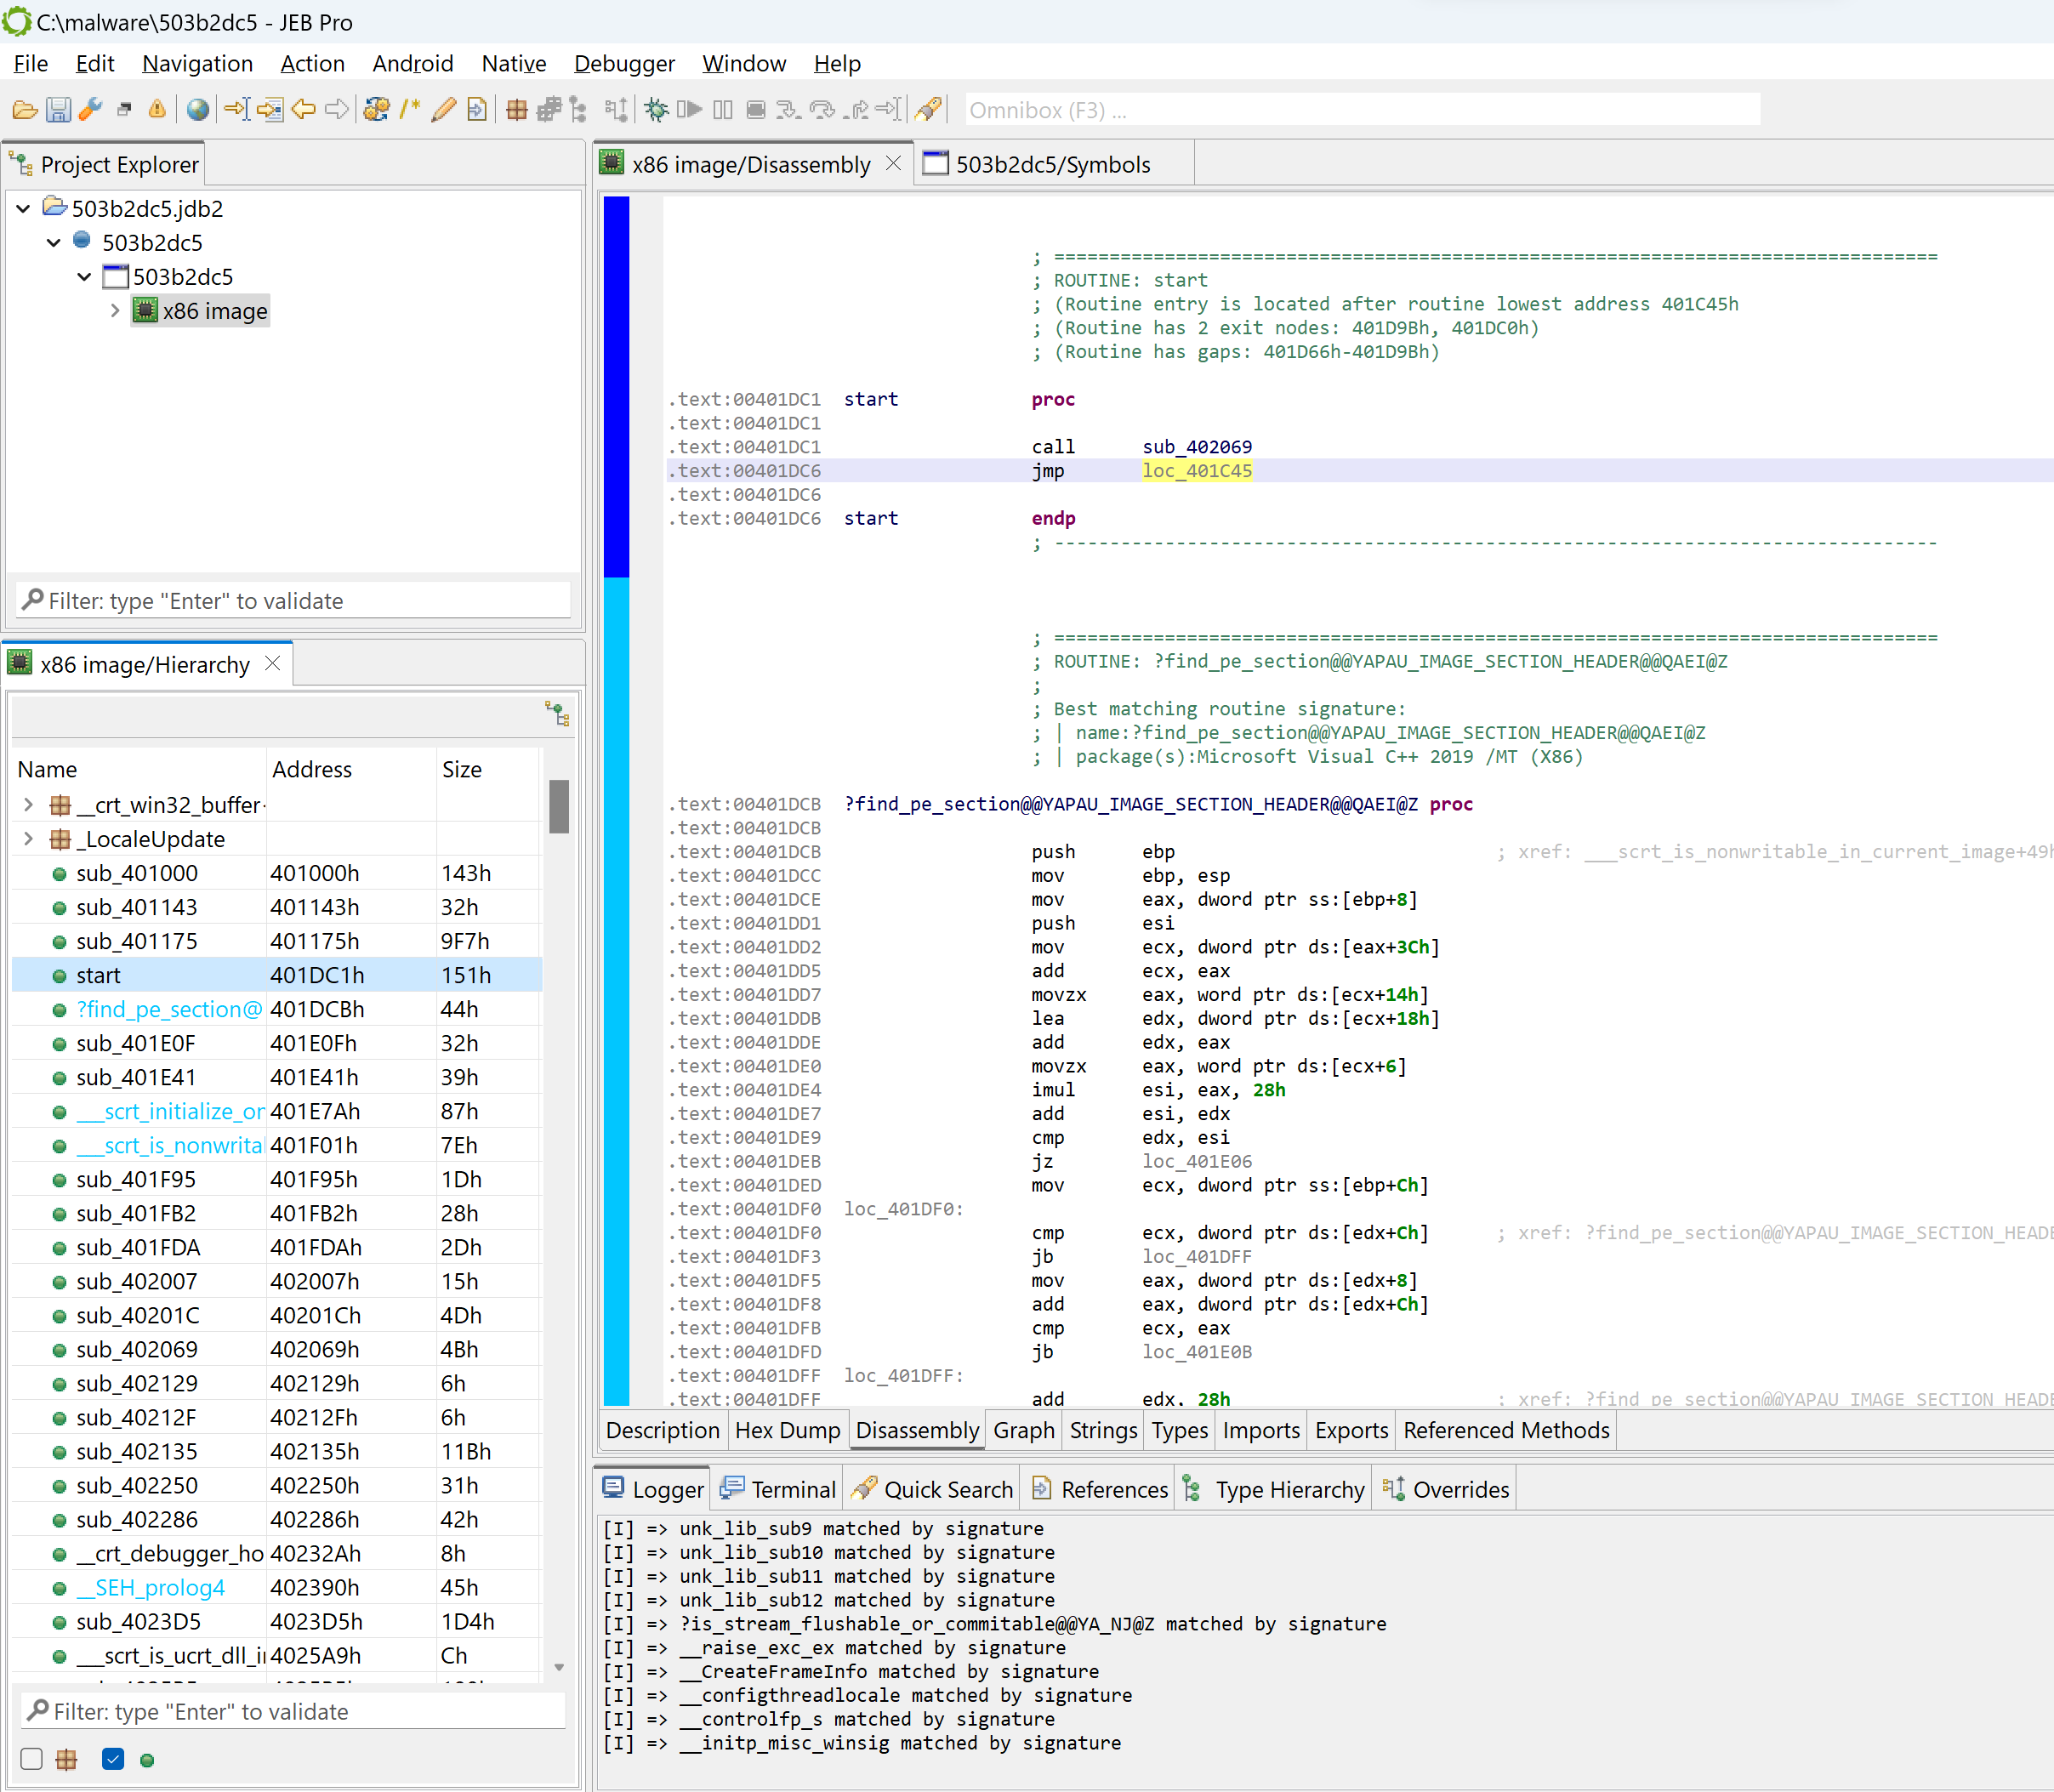
After doing either of the above ((a) file re-analysis with a compiler identification pre-set; or (b) manual siglibs application), several methods are identified as MSVC code:
Light-blue areas mean the code was matched against well-known signatures
Entry-point and WinMain
Navigate to the executable entry-point (menu: Native, Go to entry-point…).
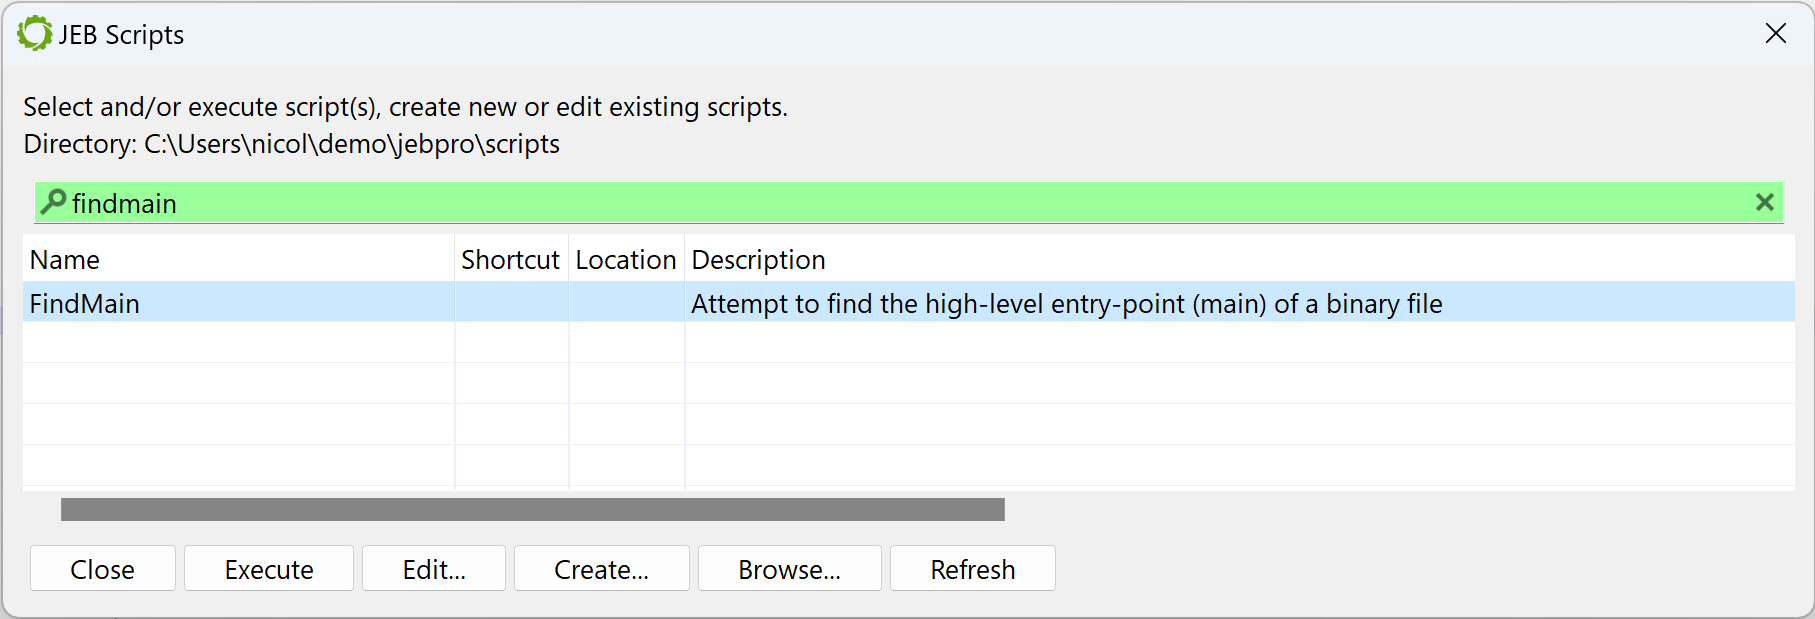
In the general case, the entry-point of a Windows PE compiled with MSVC is not the high-level entry-point that will contain meaningful code. Although it is relatively easy to find WinMain with a bit of experience, there is a JEB script to help you as well, FindMain.py (available in the samples-script folder, also available on GitHub). Open up the script selector with F2 (menu: File, Scripts, Script selector…).
Run a JEB Python script inside the GUI client
Select the desired script and execute it. The result is displayed in the console:
...
Found high-level entry-point at 0x401175 (branched from 0x401D38)
Renaming entry-point to 'winmain'
...
The code at 0x401175 was auto-renamed to winmain (menu: Action, Rename…).
Initial decompilation
Let’s decompile that method by pressing the TAB key (menu: Action, Decompile…).
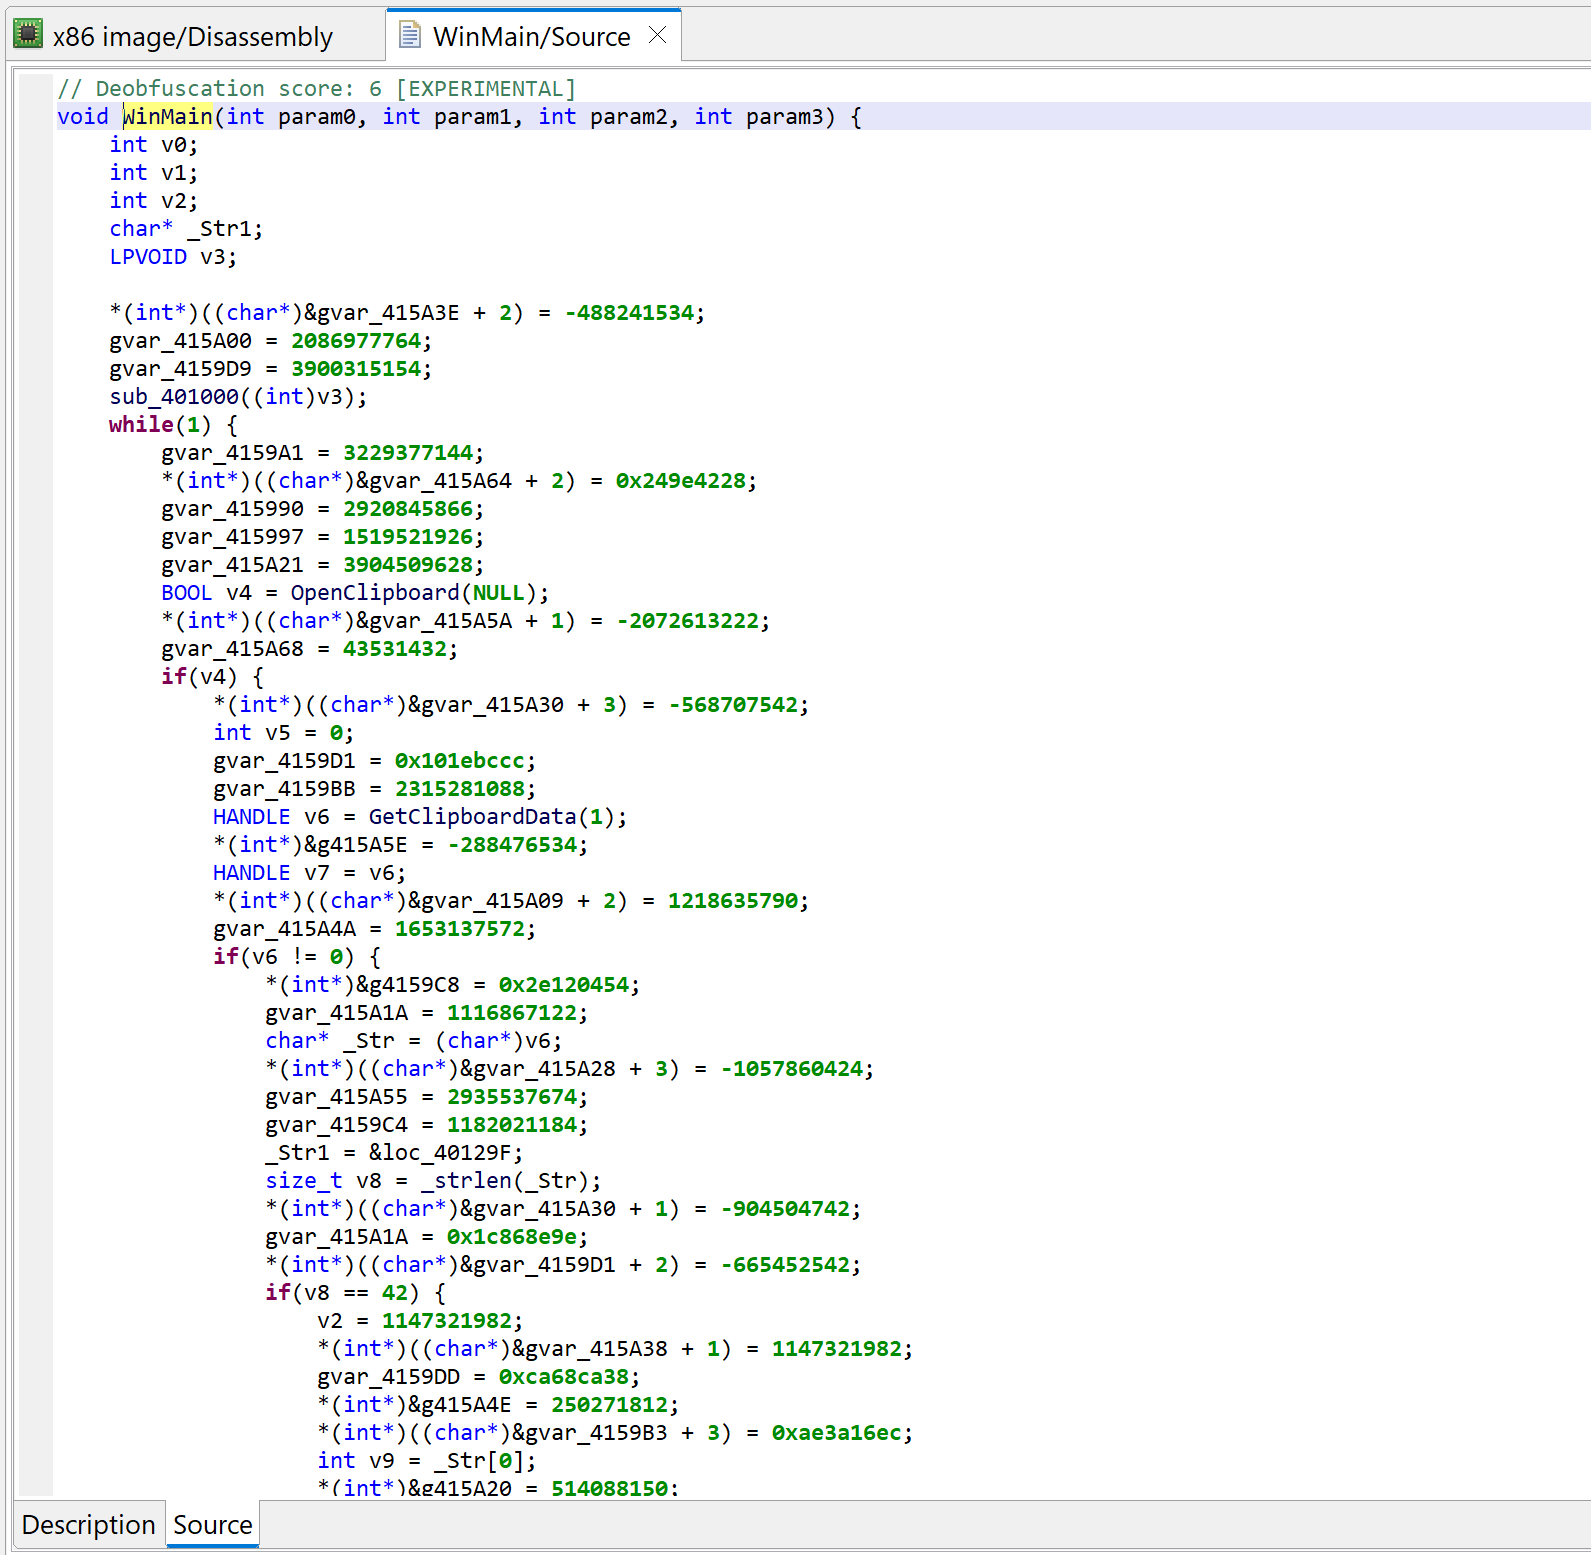
Initial decompilation of WinMain
Two items of interest to note at this point:
There is lots of code that appears to be junk or garbage
There is a note about some “deobfuscation score”
Junk code
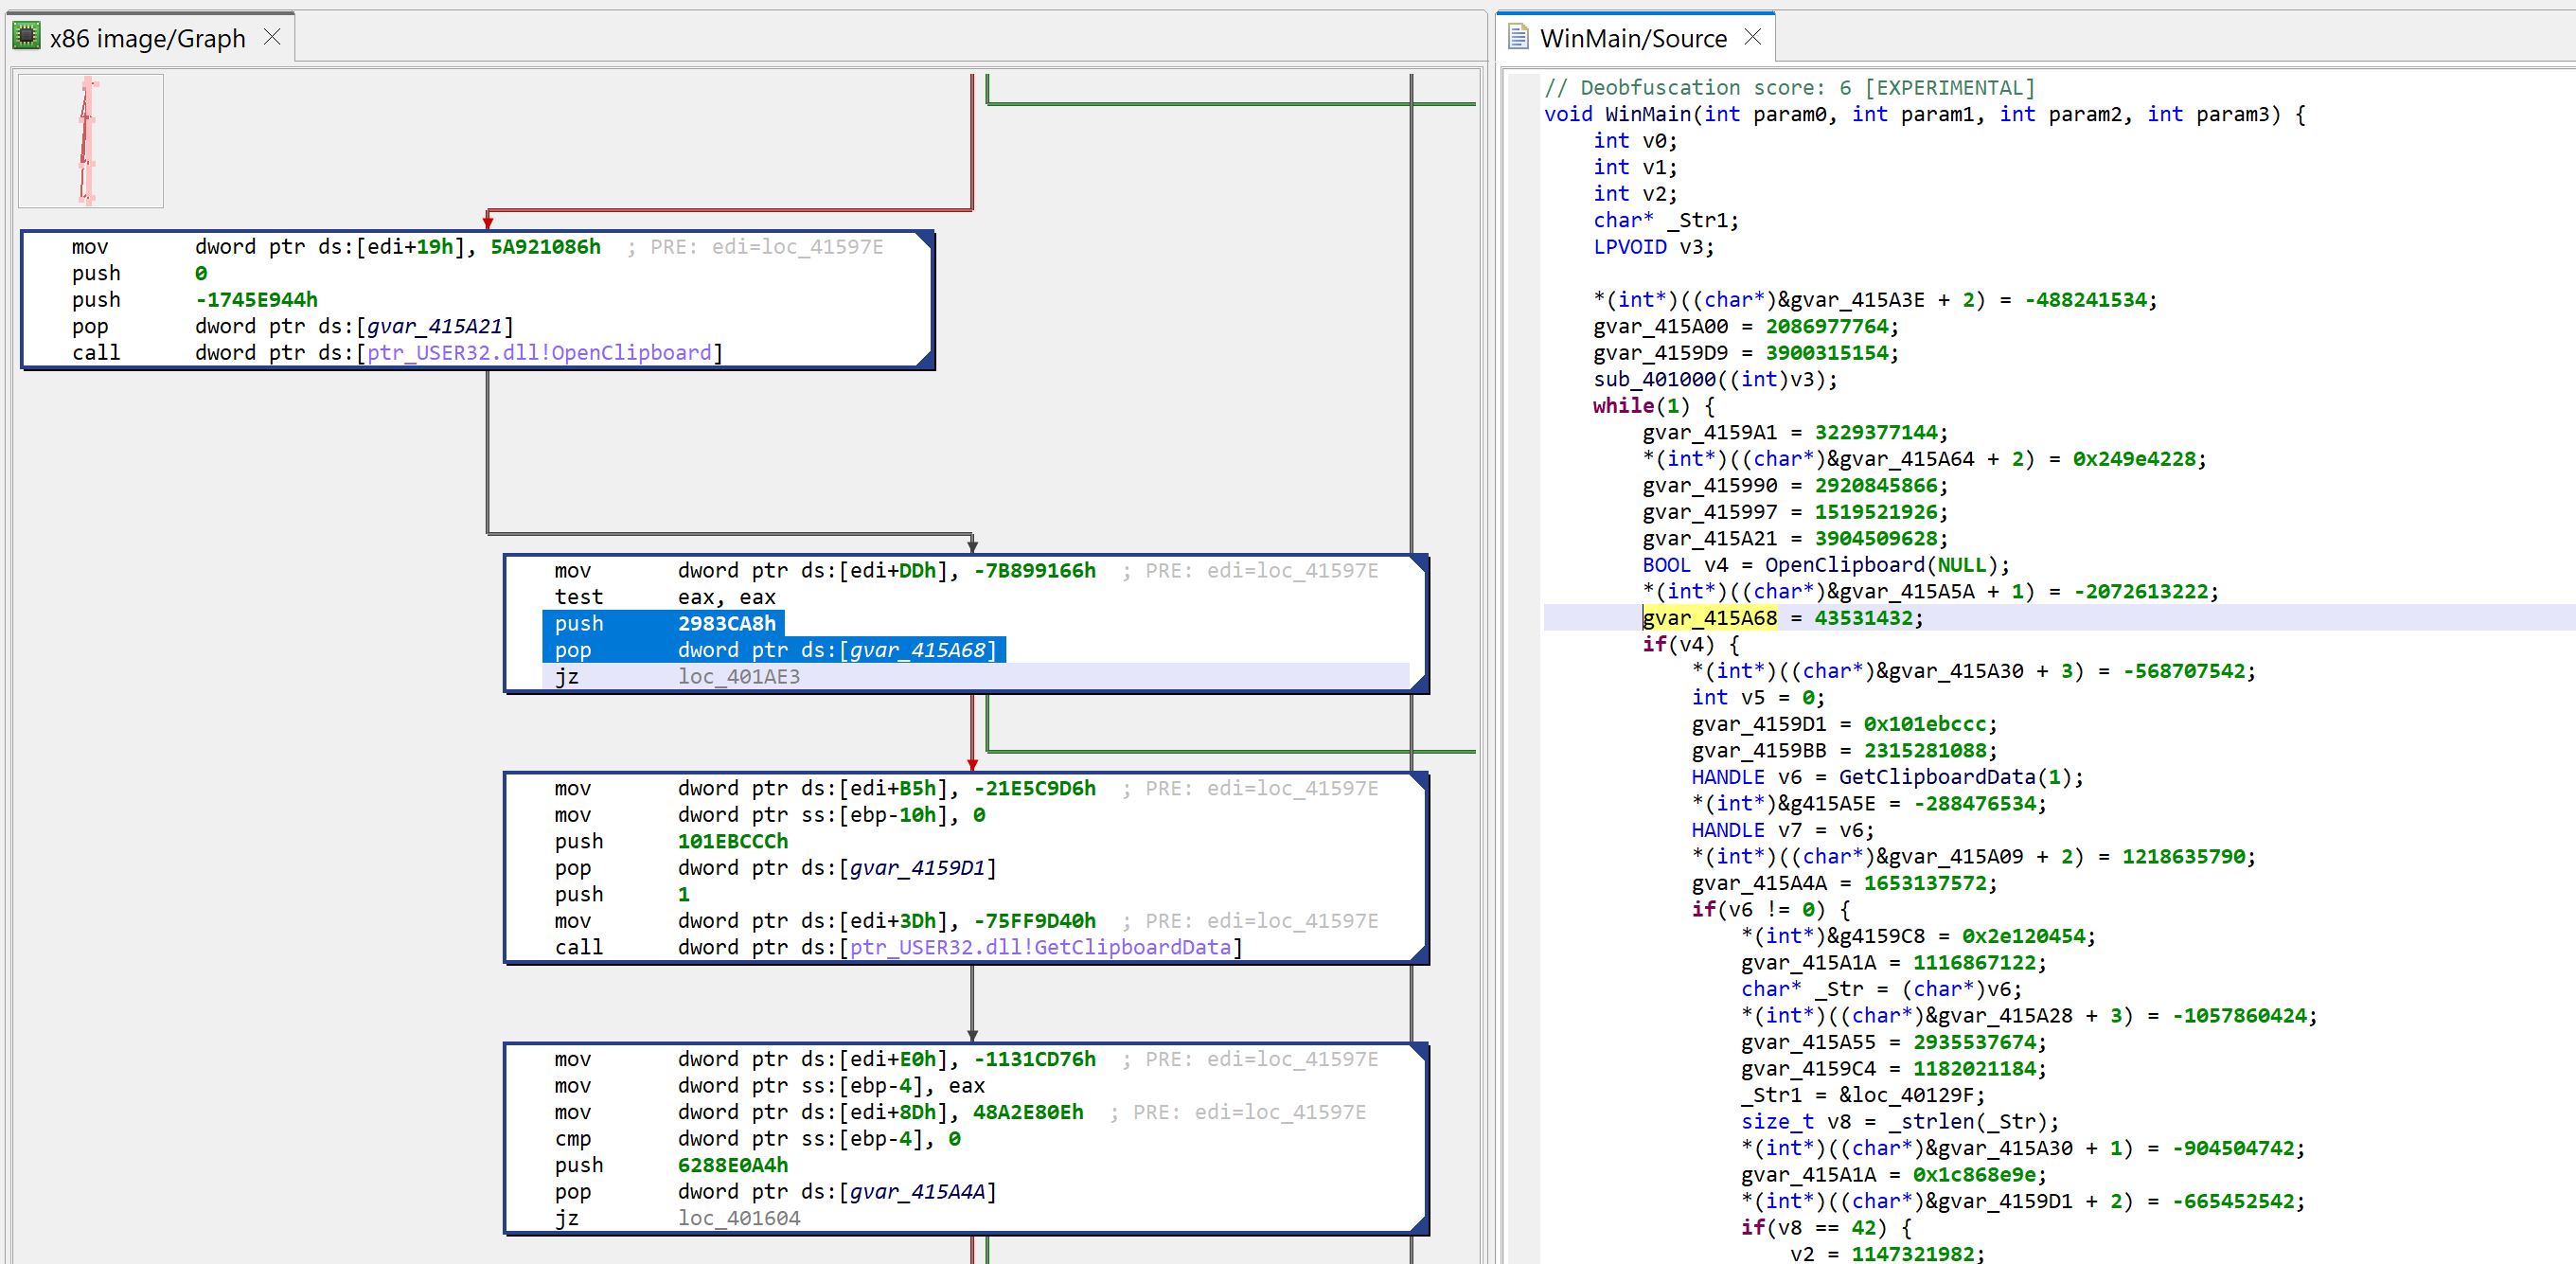
The decompiled WinMain method is about 300 lines of C code. A lot of it are assignments writing to program globals. At first glance, it looks like it could be some sort of obfuscation. Let’s look at the corresponding assembly code:
Press TAB to go back from a decompilation to the closest matching machine code disassembly line
The snippets have the following structure: push GARBAGE / pop dword [gXXX]
Or that, assuming edi is callee-saved: mov edi, gXXX / ... / mov dword [edi+offset], GARBABE
Later on, we will see how to remove this clutter to make the analysis more pleasant.
Deobfuscation score
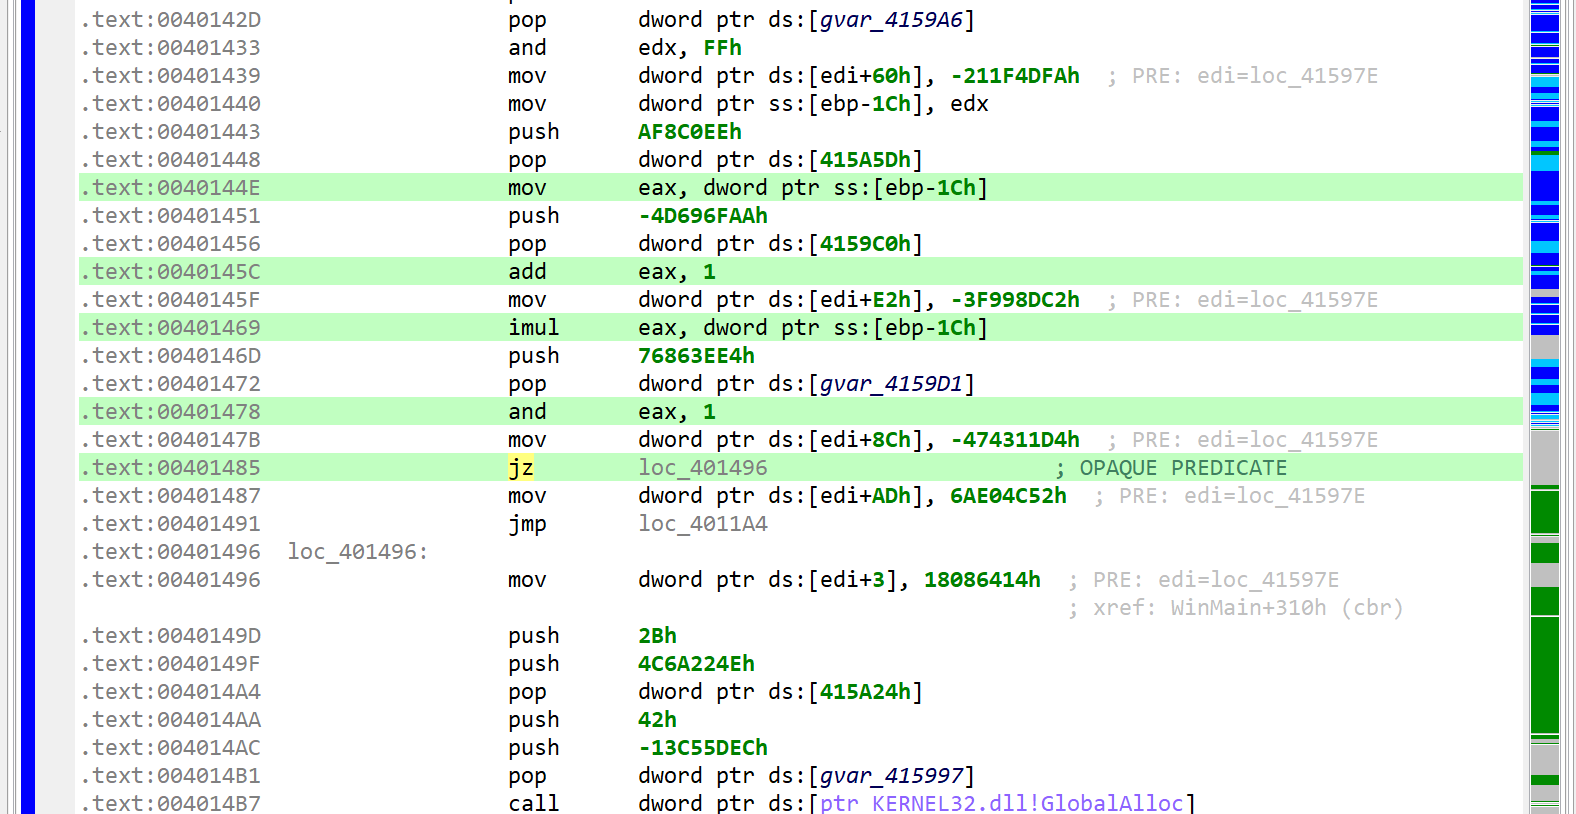
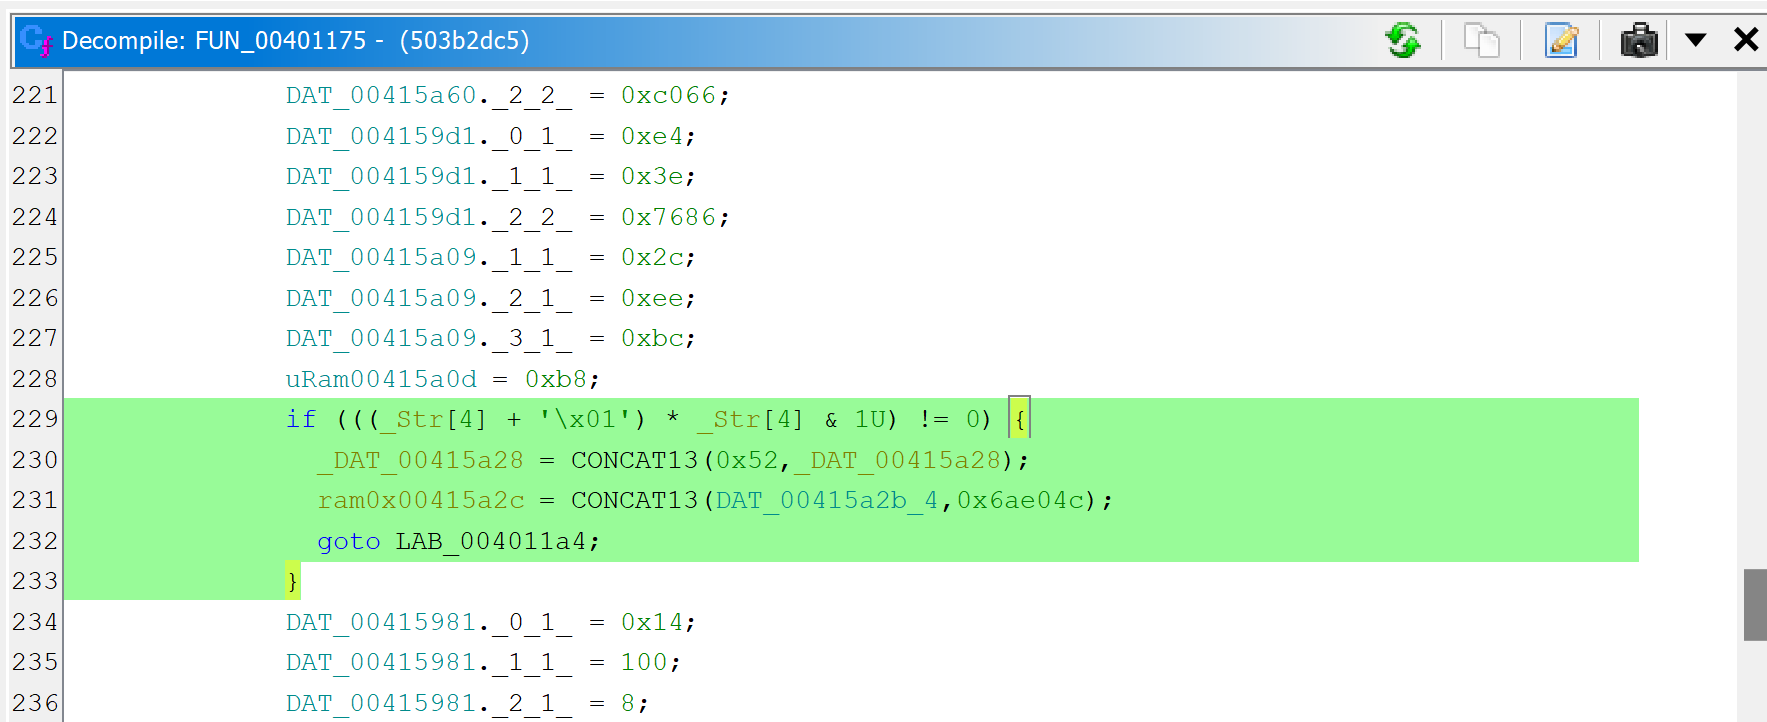
A note “deobfuscation score: 6” was inserted as a method comment. That score indicates that some “advanced” clean-up was performed. In this case, a careful examination (as well as a comparison against a decompilation with UNSAFE optimizers turned off, which you can do by redecompiling the method with CTRL+TAB (menu: Action, Decompile with Options…)) will point to this area of code:
The opaque predicate calculation is highlighted in green using CTRL+M (menu: Action, Toggle Highlight…)
This predicate looks like the following: if(X*(X+1) % 2 == 0) goto LABEL.
With X being an integer, X*(X+1) is always even. Therefore, the predicate will always evaluate to true. JEB cleaned this up automatically. (While this particular predicate is trivial, truly opaque predicates will also be attempted to be broken up by JEB, using the Z3 SMT solver.)
Comparison with GHIDRA
For a point of comparison, you may have a look at the same method decompiled by GHIDRA 10.4 here (default settings were used, just like we did with JEB). The predicate is not cleaned-up adequately, extra control-flow edges are left over, leading to AST structuring confusion.
Cleaning up the code
Let’s start with decluttering this code. First of all, why couldn’t the decompiler clean it up on its own? If the globals written to are never read with meaningful intent, then they could be discarded.
The issue is that this is very hard to ensure in the general case. However, in specific cases, sometimes involving manual review, some global written-to memory range may be deemed useless, as it is the case here. How do we provide this information to the decompiler? Well, as of version 5.7, we cannot! 1 What we can do though is write a decompiler plugin to clean-up the offending IR, and in the process, generate clean(er) code.
IR cleaner plugin
The decompiler accept several types of plugins, including IR Optimizers (they work on the Intermediate Representation of a routine, as it moves up the decompilation pipeline), and AST optimizers (to clean-up or reformat the generated abstract syntax tree of the pseudo-code). In most cases, IR optimizers are well-suited to perform code clean-up or deobfuscation tasks (refer to this blog post for a detailed comparison).
We will write the plugin in Java (we could also write it in Python). It will do the following:
Examine each IR statement of a CFG
Check if the statement is writing an immediate to some global array: *(array + offset) = value
If so, check the array name. If it starts with the prefix “garbage”, consider the statement useless and replace it by a Nop statement
Writing IR plugins is out-of-scope in this post; we will go over that in details in a future entry. In the meantime, you can download the plugin code here. Dump the Java file in your JEB’s coreplugins/scripts/ folder. There is no need to close and re-open JEB; it will be picked up at the next decompilation.
public class GarbageCleaner extends AbstractEOptimizer {

	@Override
	public int perform() {
		int cnt = 0;

		for (BasicBlock<IEStatement> b : cfg) {
			for (int i = 0; i < b.size(); i++) {
				IEStatement stm = b.get(i);
				if (stm instanceof IEAssign && stm.asAssign().getDstOperand() instanceof IEMem
						&& stm.asAssign().getSrcOperand() instanceof IEImm) {
					IEMem dst = stm.asAssign().getDstOperand().asMem();
					IEGeneric e = dst.getReference();
					// [xxx + offset] = immediate
					if (e.isOperation(OperationType.ADD)) {
						IEOperation op = e.asOperation();
						if (op.getOperand1().isVar() && op.getOperand2().isImm()) {
							IEVar v = op.getOperand1().asVar();
							IEImm off = op.getOperand2().asImm();
							if (v.isGlobalReference()) {
								long addr = v.getAddress();
								INativeContinuousItem item = ectx.getNativeContext().getNativeItemAt(addr);
								// logger.info("FOUND ITEM %s", item.getName());
								if (item != null && item.getName().startsWith("garbage")) {
									long itemsize = item.getMemorySize();
									if (off.canReadAsLong() && off.getValueAsLong() + dst.getBitsize() / 8 < itemsize) {
										logger.info("FOUND GARBAGE CODE");
										b.set(i, ectx.createNop(stm));
										cnt++;
									}
								}
							}
						}
					}
				}
			}
		}

		if (cnt > 0) {
			cfg.invalidateDataFlowAnalysis();
		}
		return cnt;
	}
}
Note that by design, the plugin is not specific to this malware. We will be able to re-use it in future analyses: all global arrays prefixed with “garbage” will be treated by the decompiler as junk recipients, and cleaned-up accordingly!
Defining the garbage array
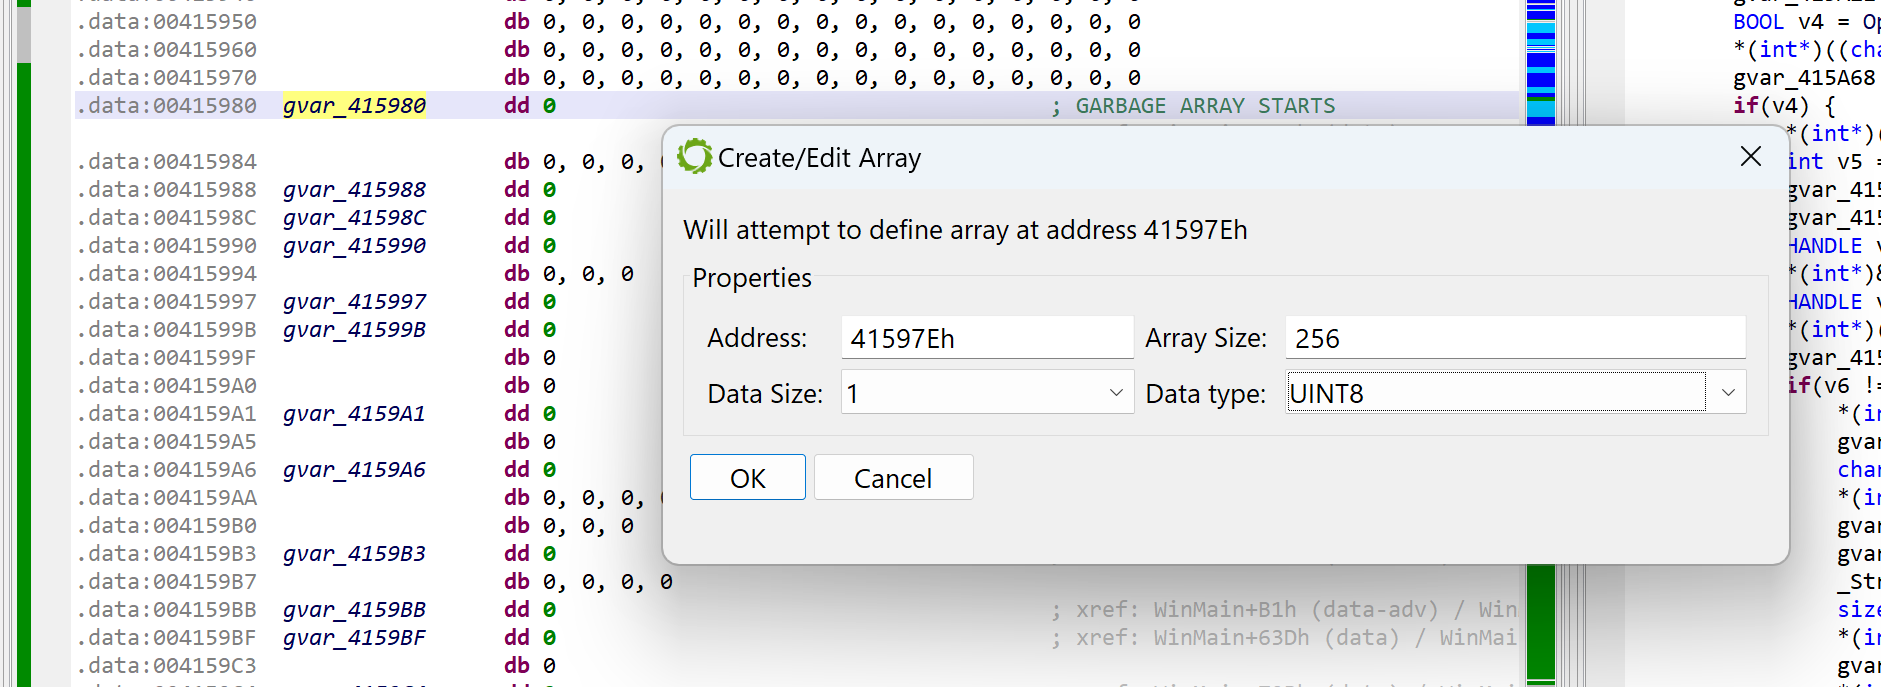
At this point, we need to determine where that array is. Some examination of the code leads to the following boundaries (roughly): start at 0x41597E, spans over 0x100 bytes. Navigate to the disassembly; create an array using the STAR key (menu: Native, Create/Edit Array…); specify its characteristics.
Creating a global array of 0x100 bytes. This is the garbage array.
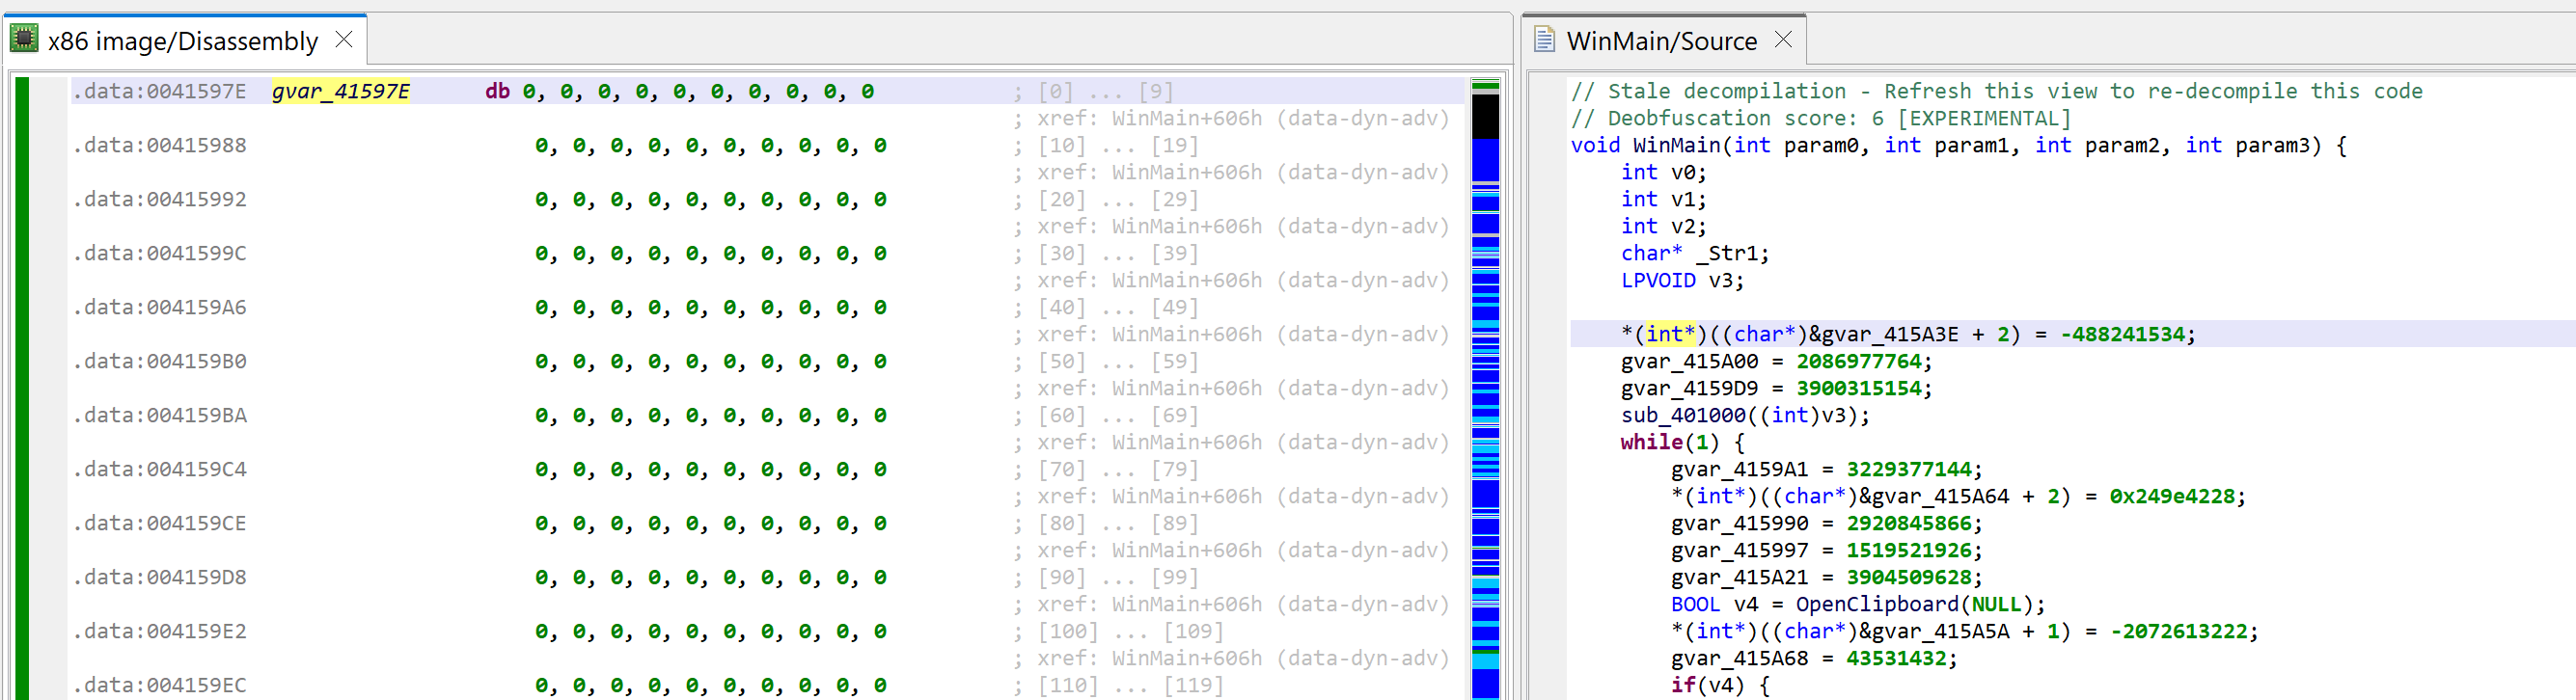
As soon as the array is created, the disassembly will change to what can be seen below. At the same time, the decompilations using that array will be invalidated; that is the case for WinMain. You may see that another extra-comment was added by the decompiler: “Stale decompilation – Refresh this view to re-decompile this code”. Such decompilations are read-only until a new one is generated.
The array is now created. The decompilation of WinMain becomes stale.
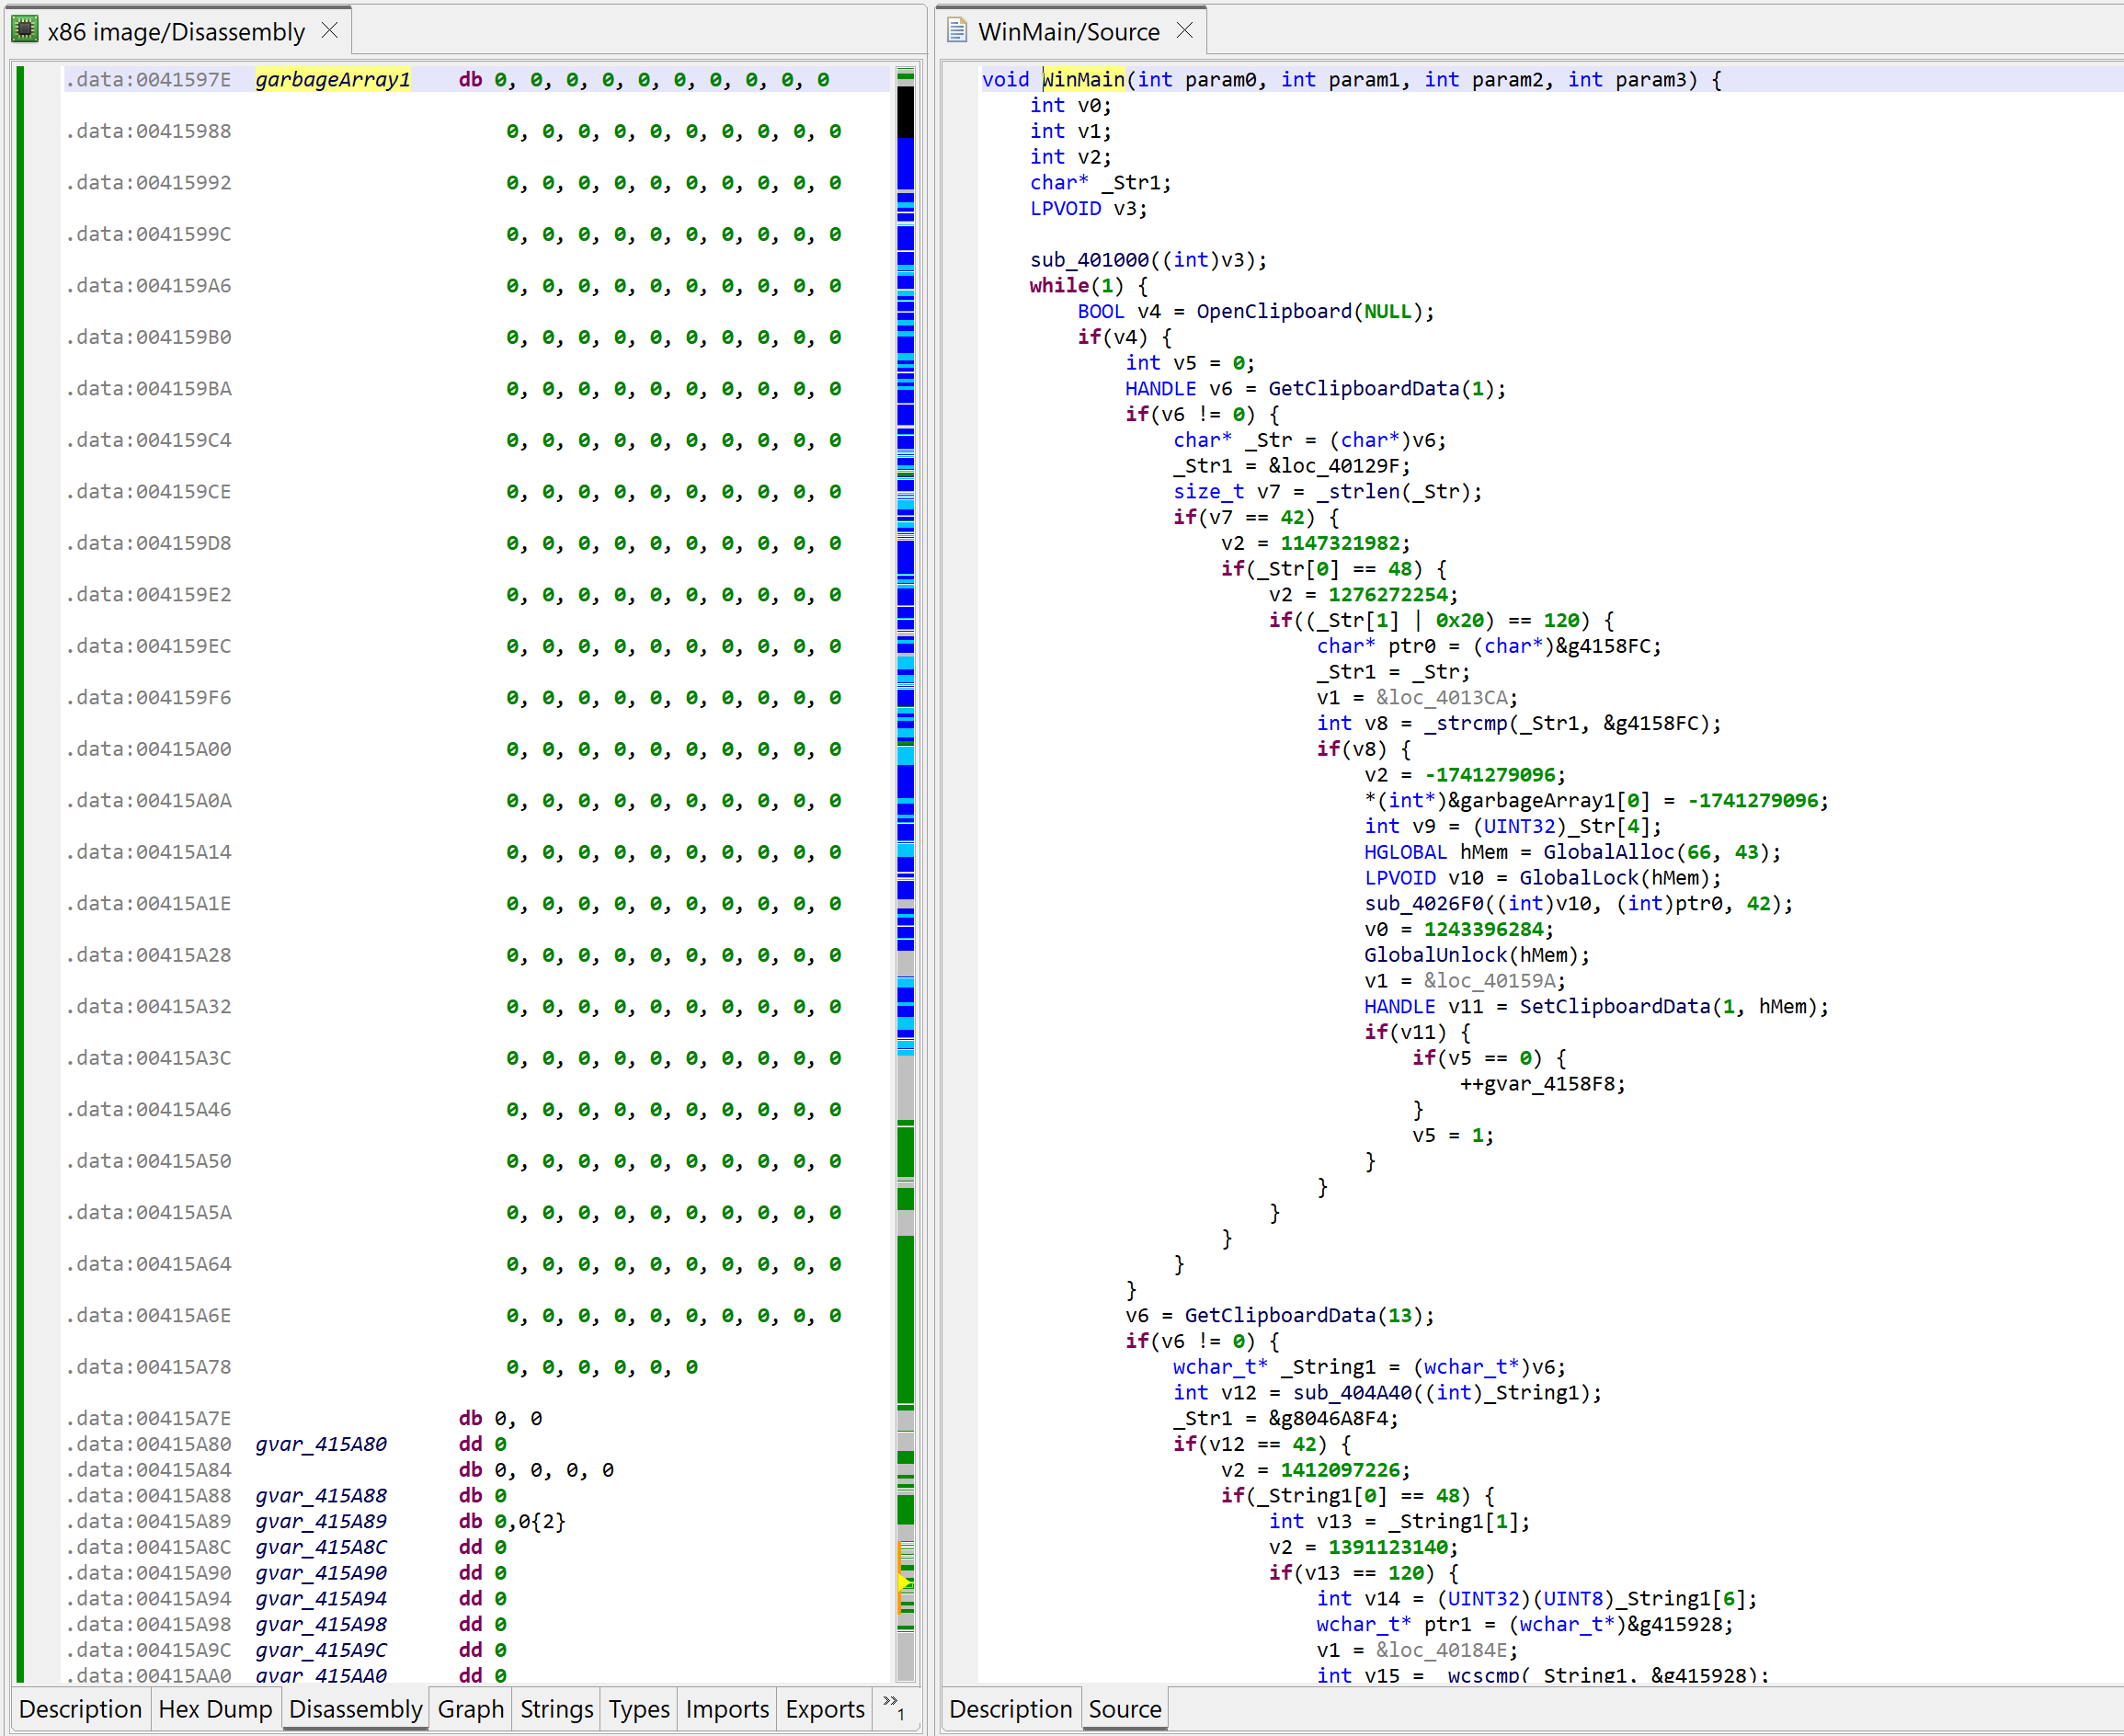
Before redecompiling, remember we need to rename our array with a label starting with “garbage”. Set the caret on the array, hit the key N (menu: Actions, Rename…) and set your new name, e.g., garbageArray1.
Now you may go back to the decompilation view of WinMain and hit F5 (menu: Windows, Refresh…) to regenerate a decompilation.
Decompiled WinMain after the garbage array-assigns were cleaned-up by the plugin
The code above is much nicer to look at – and much easier to work on!
Quick analysis
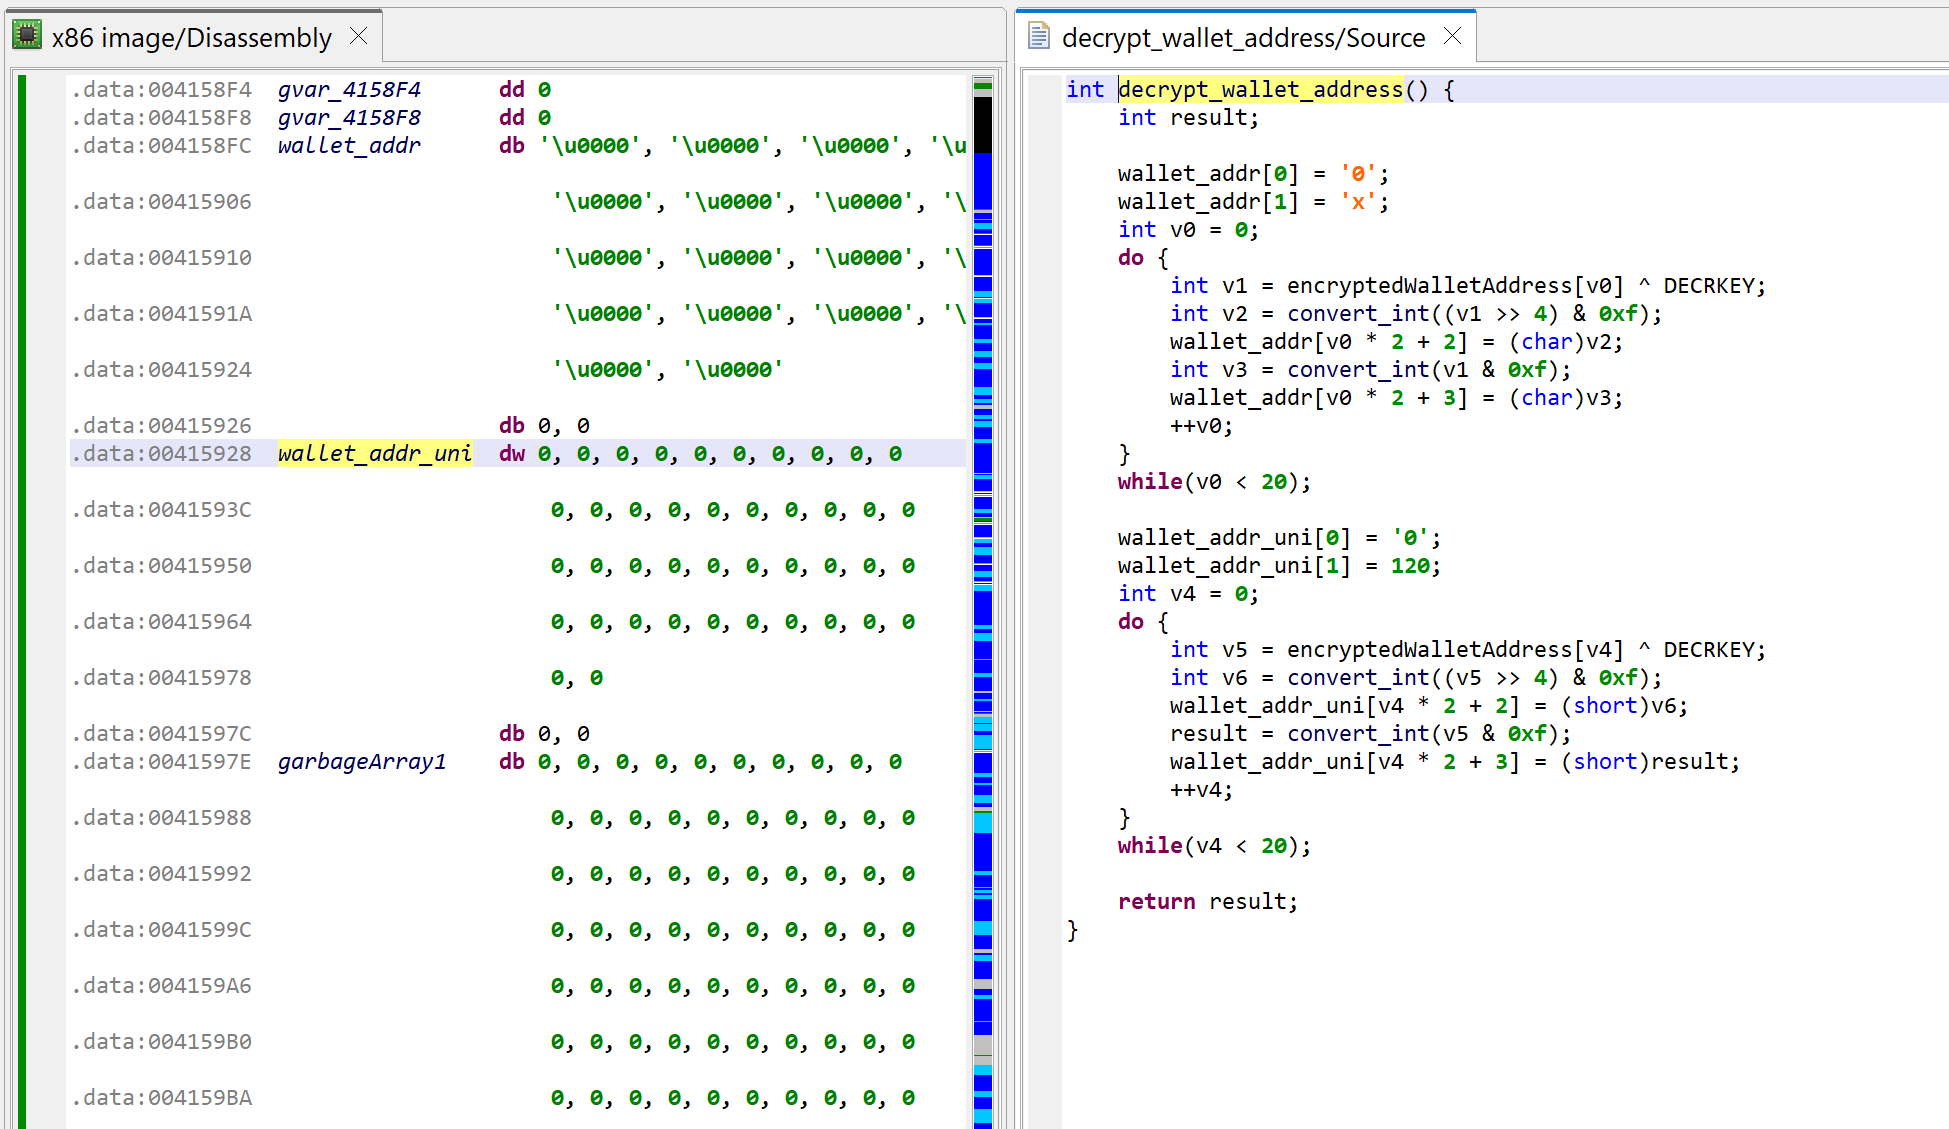
The method at 0x401000, called by WinMain, is decrypting the thief’s wallet address, and generating two hexstring versions of it (ascii and unicode).
Decrypting the target wallet address. The decompilation is shown after proper types were applied on the data structures accessed (encrypted wallet address, hexstrings, etc.) and better names given to those vars
The loop in WinMain is doing the following:
Every second, it queries the Windows clipboard with OpenClipboard
It checks if it contains text strings or unicode strings
If the string is 42 characters in length and starts with “0x”, it proceeds (an Ethereum wallet address is 20 bytes, therefore its hexadecimal representation would be 40 characters)
It checks if the string is not the attacker’s wallet address
If not, it replaces the contents of the clipboard data by the attacker’s wallet address using SetClipboardData
Finally, the other contents found in the clipboard is discarded
Well-known literals
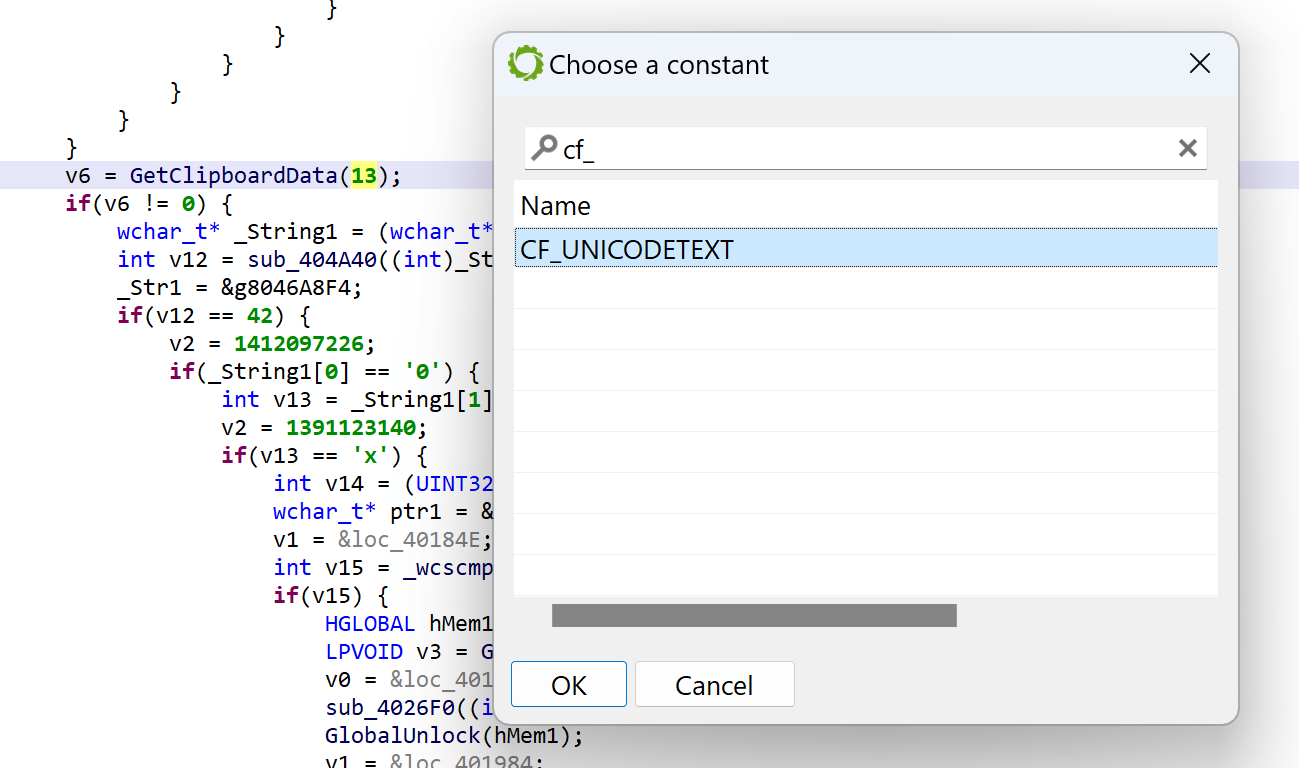
In JEB, you may replace immediates by well-known literals found in type libraries (aka typelibs, such as the win32 typelibs, which were automatically loaded when the analysis of the PE file started). To do that, select the immediate, then hit CTRL+N (menu: Action, Replace…), and select the desired literal 2
For example, per the MSDN, GetClipboardData uses CF_xxx constants to indicate the type of data. We can ask JEB to replace GetClipboardData(13) by GetClipboardData(CF_UNICODETEXT) using the Action/Replace handler:
Replacing 13 by CF_UNICODE in a call to GetClipboardData
Conclusion
That concludes the first blog in this “How to use JEB” series. In the next episodes, we will look at other features, dig deeper into writing IR plugins, look into types and types creation, and reverse other architectures, including exotic code.
To learn more, we encourage you to:
Explore this blog, as it contains many technical entries and how-to’s.
Look at the sample code (scripts and plugins) shipping with JEB, it will get you started on using the API to write your own extensions.
Join our Slack channel to engage with other users in the community and ask questions if you’re stuck on anything.
Thank you very much & Stay tuned 🙂 Happy Holiday to All 🎄
–
The plugin written to analyze this malware may ship in some upcoming version of JEB. ↩
In many cases, JEB will do that automatically, and it should be the case here. ↩
This is part 2 of the blog that introduced the major addition that shipped with JEB Pro 4.29: the ability for the dex decompiler to call into the native analysis pipeline, the generic decompiler and native code emulator.
Today, we demo how to use two plugins shipping with JEB 4.30, making use of the emulators to recover information protected by a native code library found in several APKs, libpairipcore.so.
Recovering statically registered native routines
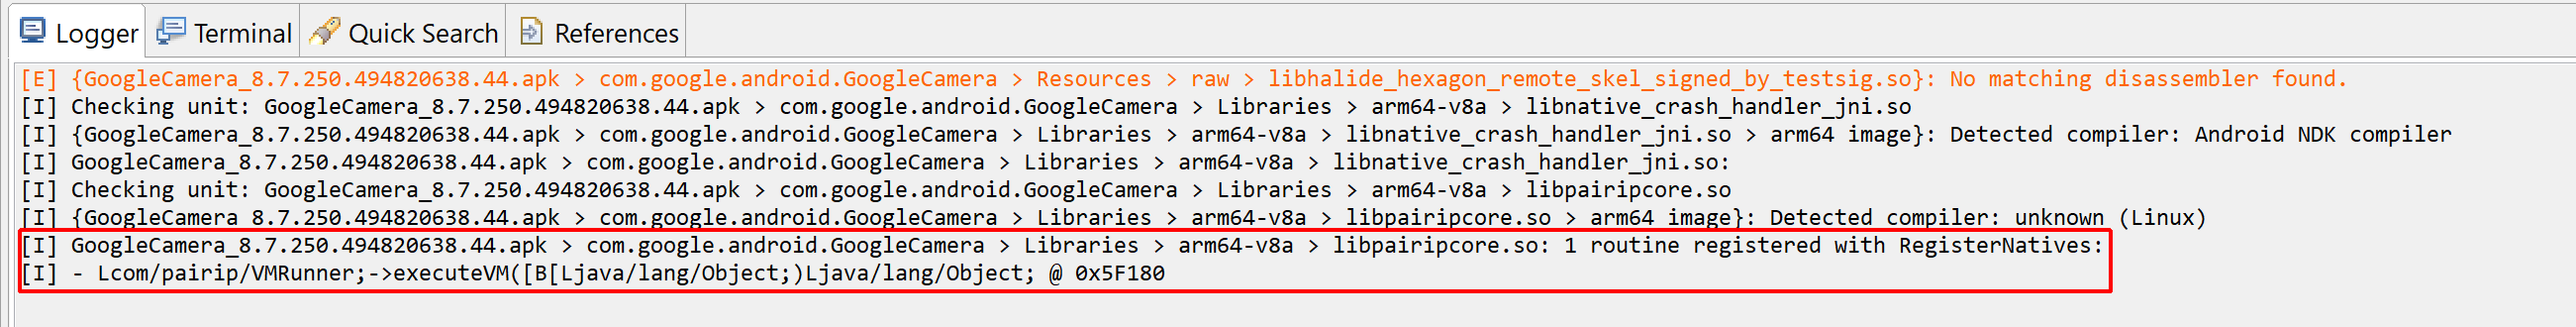
The first plugin can be used to discover native routines registered via JNI’s RegisterNatives. As a reminder, when calling a native method from Java, the JNI will see if exported routines with specific names derived from the Java method signature exist in the process. Alternatively, bindings between a Java native method and its actual body can be done with RegisterNatives. Typically, this is achieved in JNI_OnLoad, the primary entry-point. However, it does not need to; other techniques exist to further obfuscate the target call site of a Java native method, such as unregistration/re-registration, the obfuscation of JNI_OnLoad, etc. More information can be found here.
In its current state, the plugin will attempt to emulate a SO library’s JNI_OnLoad on its own, without the context of the app process it would normally run on. The advantage is that the plugin is useable on libraries recovered without their container app (APK or else). The drawback is that it may fail in complex cases, since the full app context is not available to this plugin. (Note that the second plugin does not suffer this limitation).
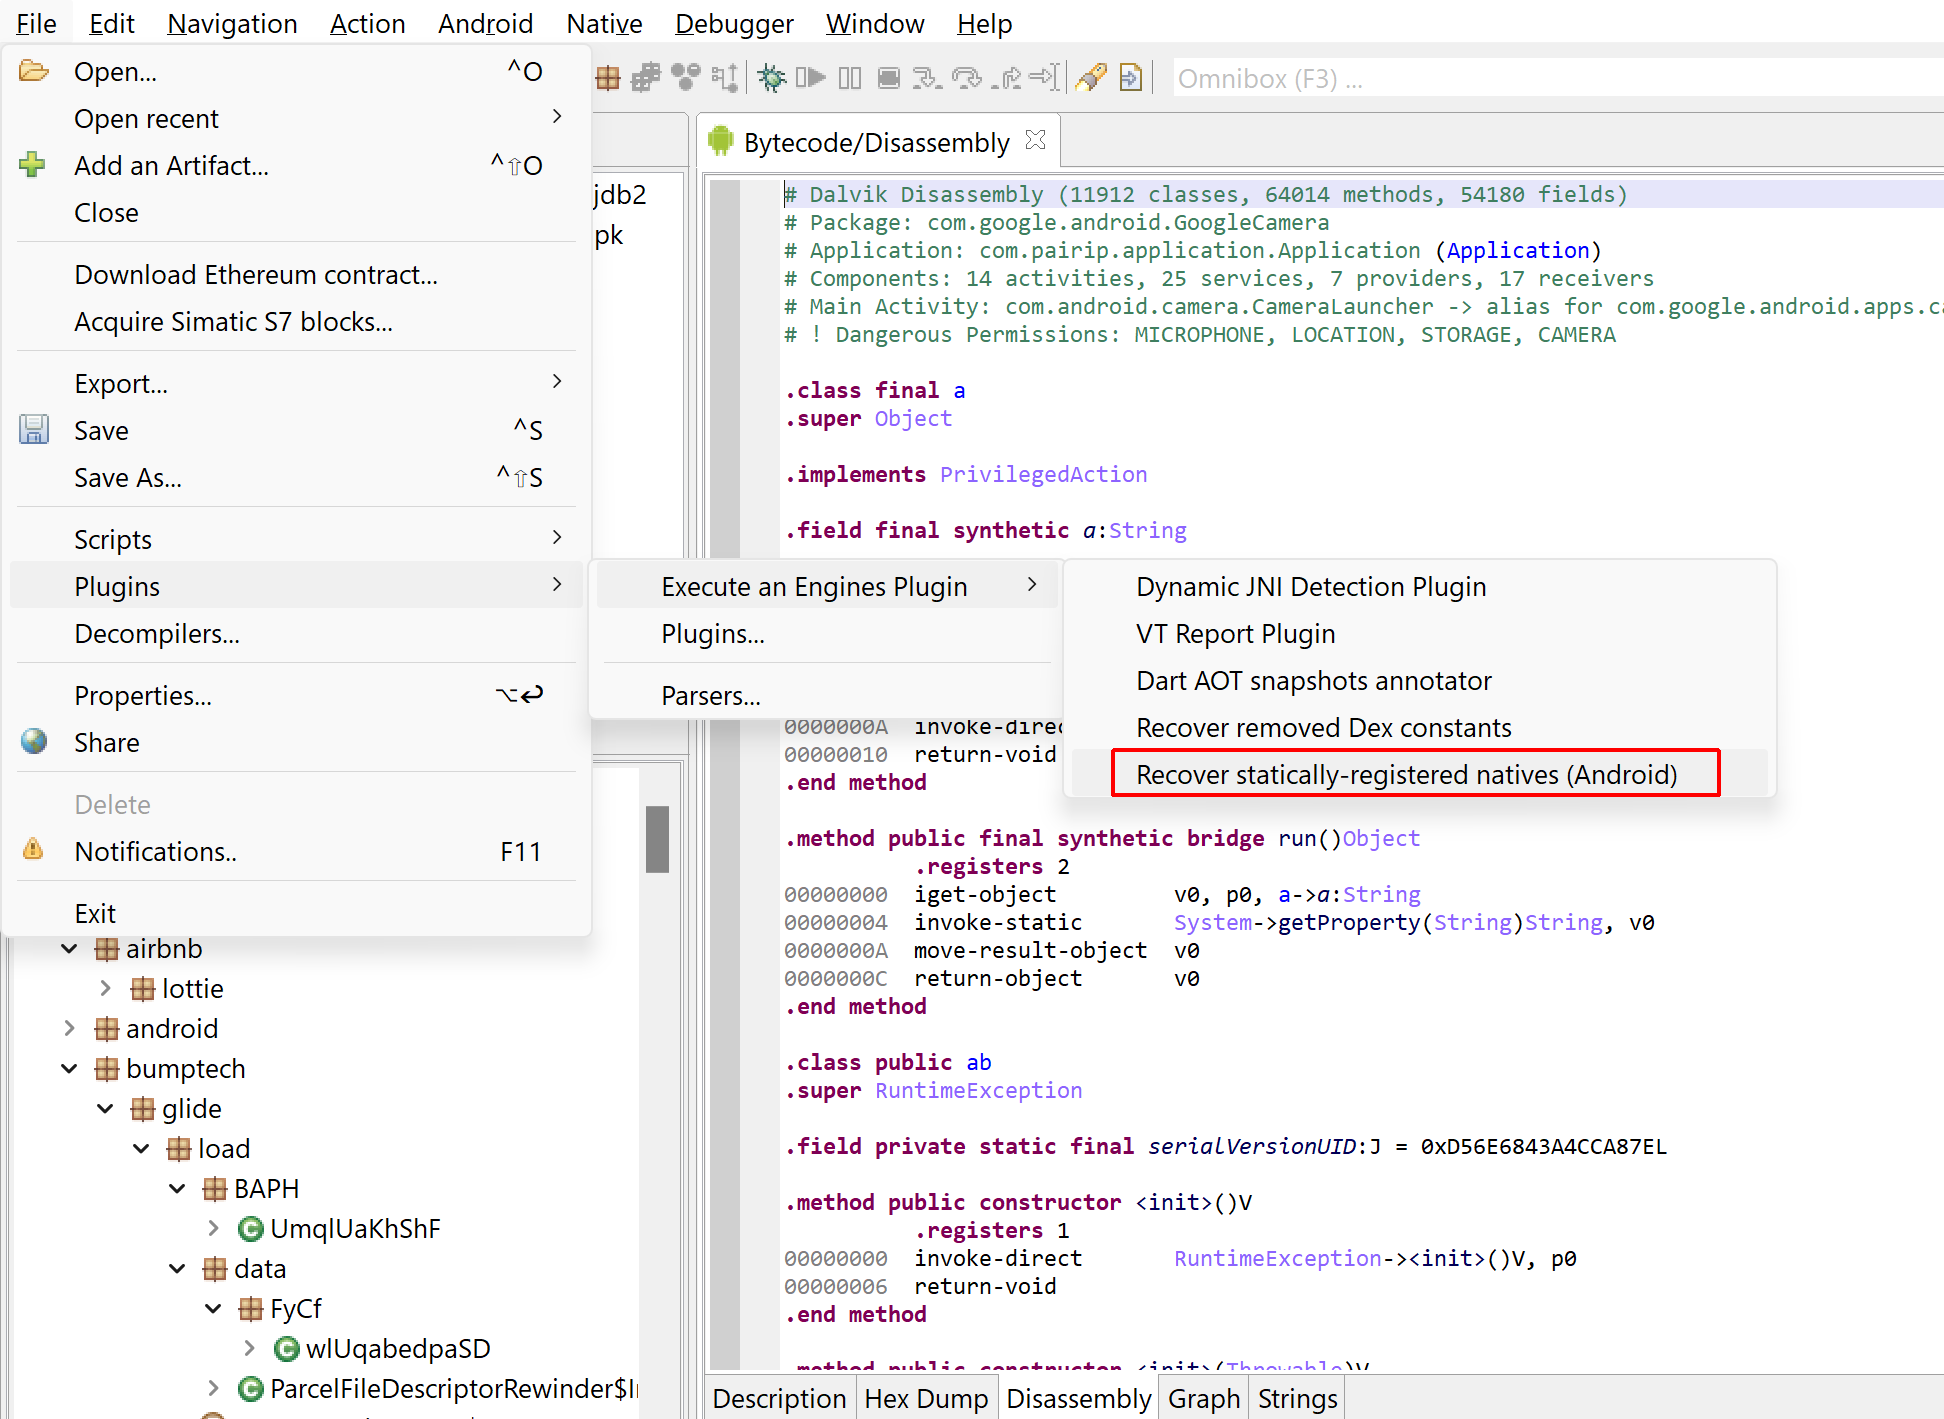
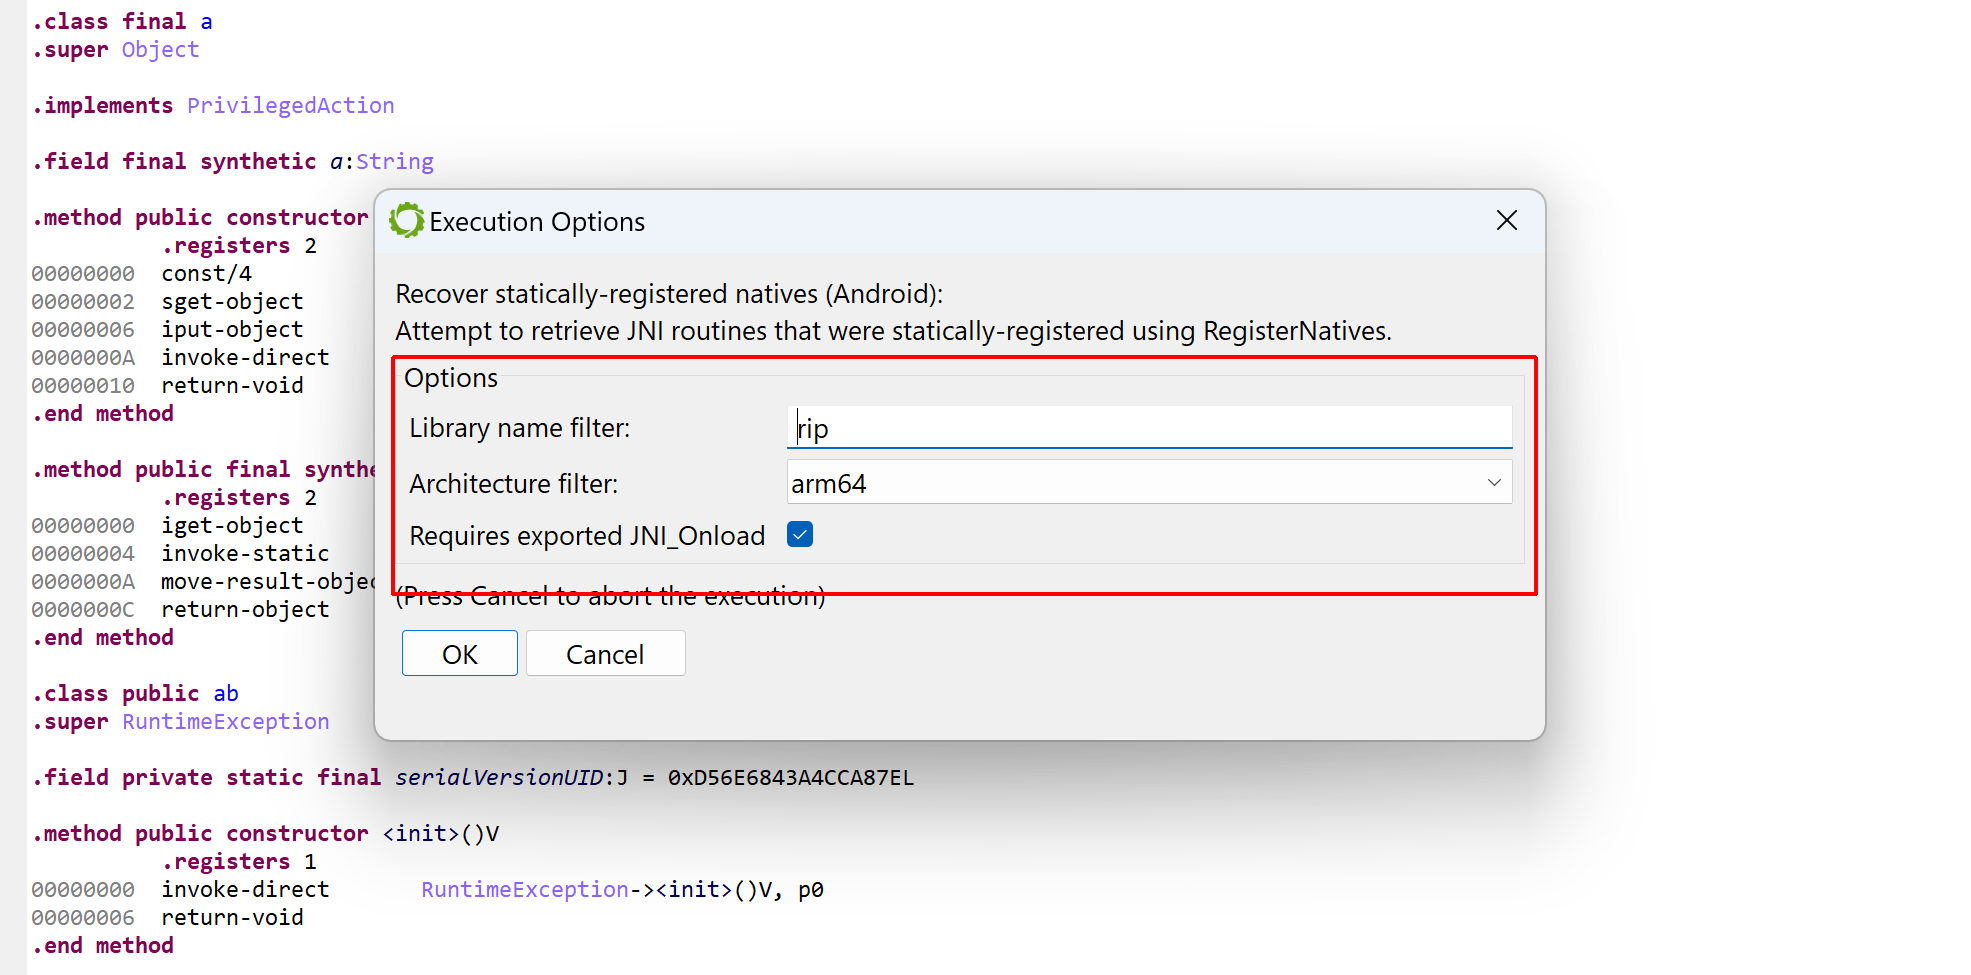
Open an APK or Elf SO file(s), run the “Recover statically-registered natives (Android)” plugin.Set optional name filters or architecture filters as needed.The results will be visible in the log. In this case, it looks like the aarch64 library libpairipcore.so registered one method for com.pairip.VMRunner.executeVM, and mapped it to a routine at 0x5F180.
Recovering constants removed from the Dex
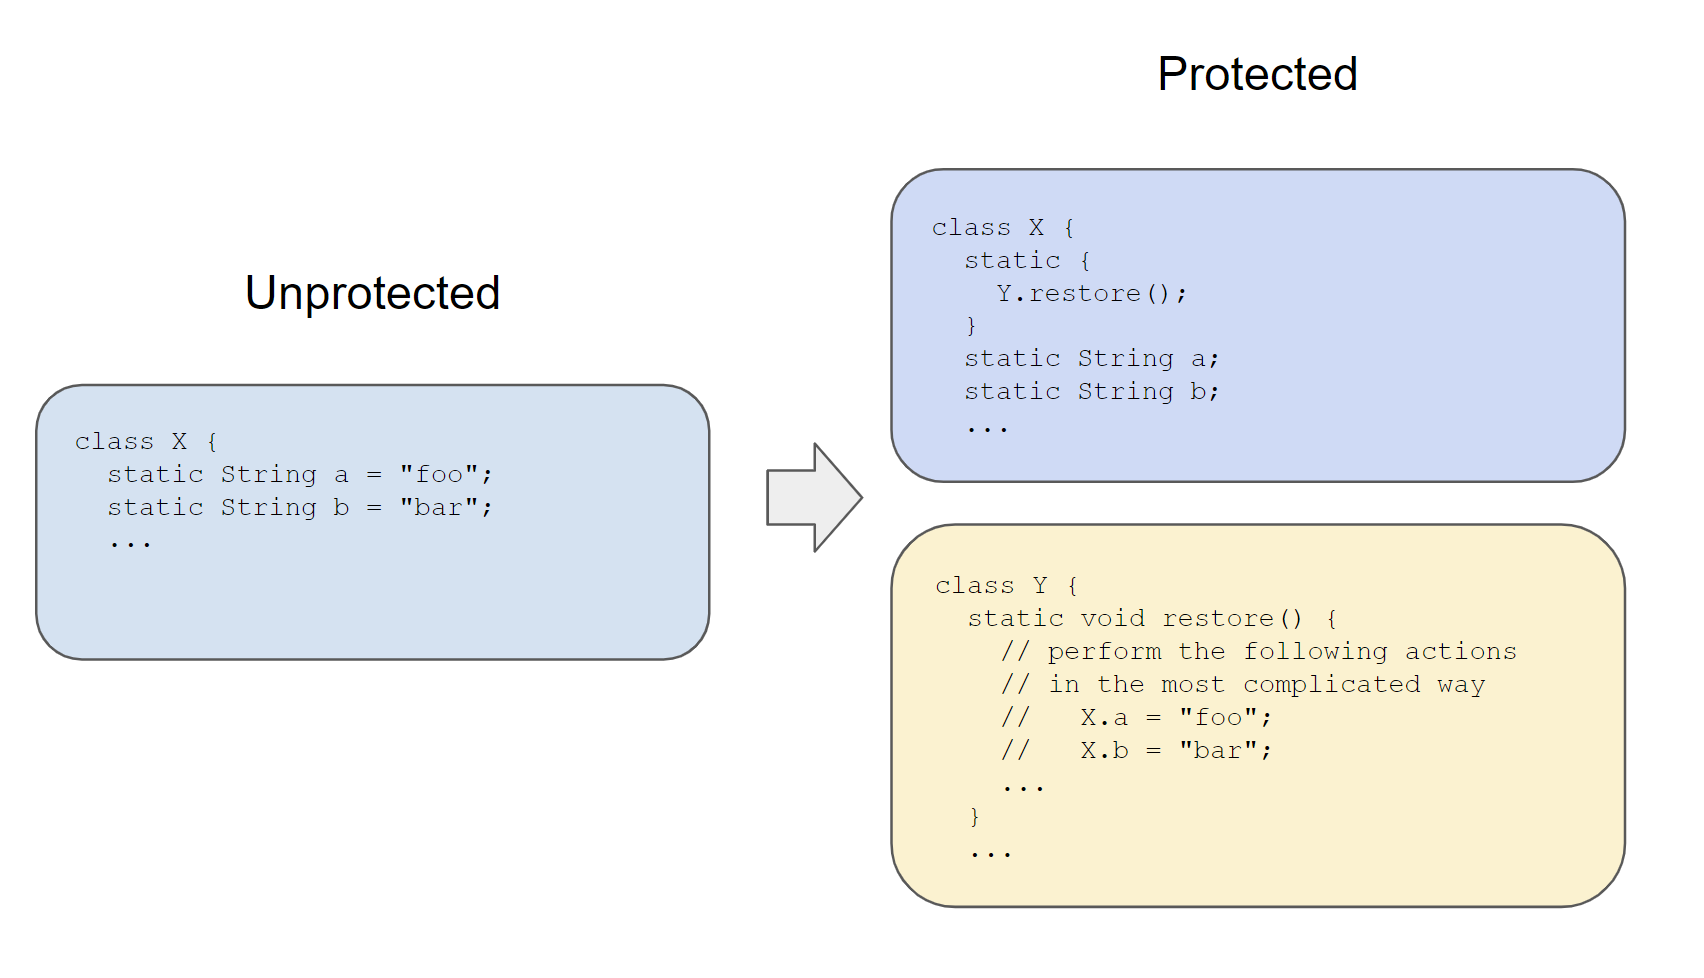
The second plugin makes use of an IEmulatedAndroid object to simulate an execution environment and execute code that may be restoring static string constants removed from the Dex by code protection systems.
We can imagine that the code protection pass works as such:
String constants are being removed during a protection pass.
The implementation details of restore() are not relevant to this blog entry. In the case of that particular app, it involves calling into a highly obfuscated native library called libpairipcore.so.
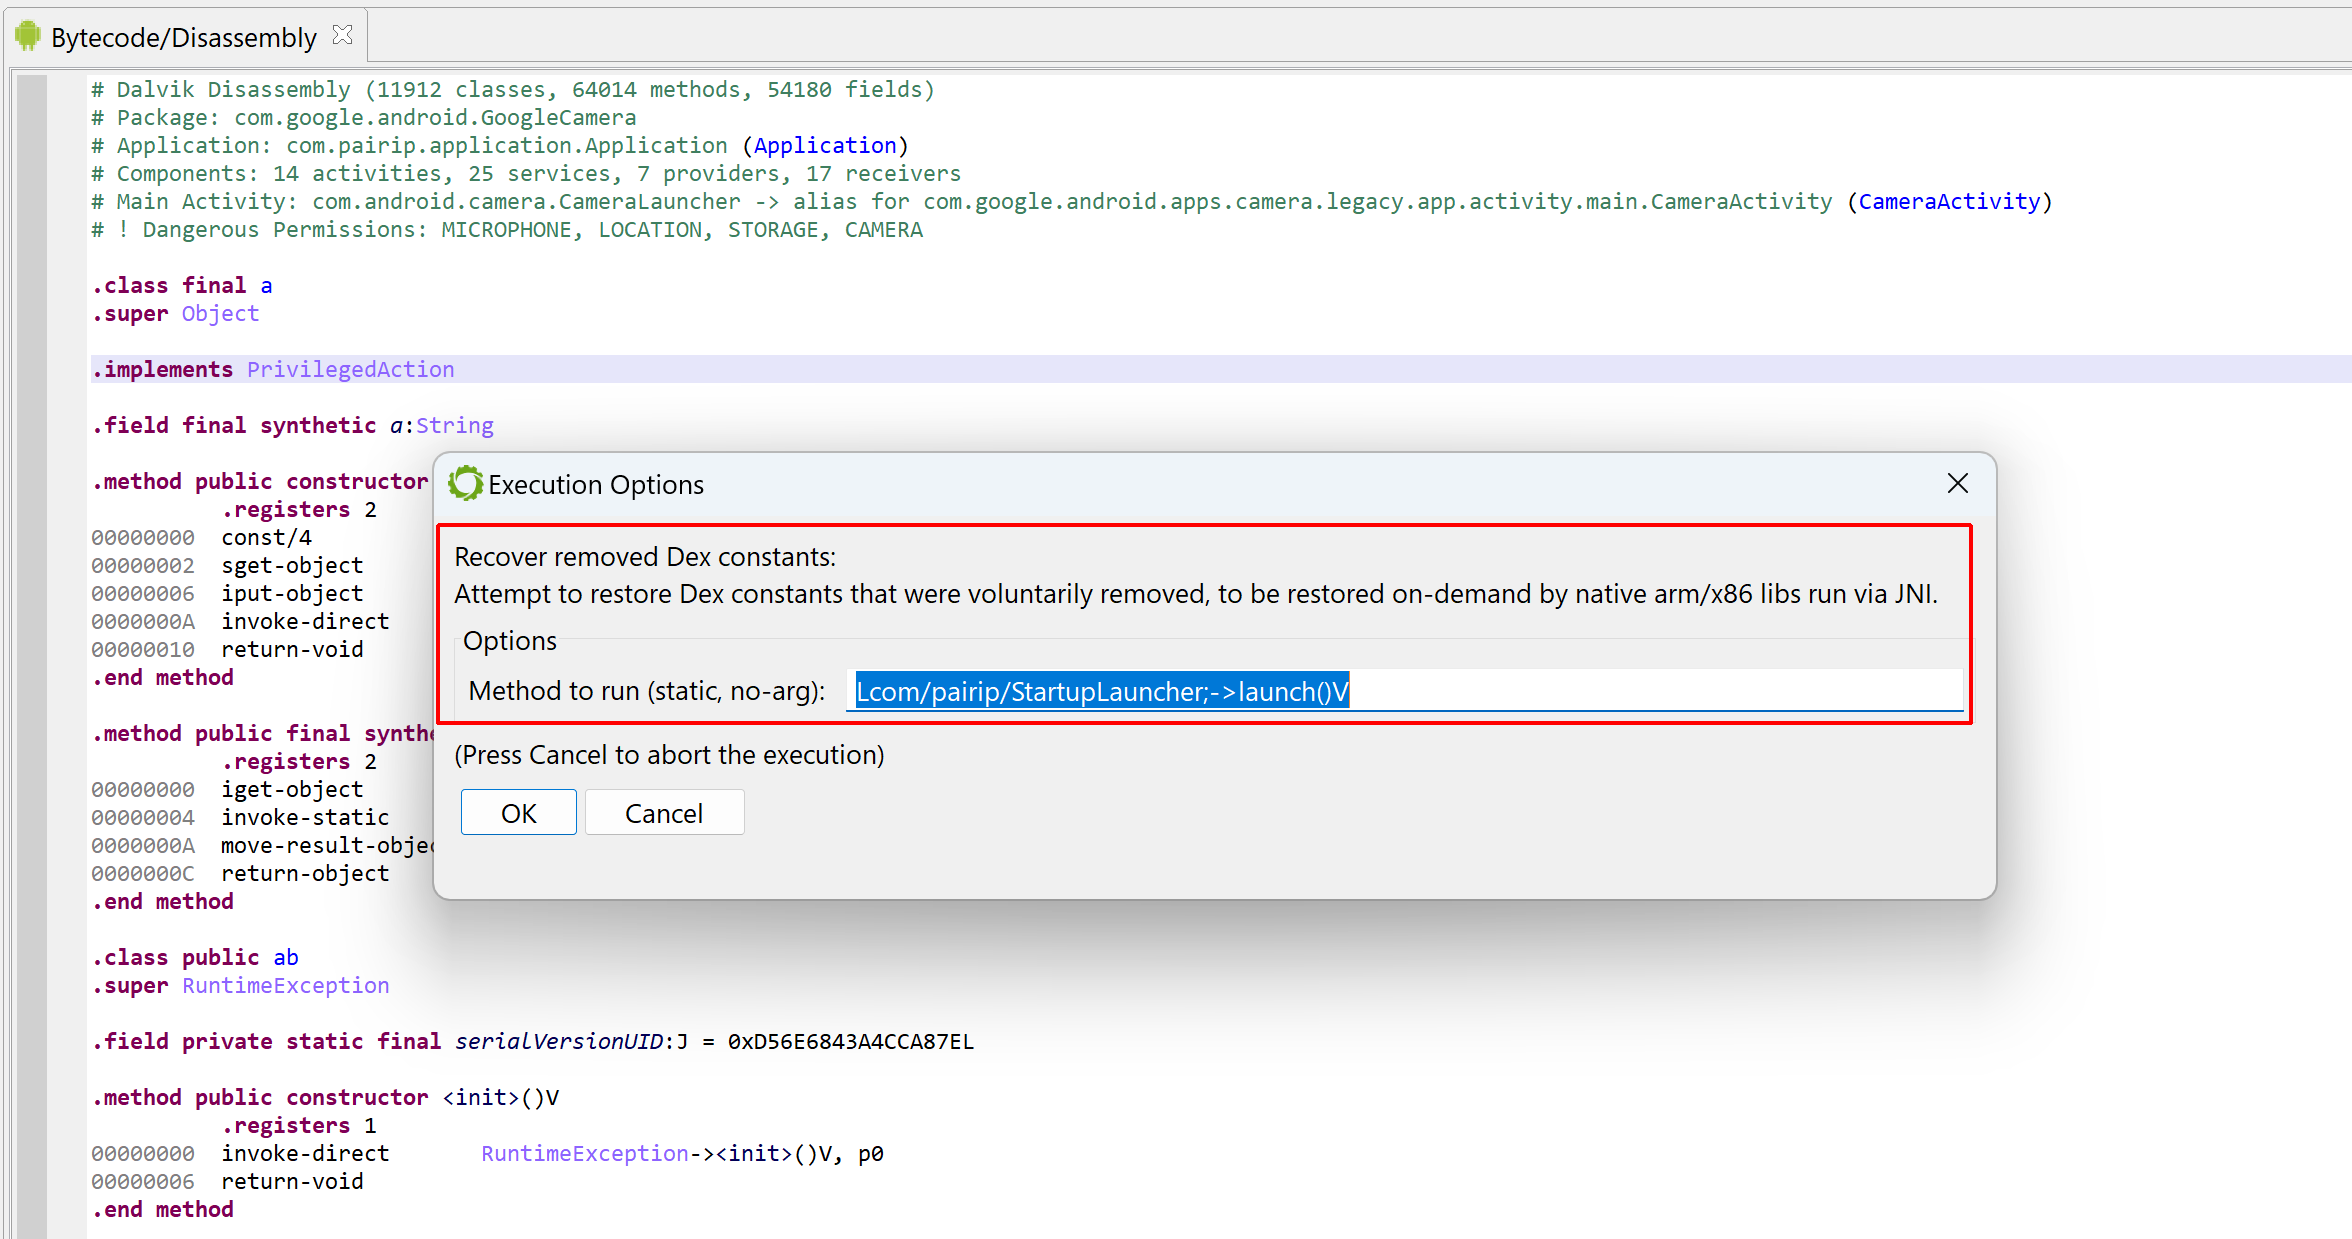
The plugin requires a full APK. It will emulate a static method selected by the user and let them know about the constants that were restored.
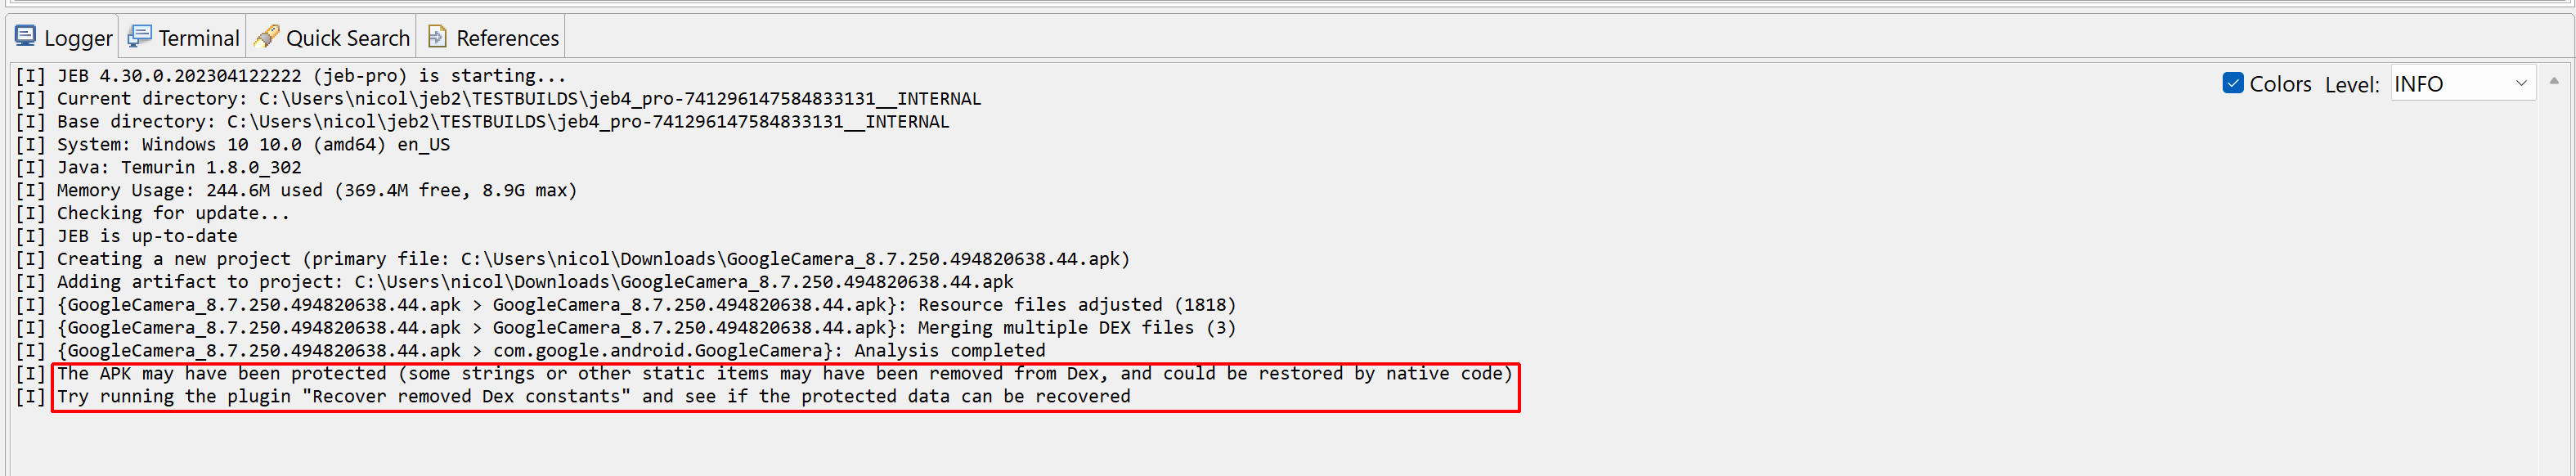
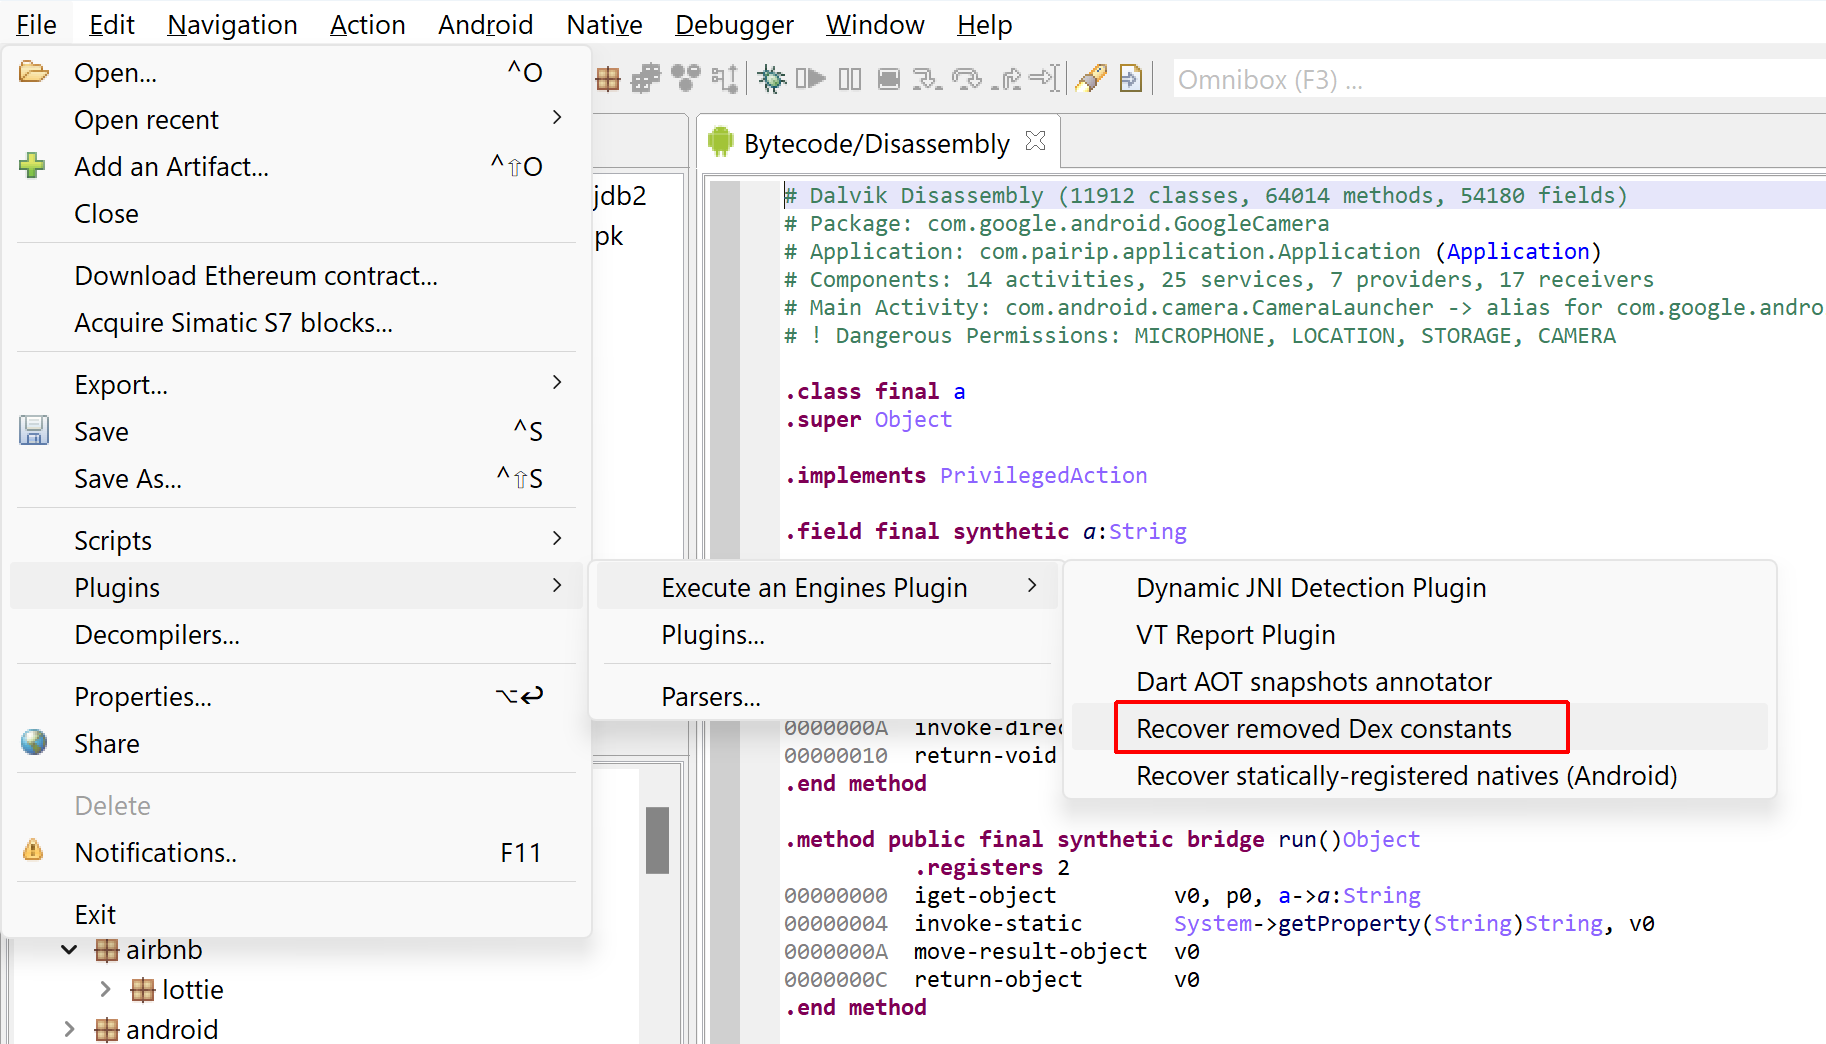
The plugin workflow is as follows:
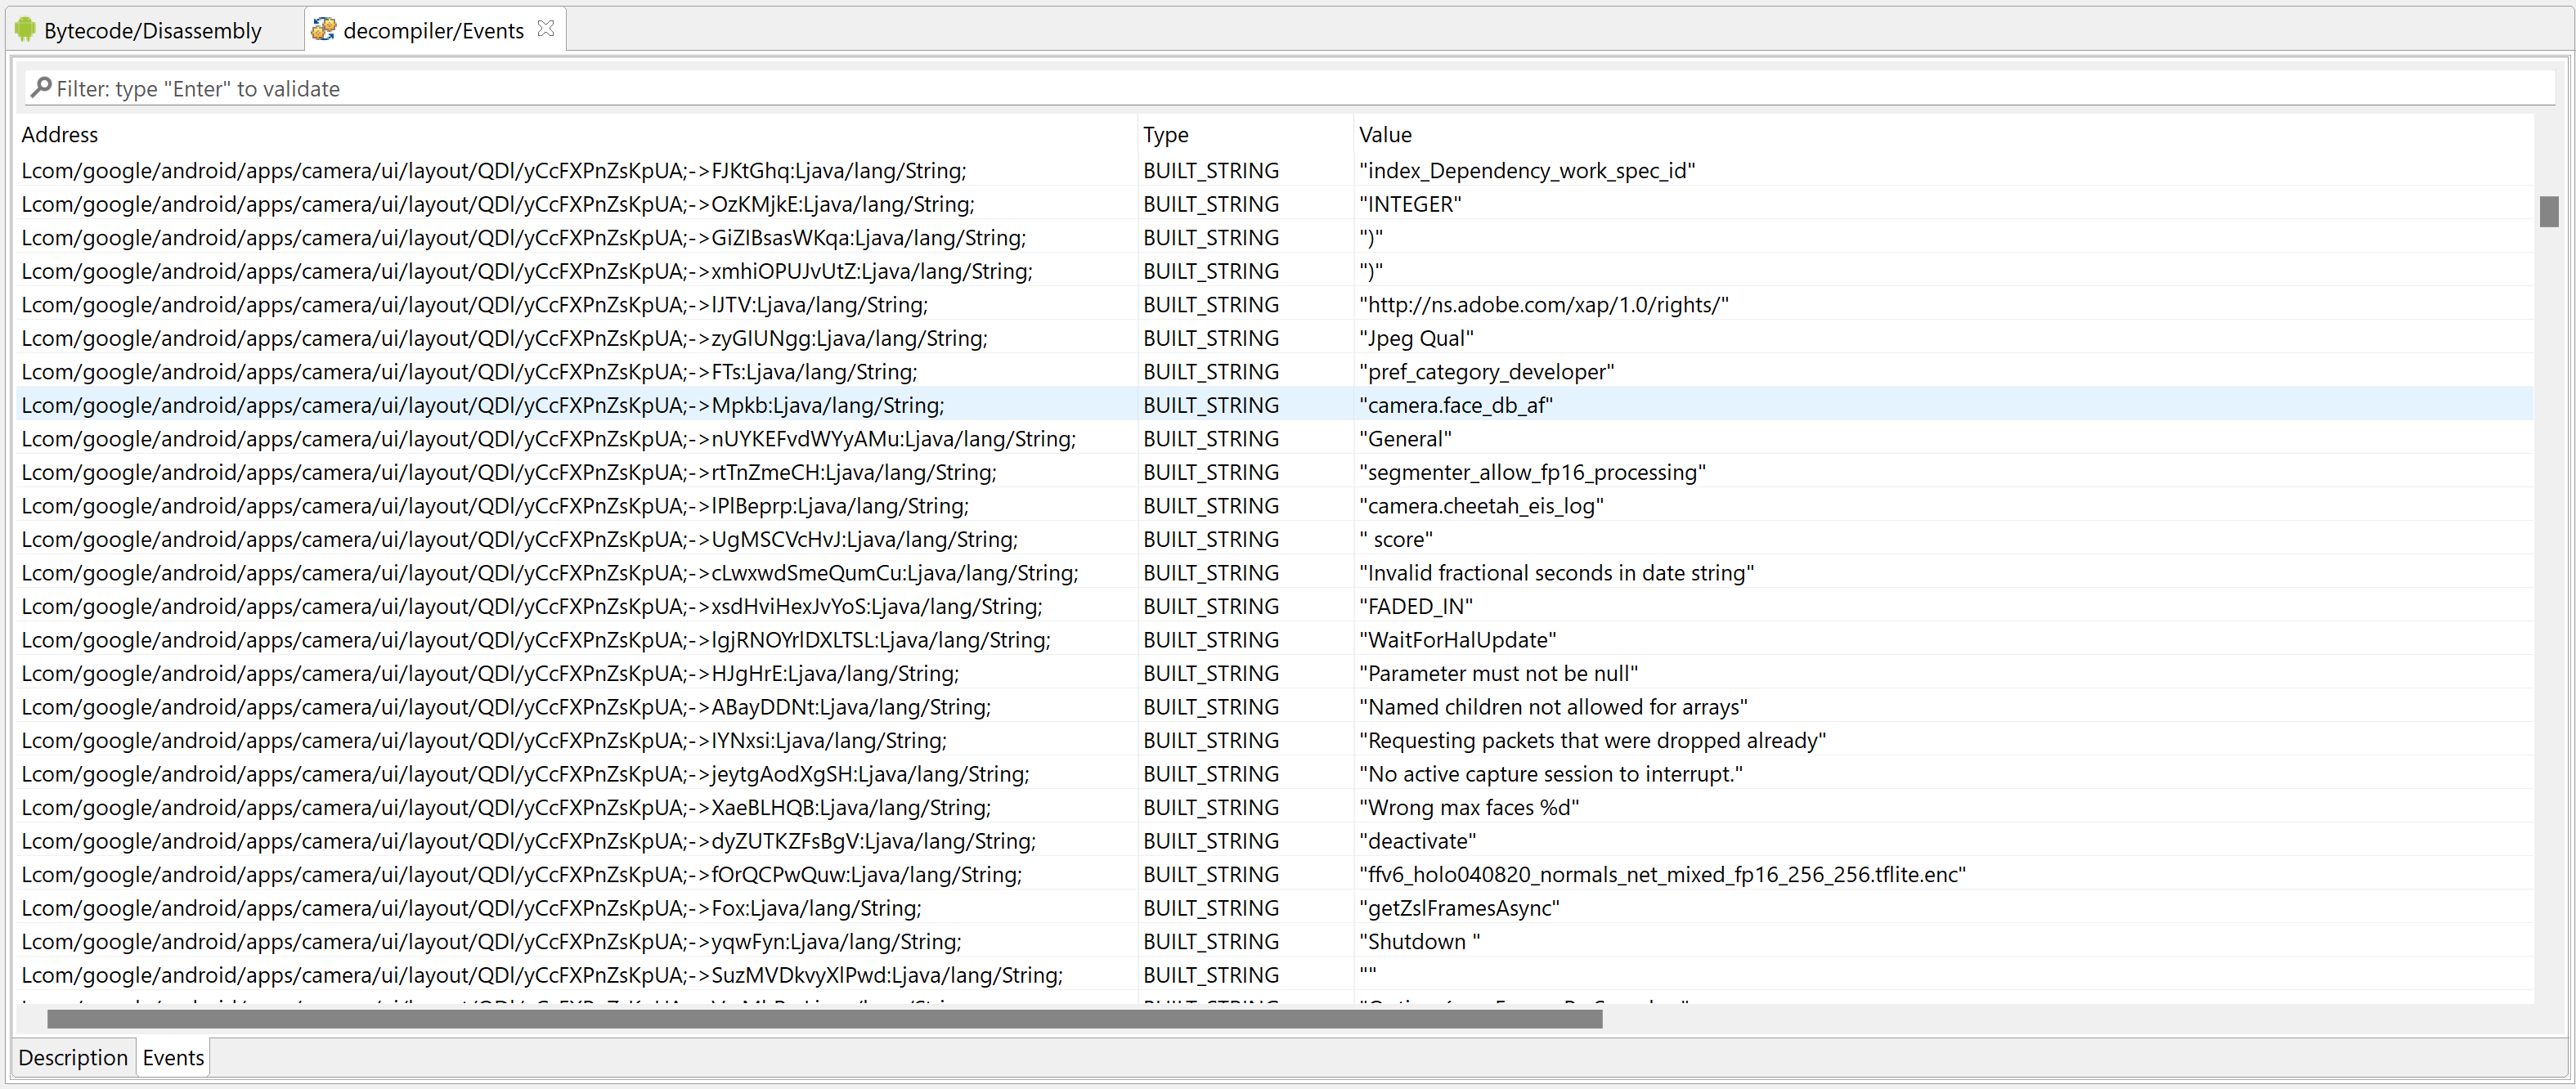
After loading an APK, the plugin may let the user know that the code was protected.Execute the “Recover removed Dex constants” plugin.The user will be asked to input the no-arg static method that should be simulated. If a suitable one is found, it may be pre-populated by the plugin.The execution can be lengthy, from several seconds to several minutes. Recovered strings are registered as fields comments as well as decompiler events in the relevant dexdec unit of your project.
Conclusion
That’s it for today. Make sure to update to JEB Pro 4.30 if you want to use those plugins.
I would encourage power-users to explore the JEB’s API, in particular IDState, EState/EEmulator and IEmulatedAndroid, if they want to experiment or work on code that requires specific hooks (dex hooks, jvm sandbox hooks, native emu hooks, native memory hooks – refer to the registerXxxHooks methods in IDState) for the emulators to operate properly.
Update: Oct 18 2023: as of JEB 5.4, JEB can parse Dart AOT snapshots version 2.10 to 3.1.
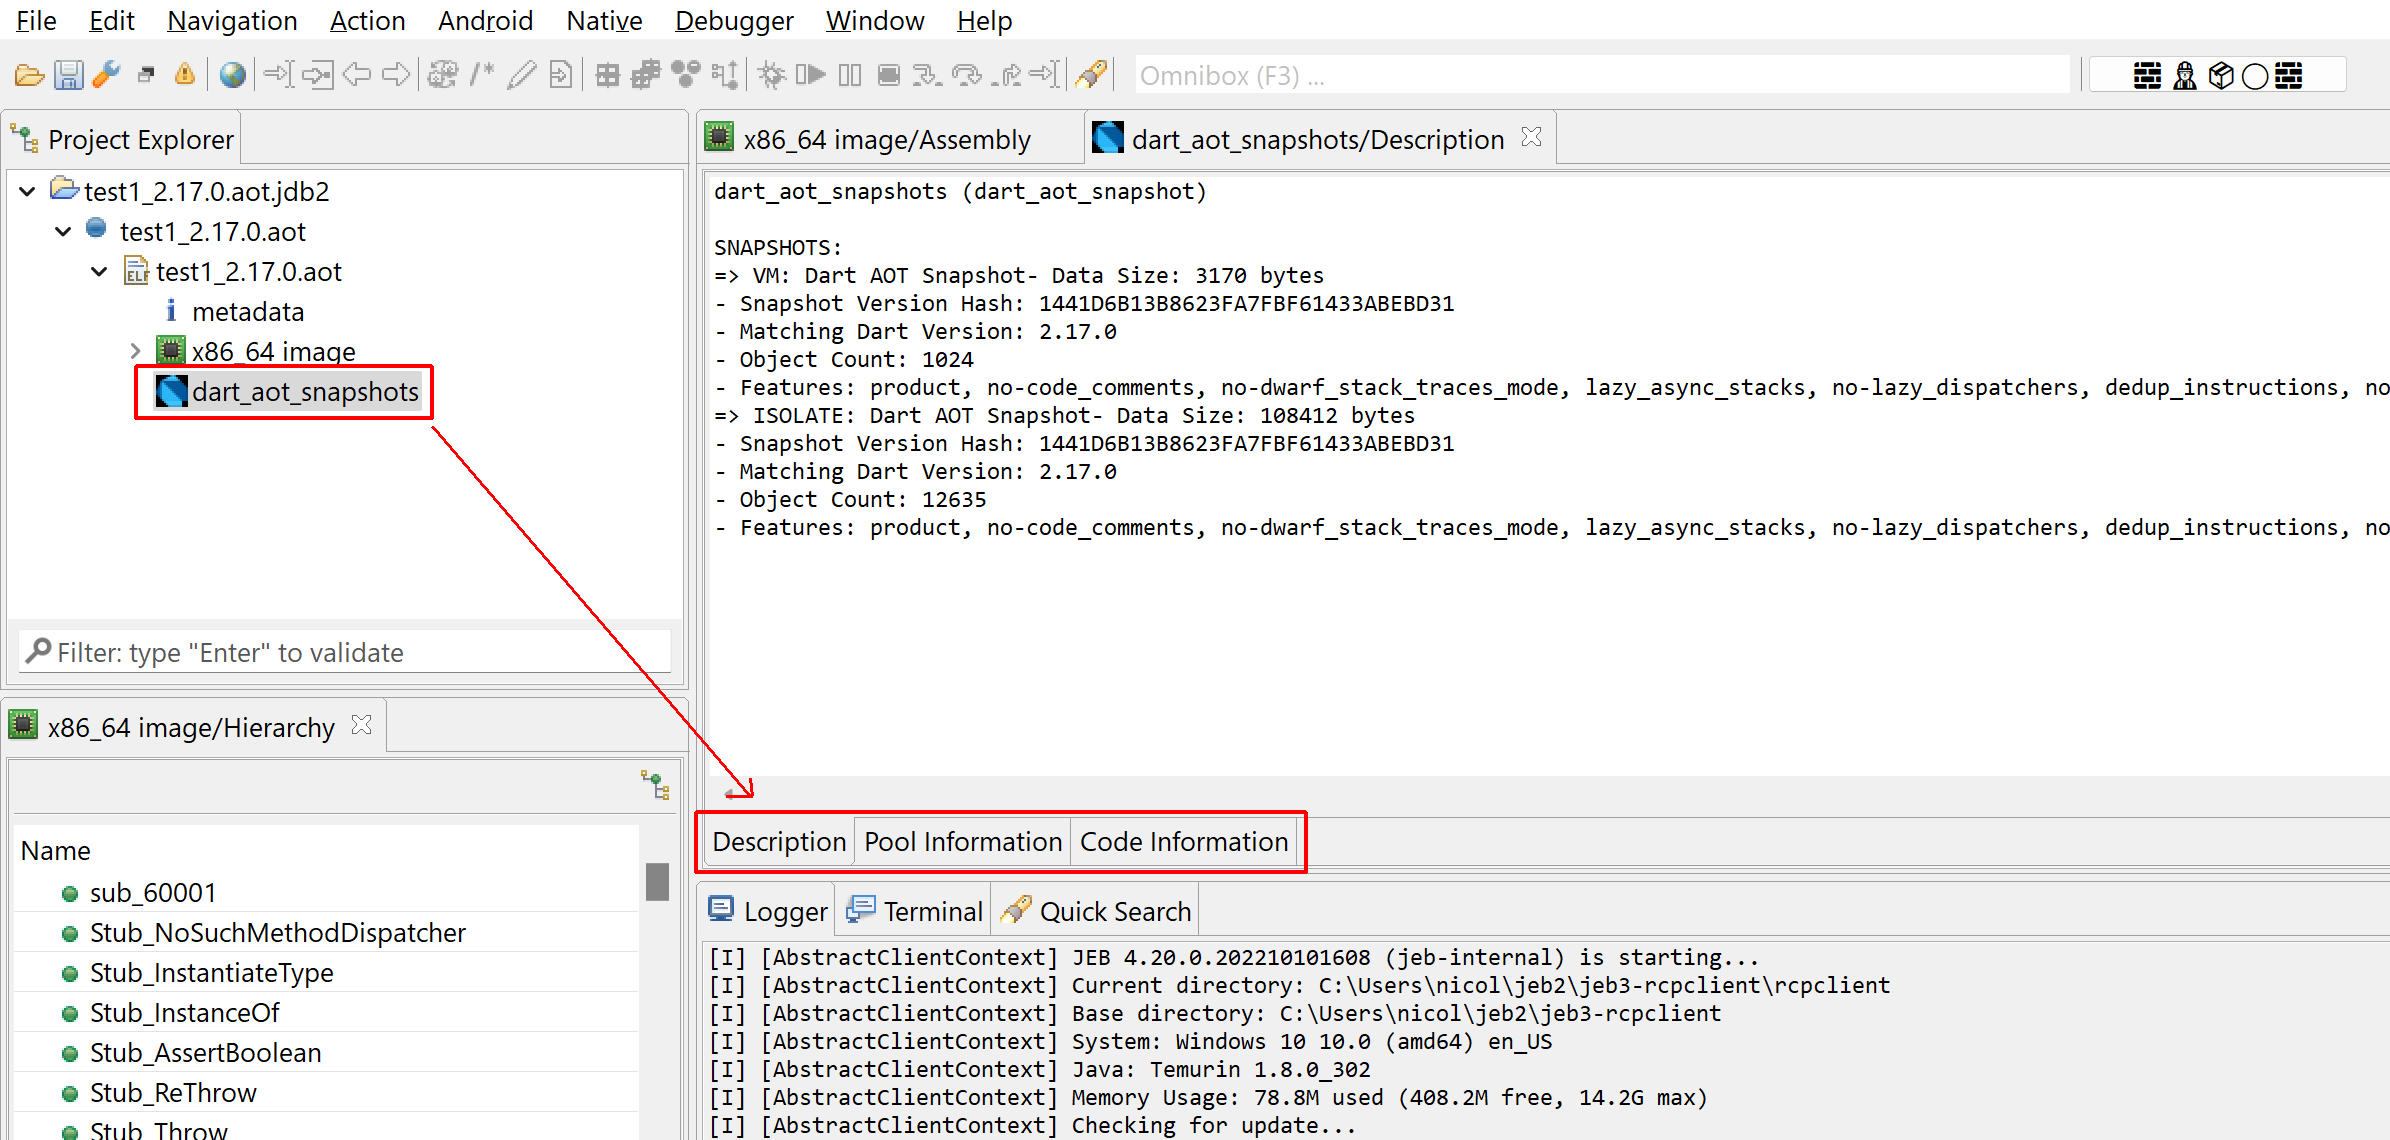
Update: Oct 5 2022: as of JEB 4.20, this plugin generates IDartAotUnit objects, easily accessible by API.
A “Dart AOT Snapshot” unit generated by the plugin (JEB >= 4.20), along with unit documents.
The original post can be found below:
JEB 4.17 ships with a Dart AOT (ahead-of-time) binary snapshot helper plugin to help with the analysis of pre-compiled Dart programs. A common use case for it may be to offer directions when reverse engineering Flutter apps compiled for Android x86/x64 or arm/aarch64 platforms.
Snapshots in ELF
Release-mode Flutter-based Android apps will generate AOT snapshots instead of shipping with bytecode or Dart code, like Debug-mode apps may choose to. The AOT snapshot contains a state of the Dart VM required to run the pre-compiled code.
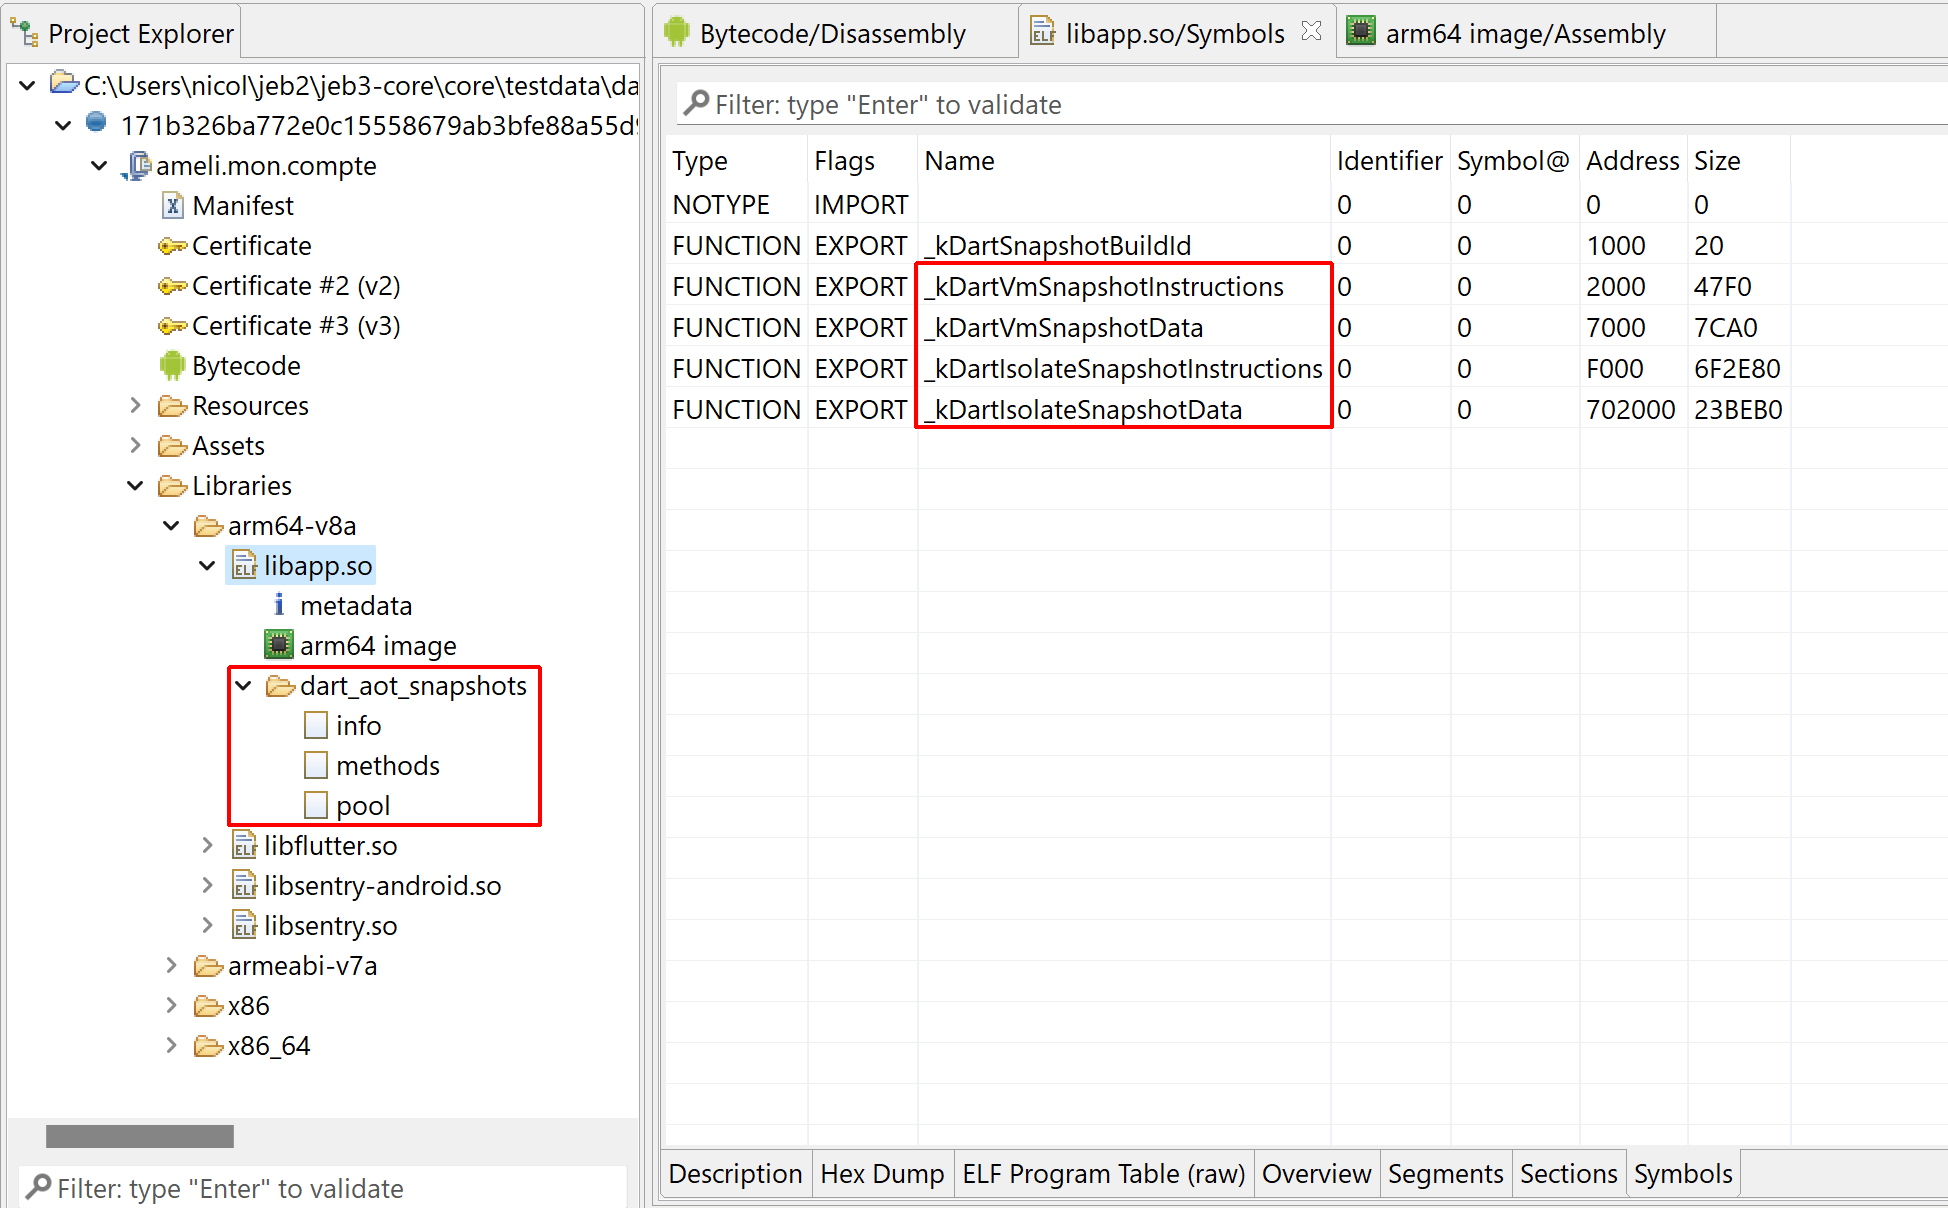
A snapshot is generally located in the lib/<arch>/libapp.so files of an APK. Since Dart may be used outside of Flutter, or since the file name or location may change, a reliable way to locate such files is to look for an ELF so exporting the following 4 symbols:
The XxxSnapshotInstructions symbols point to pre-compiled machine code. However, getting a starting point when dealing with stripped or obfuscated binaries may prove difficult. The XxxSnapshotData symbols point to Dart VM structures and objects that will be accessed by the executing code. That includes data elements such as pooled strings or arrays of immediate values. Snapshot data also include important metadata that will help restructure the hundreds or thousands of routines compiled in an AOT snapshot.
Using the Plugin
First, make sure that you are dealing Dart AOT snapshots or with a Flutter app containing precompiled AOT snapshots. Indeed other types of snapshots exist, such as JIT snapshots. The plugin does not provide help for those. In practice, non-AOT snapshots may be relatively easy to analyze, but you are unlikely to encounter them in the wild. Most Dart code or Flutter apps will be compiled and distributed in release mode. At best, some symbols and optional metadata may be left over. At worst, most will have been obfuscated (refer to Flutter’s --obfuscate option).
The plugin will automatically kick in and analyze AOT snapshots generated by Dart 2.10 (~Fall 2010) to Dart 2.17 (current at the time of writing). The analysis results will be placed in text sub-units located under the elf container unit. The code unit will be annotated (methods will be renamed, etc.), as explained in the next sections.
An aarch64 ELF file containing Dart AOT snapshots. The plugin generated reports in the dart_aot_snapshots sub-unit folder. Other information would be embedded into the native code unit itself (e.g. renamed routines, re-packaged routines, extra comments, etc.)is directly placed onto .
Textual Information
AOT snapshots contain lots of information. Deserializing them is relatively complicated, not to mention the fact that each revision of Dart changes the format — meaning that support will have to be added for Dart 2.18+ when that version ships… The plugin does not extract every potentially available bit of information. What is made available at this time is:
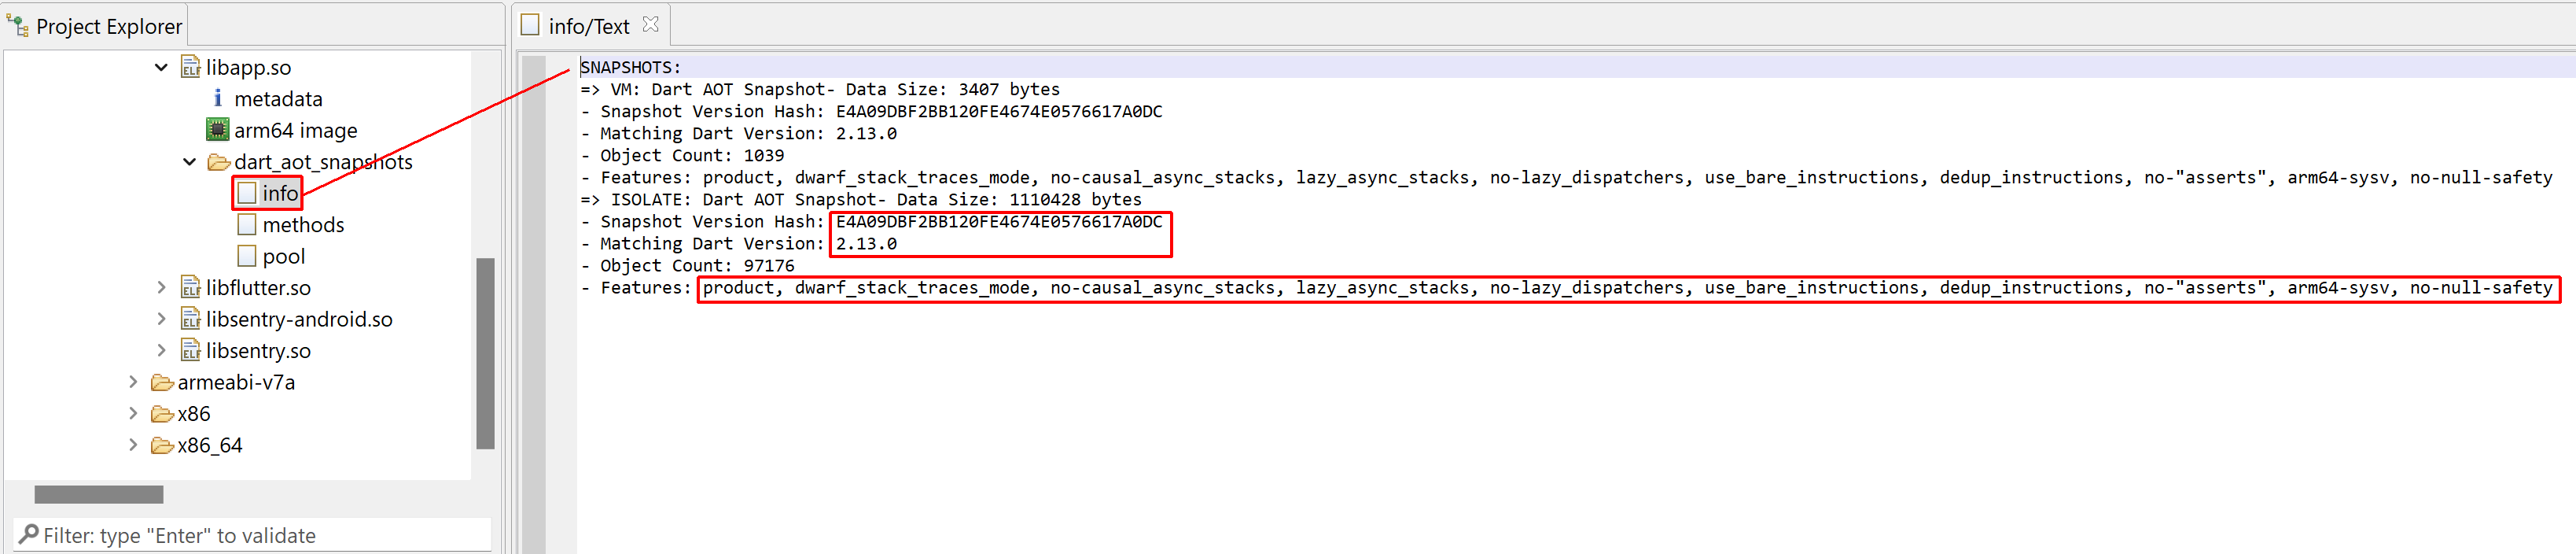
1- Basic information about the snapshots, such as version and features
Basic information about AOT snapshots
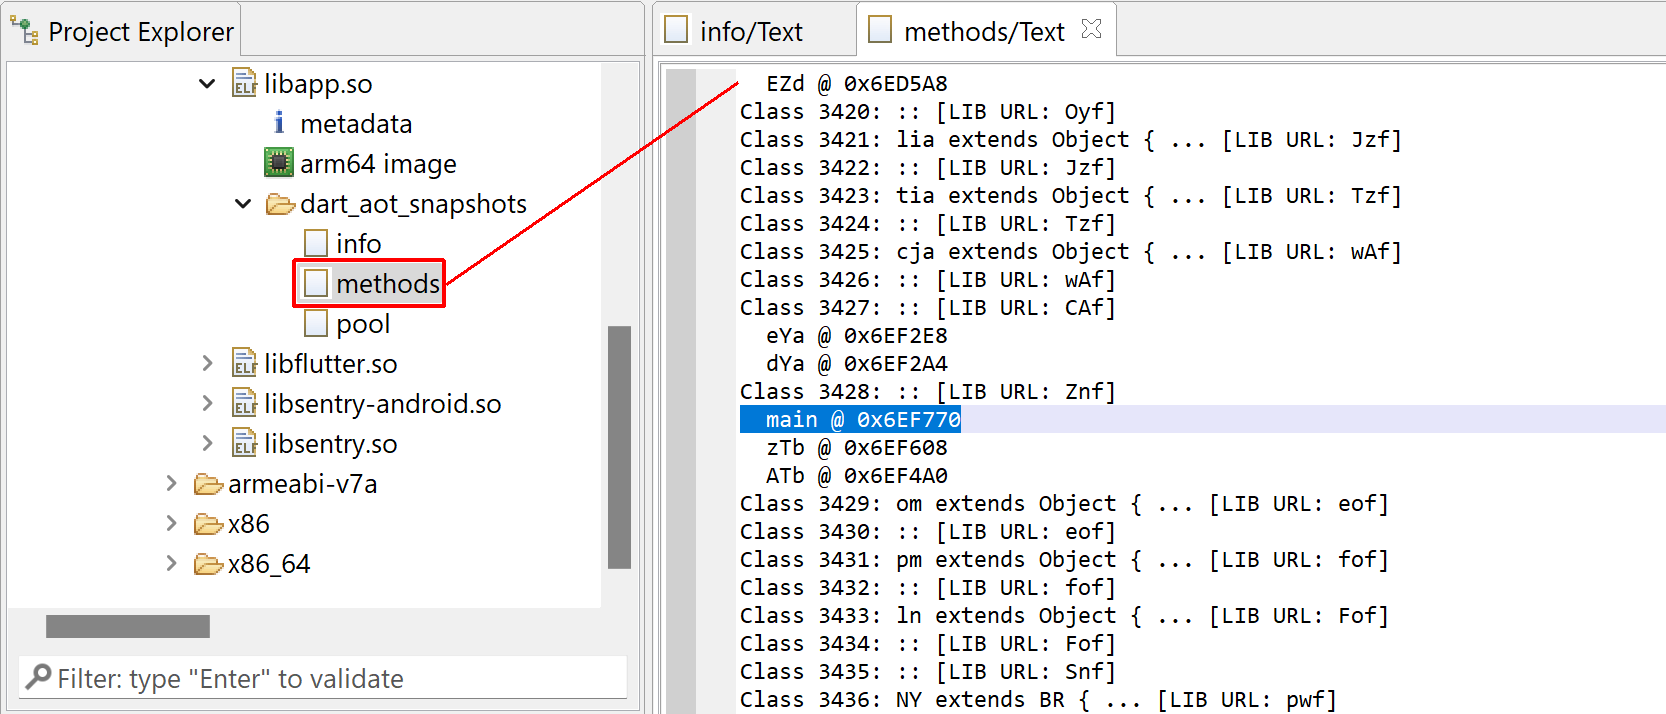
2- The list of libraries, classes, and methods
Classes, methods, libraries present a snapshot. Here, we can see that most names were obfuscated.
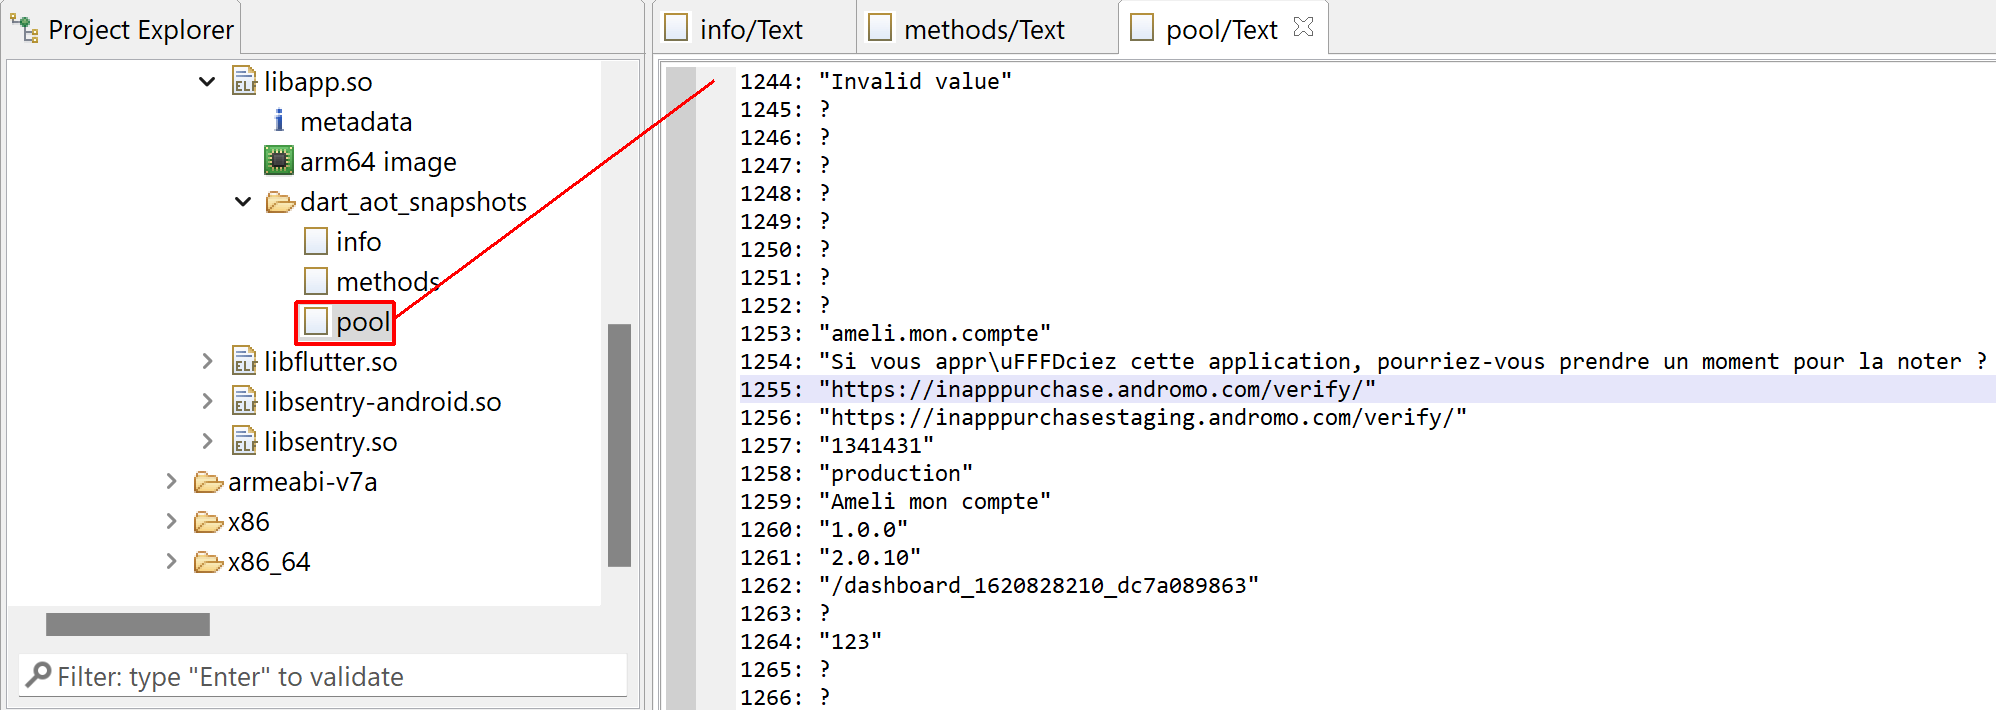
3- A view of the primary pool strings
Pooled items (including strings), some of them may be used by the natively executed code.
Code Annotations
Aside from static information, the plugin also attempts to:
1- Rename methods. Release builds will strip the method names from the ELF file. However, the AOT snapshot information references all AOT methods as well as their names, classes, library, etc. The names provided in the snapshot information will be applied to unnamed native routines.
You will be able to locate the main method, the entry-point of all Dart applications.
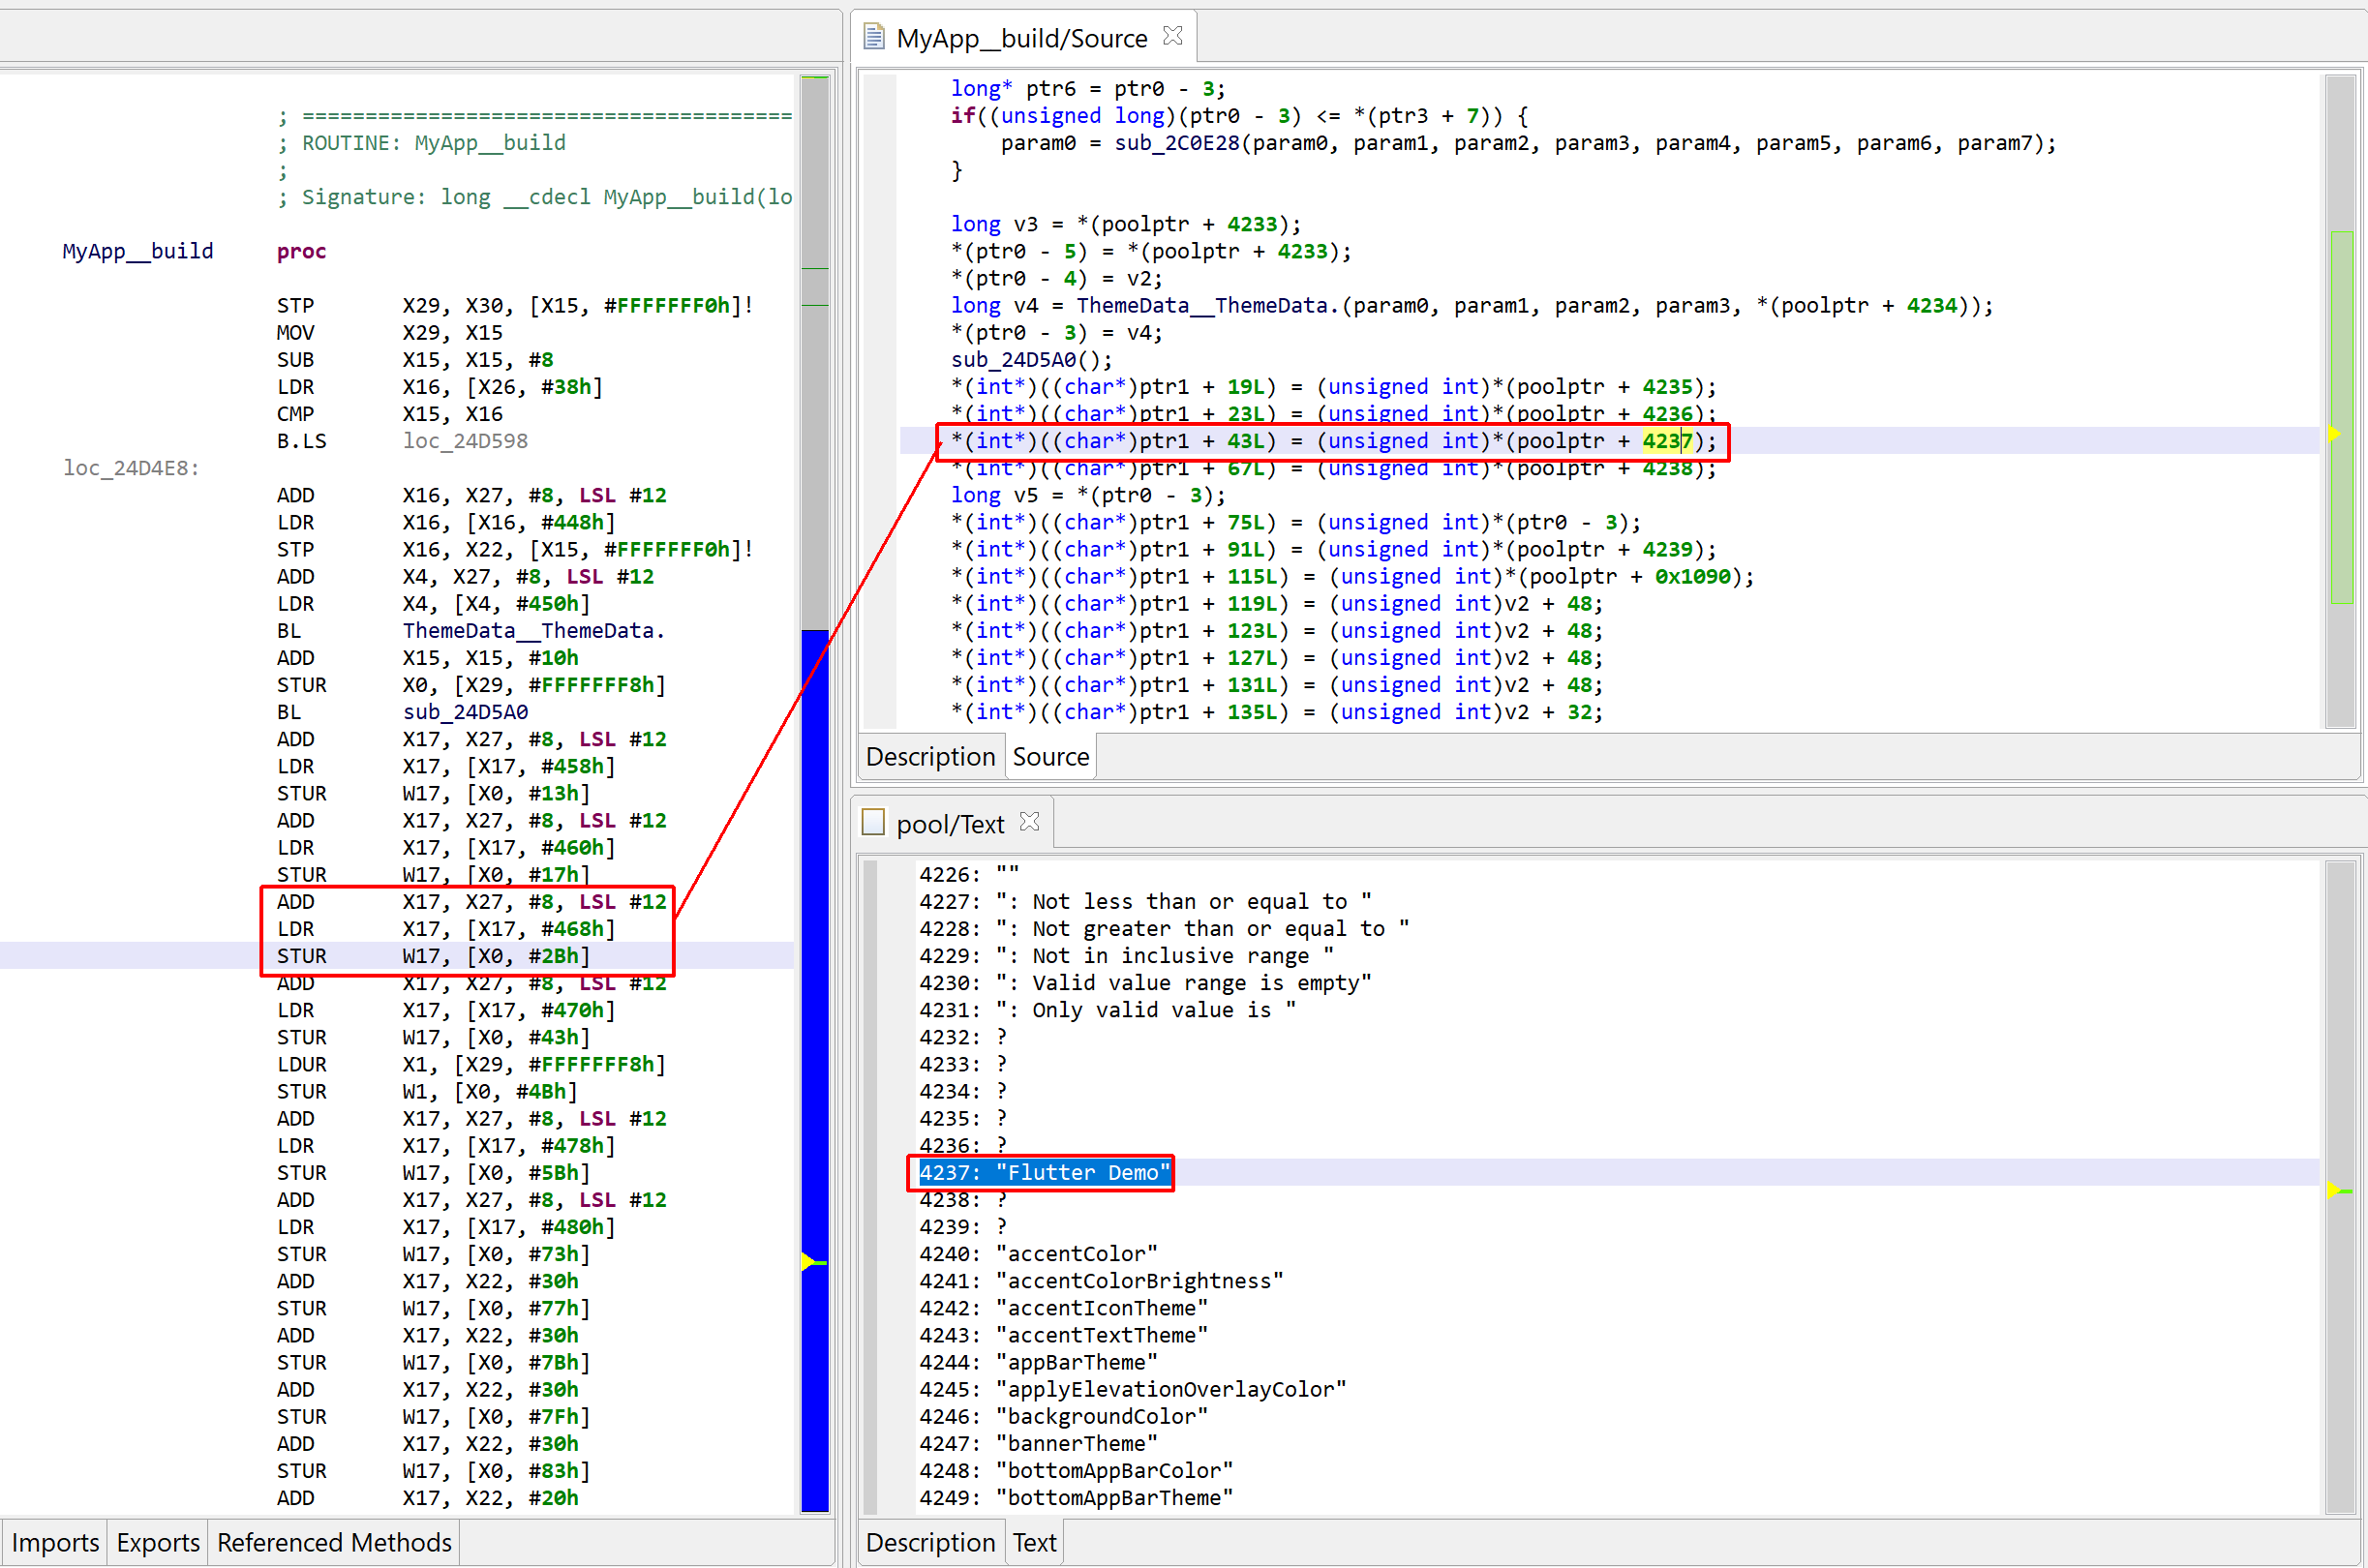
2- Annotate access to pooled strings. Native code accesses pooled items through a fixed register (containing an address into a pointer array to pooled elements). Below is a list of registers for the most common architectures:
Unfortunately, due to how the assembly code for arm64 binaries is generated, those comments cannot be generated on such binaries. However, decompilation will yield slightly more digestible code, e.g.:
Pooled string access on an arm64 binary
Caveats & Conclusion
We recommend analyzing x64 or arm64 binaries, instead of their 32-bit x86 or arm counterparts, since the plugin may not parse everything properly in the latter cases. In particular, the functions are not mapped properly for arm 32-bit snapshots generated by recent versions of Dart (2.16’ish and above).
More could be done, in particular related to calling conventions (for proper decompilation), pseudo-code refactoring and restructuring (via gendec IR plugins for instance), library code flagging (e.g. classes and their methods belonging to dart::<well_known_namespace> could be visually standing out). Such additional features will be added depending on the feedback and the needs of the users. Please let us know your feedback via the usual means (Twitter, email, Slack).
Finally, thanks to Axelle Apvrille (@cryptax) for flagging Dart as something that JEB may be able to help with!
Further Reading
Discussion of the internal formats and binary details of AOT snapshots was out-of-scope in this blog. Readers interested in digging further should check the following resources:
At this point, you should be comfortable to dig through the source code at https://github.com/dart-lang/sdk. It is the ultimate source of truth, look no further 🙂 In particular, the runtime/vm/*_snapshot.[h,cc] files (and related files, such as class_id.h or raw_object.h) contain most information about the serialized snapshot formats.
Bonus reading material: https://mrale.ph/dartvm/ to get a high-level understanding of the Dart VM.
One of the new exciting features coming with JEB 4.0 is a set of signatures to identify common native libraries in a compiler-agnostic fashion.
These “codeless” signatures were built to tackle an old reverse-engineering problem: the identification of common open-source libraries in executables. Because such libraries are compiled by the developers themselves, traditional code-based signatures — like our own SigLib — need to be re-generated with the same compiler setup than the developers, otherwise the signatures won’t match because the code differs.
Therefore, identifying open-source libraries with code-based signatures is a lots of effort for a small return, because each set of signatures only matches one compiler setup (compiler’s version, optimization level…), and there is a vast number of them!
We developed codeless signatures to identify open-source libraries without the burden of signatures re-generation for each compiler setup. We are currently shipping signatures for the following libraries:
OpenSSL, versions 0.9.8m to 1.1.1g
libcurl, versions 7.30.0 to 7.71.1
libssh2, versions 1.8.0, 1.8.2 and 1.9.0
bzip2, versions 1.0.6 and 1.0.8
zlib, versions 1.2.3, 1.2.8, 1.2.10 and 1.2.11
The signatures can be applied on any binary opened in JEB, through “Native > Codeless Signatures Libraries” menu.
We also ship an automatic library version identification tool (available from “Codeless Signature Libraries” dialog), which should help to decide which versions of the library was linked, when it not obvious.
In order to build such signatures we made some tradeoffs, notably by accepting to miss some routines and to have a few false positives. We believe JEB’s codeless signatures are particularly suitable when one is not interested into library’s internals, and therefore the only library routines whose name really matter are the ones used by the rest of the code (like when doing malware analysis).
Overall, our current experiments show promising results, for example we usually identify 50-60% of OpenSSL routines, with a false positives ratio of less than 2%, on a variety of architecture/compiler setups.
We will describe in details the internals of JEB’s codeless signatures in an upcoming whitepaper, but in the meantime we made a video to demonstrate how to use them:
We really encourage you to test JEB’s codeless signatures and report feedback through the usual channels:
Under some circumstances, JEB’s generic decompiler is able to detect inline decryptors, and subsequently attempt to emulate the underlying IR to generate plaintext data items, both in the disassembly view and, most importantly, decompiled views.1
This feature is available starting with JEB 4.0.3-beta. It makes use of the IREmulator object, available in the public API for scripting and plugins.
–
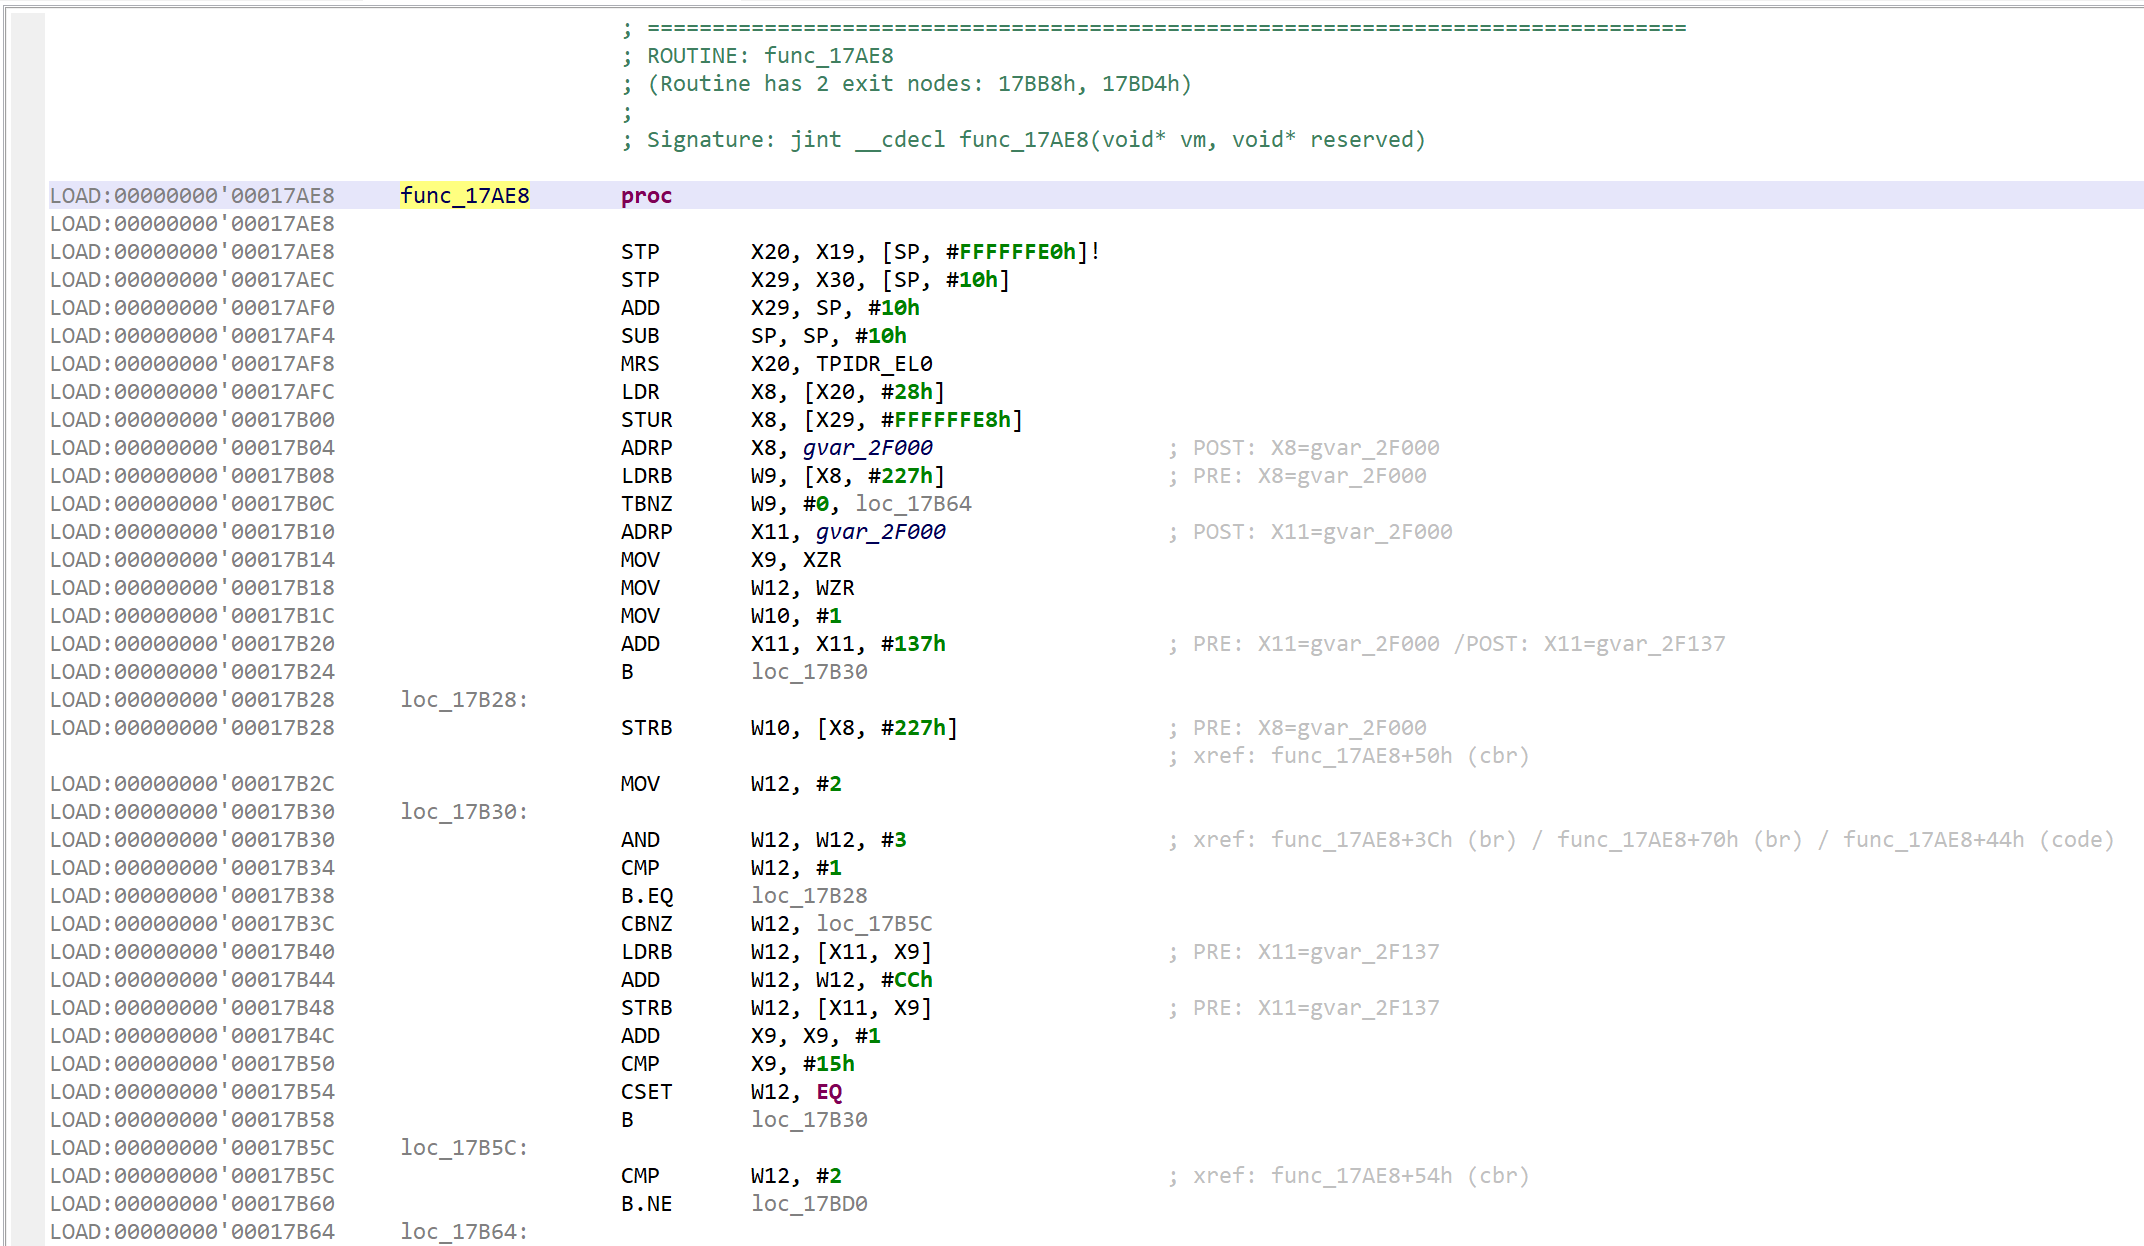
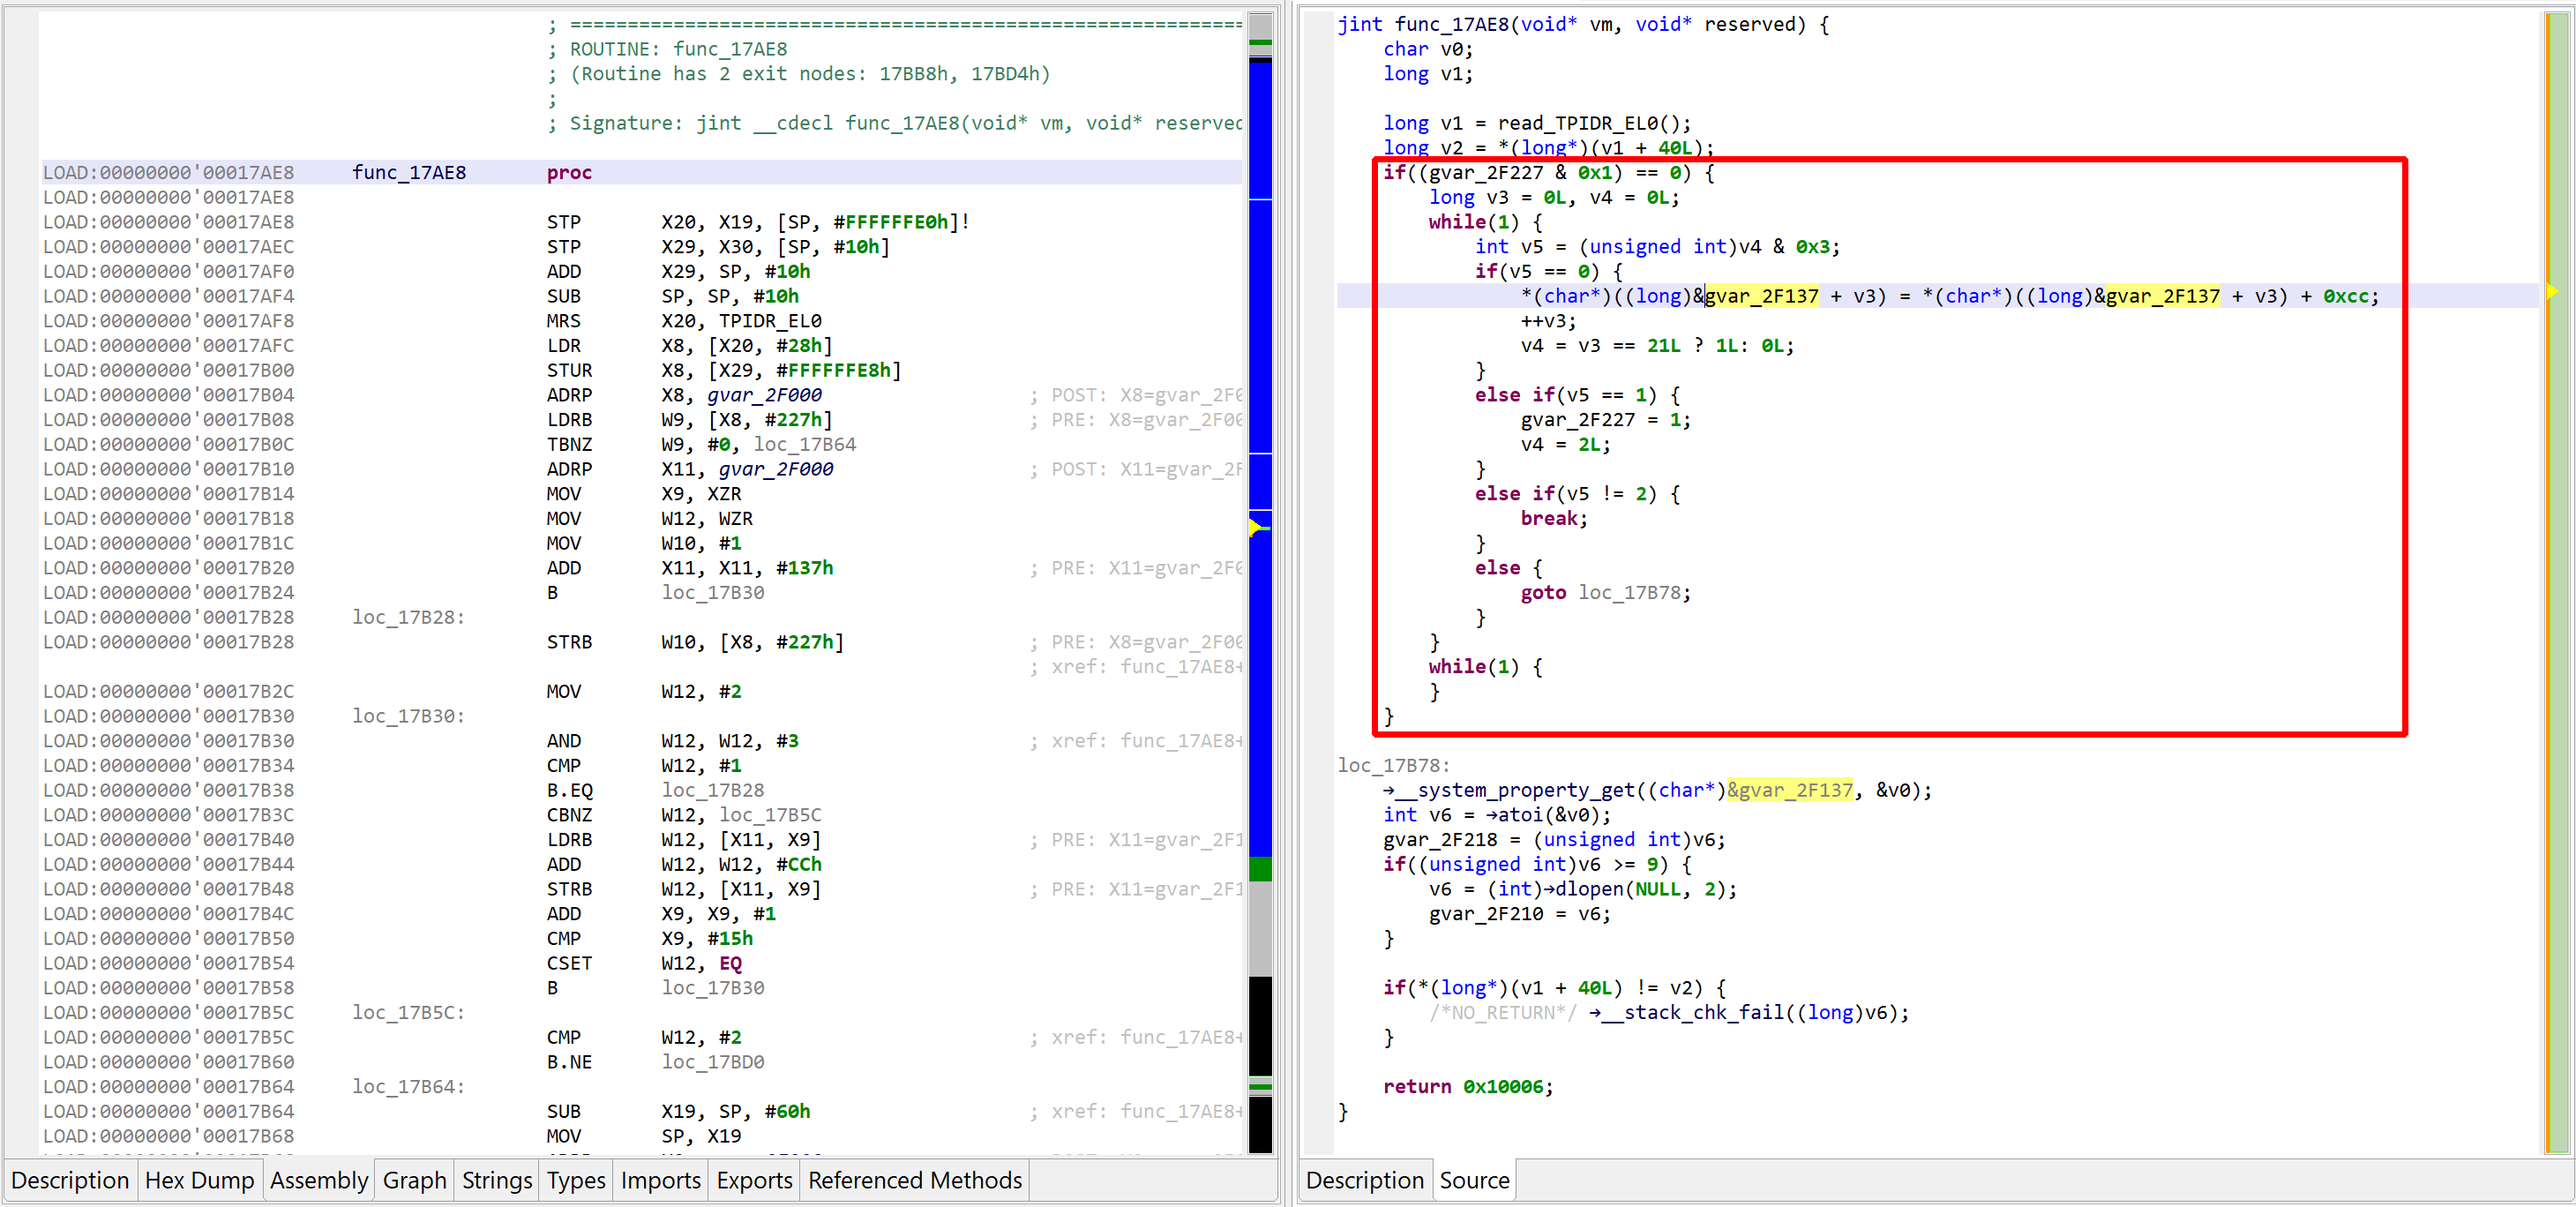
Here’s an example of a protected elf file2 (aarch64) that was encountered a few months ago:
Disassembly of the target routine
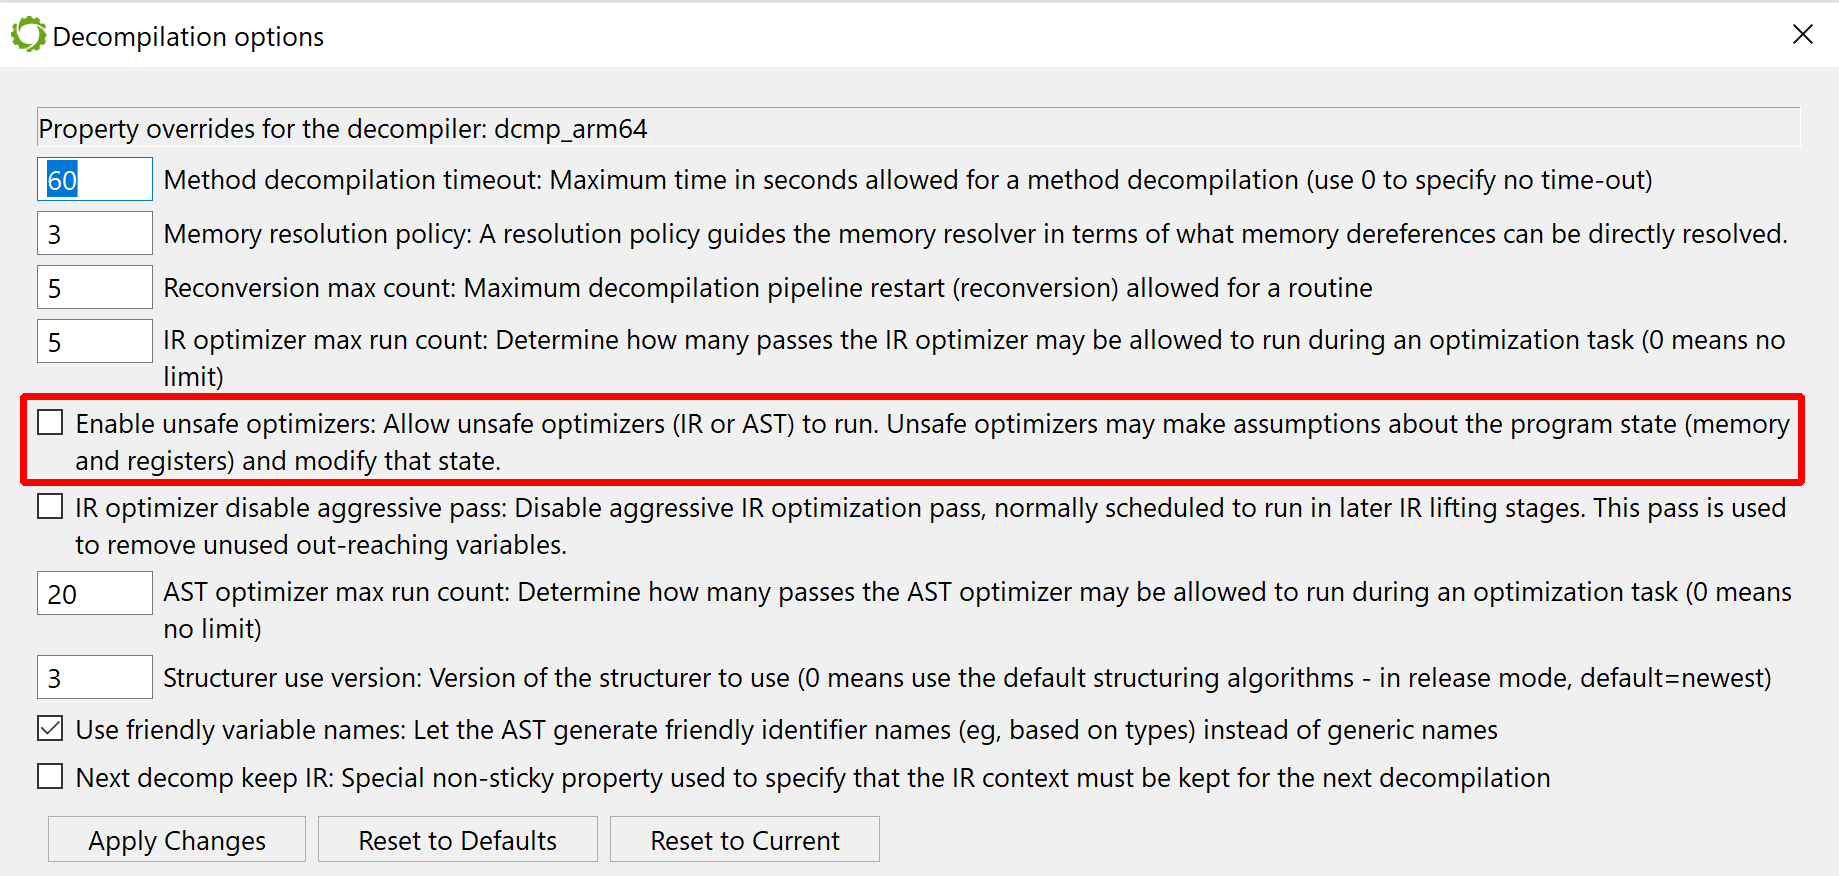
GENDEC’s unsafe optimizers are enabled by default. Let’s disable them before performing a first decompilation, in order to see what the inline decryptor looks like.
To bring up the decompilation options on-demand, use CTRL+TAB (or Command+TAB), or alternatively, menu Action, command Decompile with OptionsDecompilation #1: unsafe optimizers disabled
That decryptor’s control flow is obfuscated (flattened, controlled by the state variable v5). It is called once, depending on the boolean value at 0x2F227. Here, the decrypted contents is used by system_property_get.
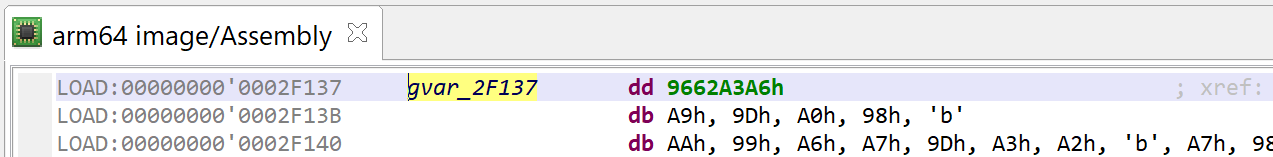
Below, the contents in virtual memory, pre-decryption:
Encrypted contents.
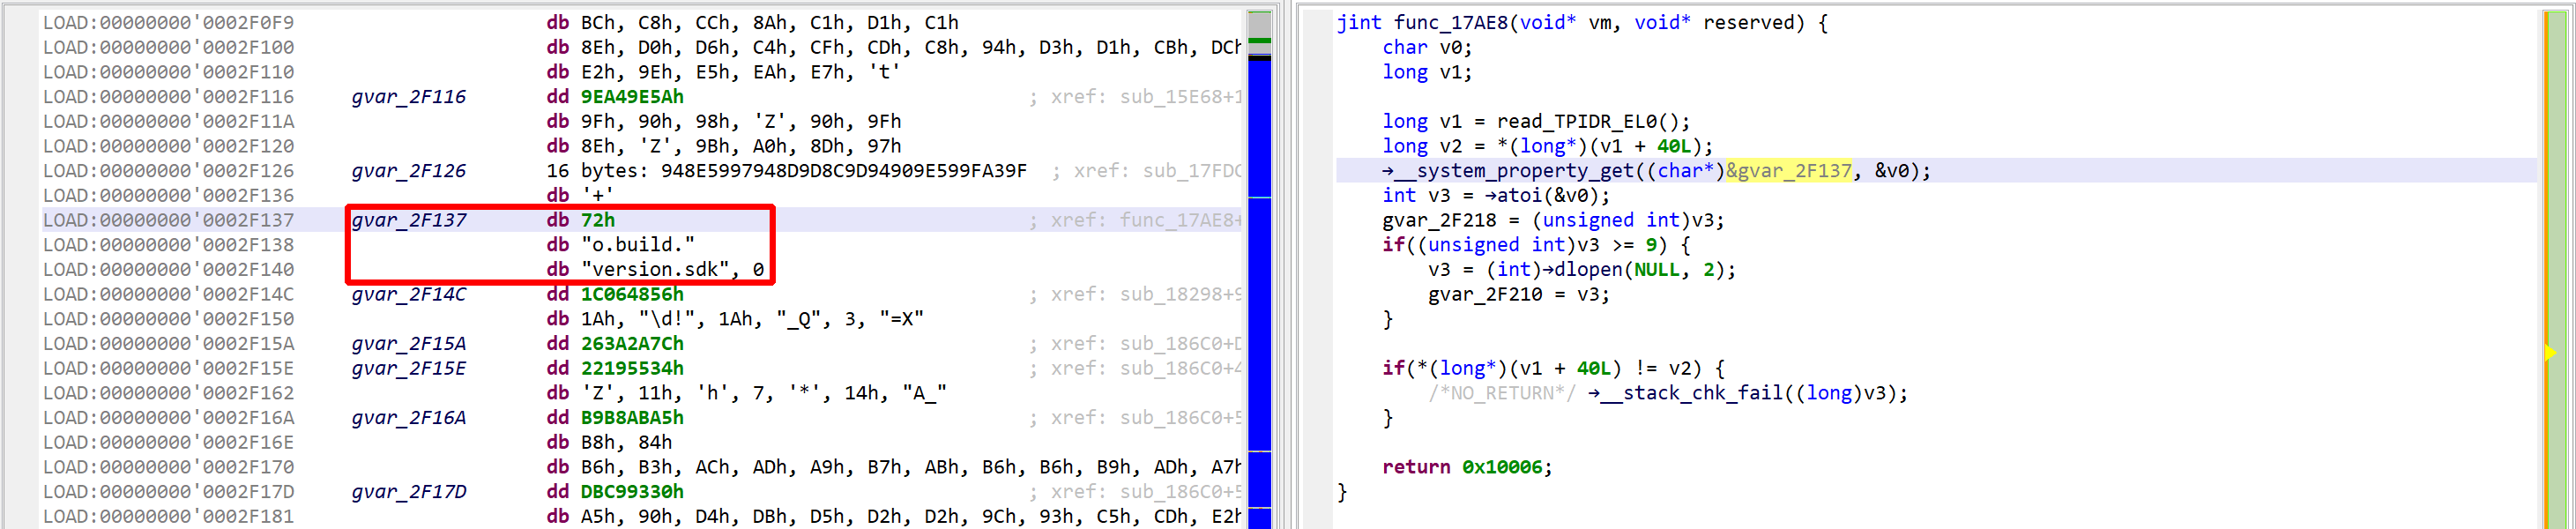
Let’s perform another decompilation of the same routine, with the unsafe optimizers enabled this time. GENDEC now will:
detect something that potentially could be decryption code
start emulating the underlying IR (not visible here, but you can easily read/write the Intermediate Representation via API) portion of code is emulated
collect and apply results
See the decrypted contents below. (An data item existed beforehand at 0x2F137, and the decompiler chose not to erase it.) The decompiled code on the right panel no longer shows the decryption loop: an optimizer has discarded it since it can no longer be executed.
Decompilation #2: unsafe optimizers enabled
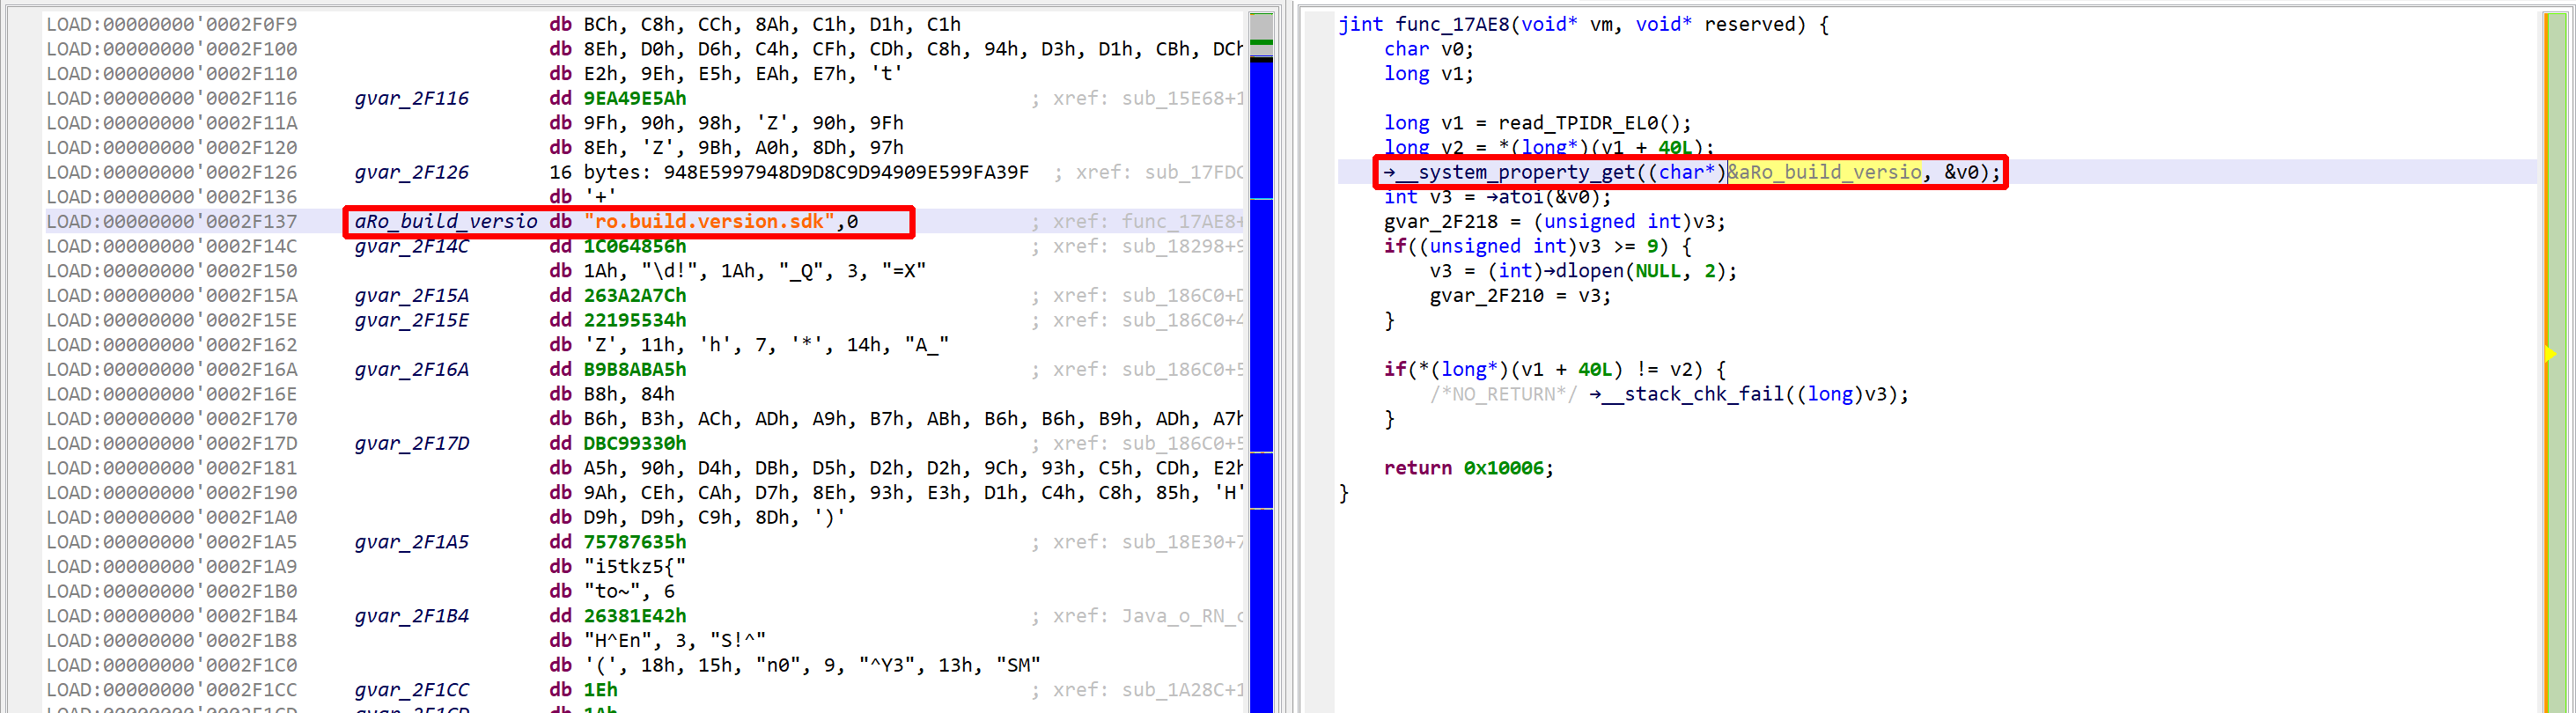
We may convert the data item (or bytes) to a string by pressing the A key (menu Native, command Create String). The decompiled code will pick it up and refresh the AST as well.
The final result looks like:
The VM and decompiled view show the decrypted code, “ro.build.version.sdk”
A few additional comments:
This optimizer is considered unsafe3because it is allowed to modify the VM of the underlying native code unit, as seen above.
The optimizer is generic (architecture-agnostic). It performs its work on the underlying IR mid-stage in the decompilation pipeline, when various optimizations are applied.
It makes use of public API methods only, mostly the IREmulator class. Advanced users can write similar optimizers if they choose to. (We will also publish the code of this optimizer on GitHub shortly, as it will serve as a good real-life example of how to use the IR emulator to write powerful optimizers. It’s slightly more than 100 lines of Java.)
We hope you enjoy using JEB 4 Beta. There is a license type for everyone, so feel free to try things out. Do not hesitate to reach out to us on Twitter, Slack, or privately over email! Thanks, and until next time 🙂
Users familiar with JEB’s Dex decompilers will remember that a similar feature was introduced to JEB 3 in 2020, for Android Dalvik code. ↩
sha256 43816c47315aab27e50e6f895774a7b86d591807179e1d3262446ab7d68a56ef also available as lib/arm64-v8a/libd.so in 309d848275aa128ebb7e27e570e5a2876977122625638630a6c61f7434b771c3 ↩
“unsafe” in the context of decompilation; unsafe here is not to be understood as, “could any code be executed on the machine”, etc. ↩
Disclaimer: a long time ago in our galaxy, we published part 1 of this blog post; then we decided to wait for the next major release of JEB decompiler before publishing the rest. A year and a half later, JEB 4.0 is finally out! So it is time for us to publish our complete adventure with MarsAnalytica crackme. This time as one blog covering the full story.
In this blog post, we will describe our journey toward analyzing a heavily obfuscated crackme dubbed “MarsAnalytica”, by working with JEB’s decompiled C code 1.
To reproduce the analysis presented here, make sure to update JEB to version 4.0+.
Part 1: Reconnaissance
MarsAnalytica crackme was created by 0xTowel for NorthSec CTF 2018. The challenge was made public after the CTF with an intriguing presentation by its author:
My reverse engineering challenge ‘MarsAnalytica’ went unsolved at #nsec18 #CTF. Think you can be the first to solve it? It features heavy #obfuscation and a unique virtualization design.
Given that exciting presentation, we decided to use this challenge mainly as a playground to explore and push JEB’s limits (and if we happen to solve it on the road, that would be great!).
The MarsAnalytica sample analyzed in this blog post is the one available on 0xTowel’s GitHub2. Another version seems to be available on RingZer0 website, called “MarsReloaded”.
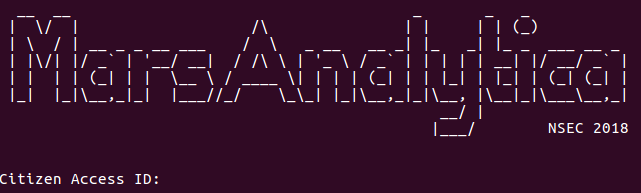
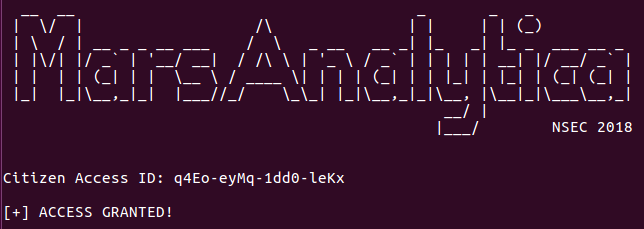
So, let’s examine the beast! The program is a large x86-64 ELF (around 10.8 MB) which, once executed, greets the user like this:
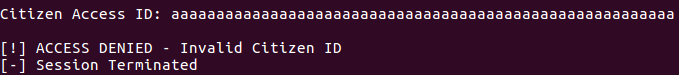
Inserting a dummy input gives:
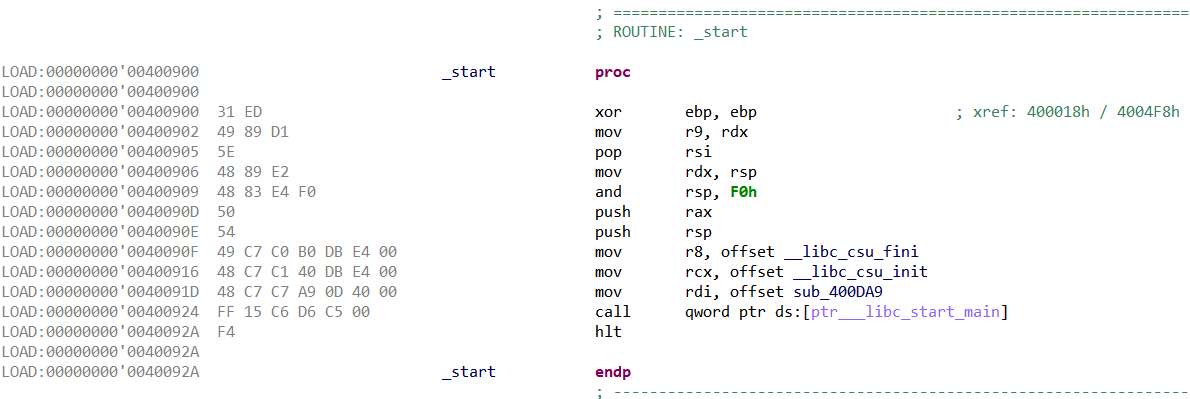
It appears we have to find a correct Citizen ID! Now let’s open the executable in JEB. First, the entry point routine:
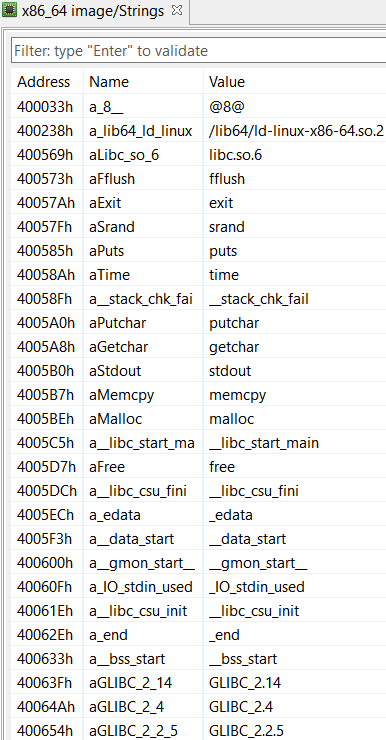
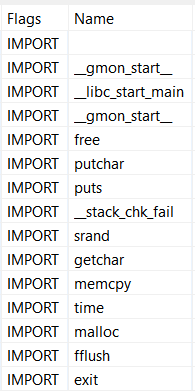
A few interesting imports: getchar() to read user input, and putchar() and puts() to write. Also, some memory manipulation routines, malloc() and memcpy(). No particular strings stand out though, not even the greeting message we previously saw. This suggests we might be missing something.
Actually, looking at the native navigation bar (right-side of the screen by default), it seems JEB analyzed very few areas of the executable:
Navigation Bar (green is cursor’s location, grey represents area without any code or data)
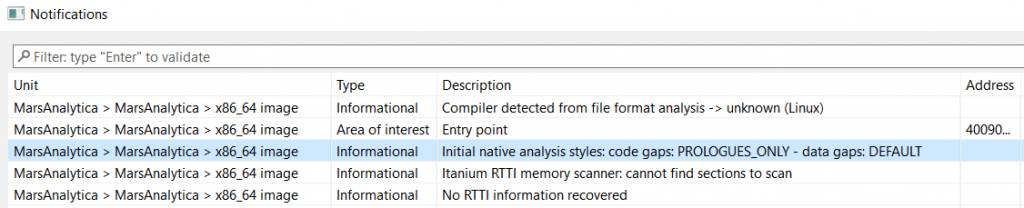
To understand what happened let’s first look at JEB’s notifications window (File > Notifications):
Notifications Window
An interesting notification concerns the “Initial native analysis styles”, which indicates that code gaps were processed in PROLOGUES_ONLY mode (also known as a “conservative” analysis). As its name implies, code gaps are then disassembled only if they match a known routine prologue pattern (for the identified compiler and architecture).
This likely explains why most of the executable was not analyzed: the control-flow could not be safely followed and unreferenced code does not start with common prologue patterns.
Why did JEB used conservative analysis by default? JEB usually employs aggressive analysis on standard Linux executables, and disassembles (almost) anything within code areas (also known as “linear sweep disassembly”). In this case, JEB went conservative because the ELF file looks non-standard (eg, its sections were stripped).
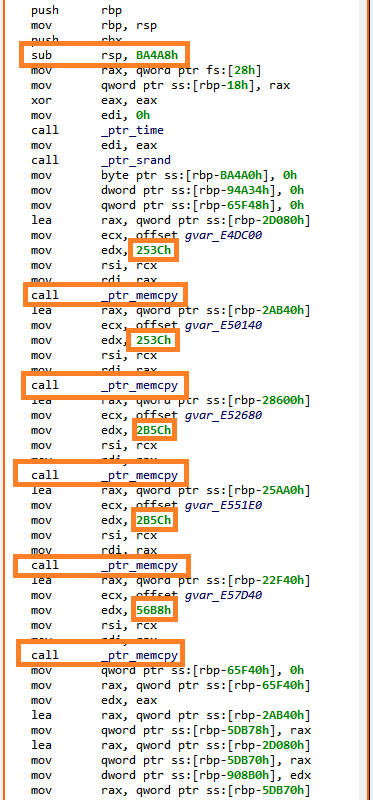
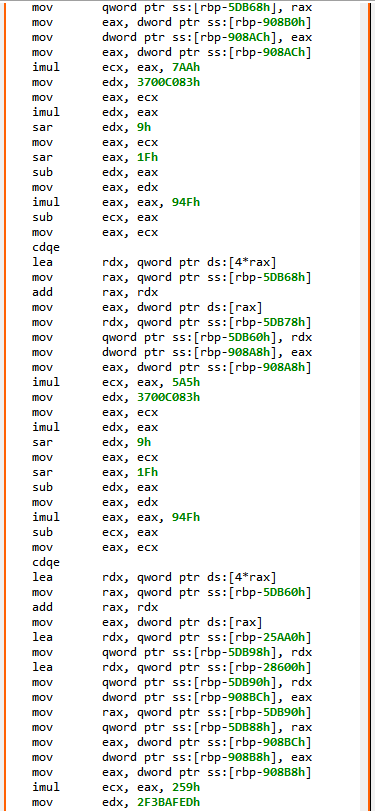
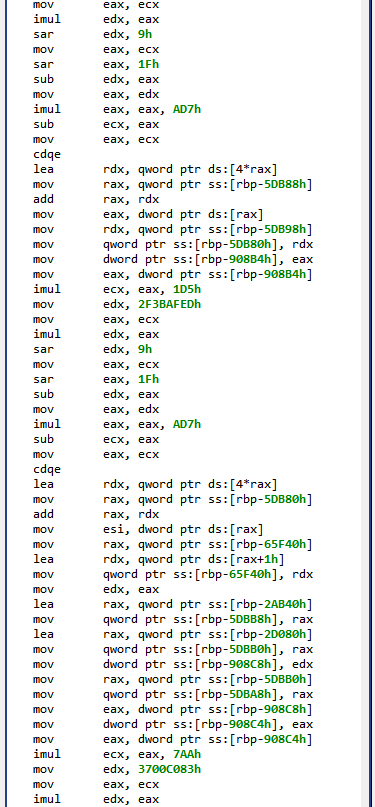
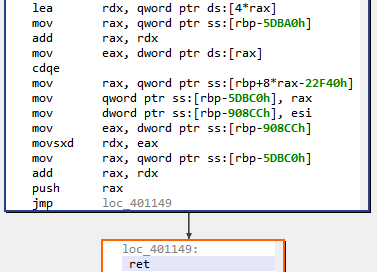
So, first a few memcpy() to copy large memory areas onto the stack, followed by series of “obfuscated” computations on these data. The main() routine eventually returns on an address computed in rax register. In the end, JEB disassembler was not able to get this value, hence it stopped analyzing there.
Let’s open the binary in JEB debugger, and retrieve the final rax value at runtime: 0x402335. We ask JEB to create a routine at this address (“Create Procedure”, P), and end up on very similar code. After manually following the control-flow, we end up on very large routines — around 8k bytes –, with complex control-flow, built on similar obfuscated patterns.
And yet at this point we have only seen a fraction of this 10MB executable… We might naively estimate that there is more than 1000 routines like these, if the whole binary is built this way (10MB/8KB = 1250)!
Most obfuscated routines re-use the same stack frame (initialized in main() with the series of memcpy()). In others words, it looks like a very large function has been divided into chunks, connected through each other by obfuscated control flow computations.
At this point, it seems pretty clear that a first objective would be to properly retrieve all native routines. Arguably the most robust and elegant way to do that would be to follow the control flow, starting from the entry point routine . But how to follow through all these obfuscated computations?
Explore The Code (At C Level)
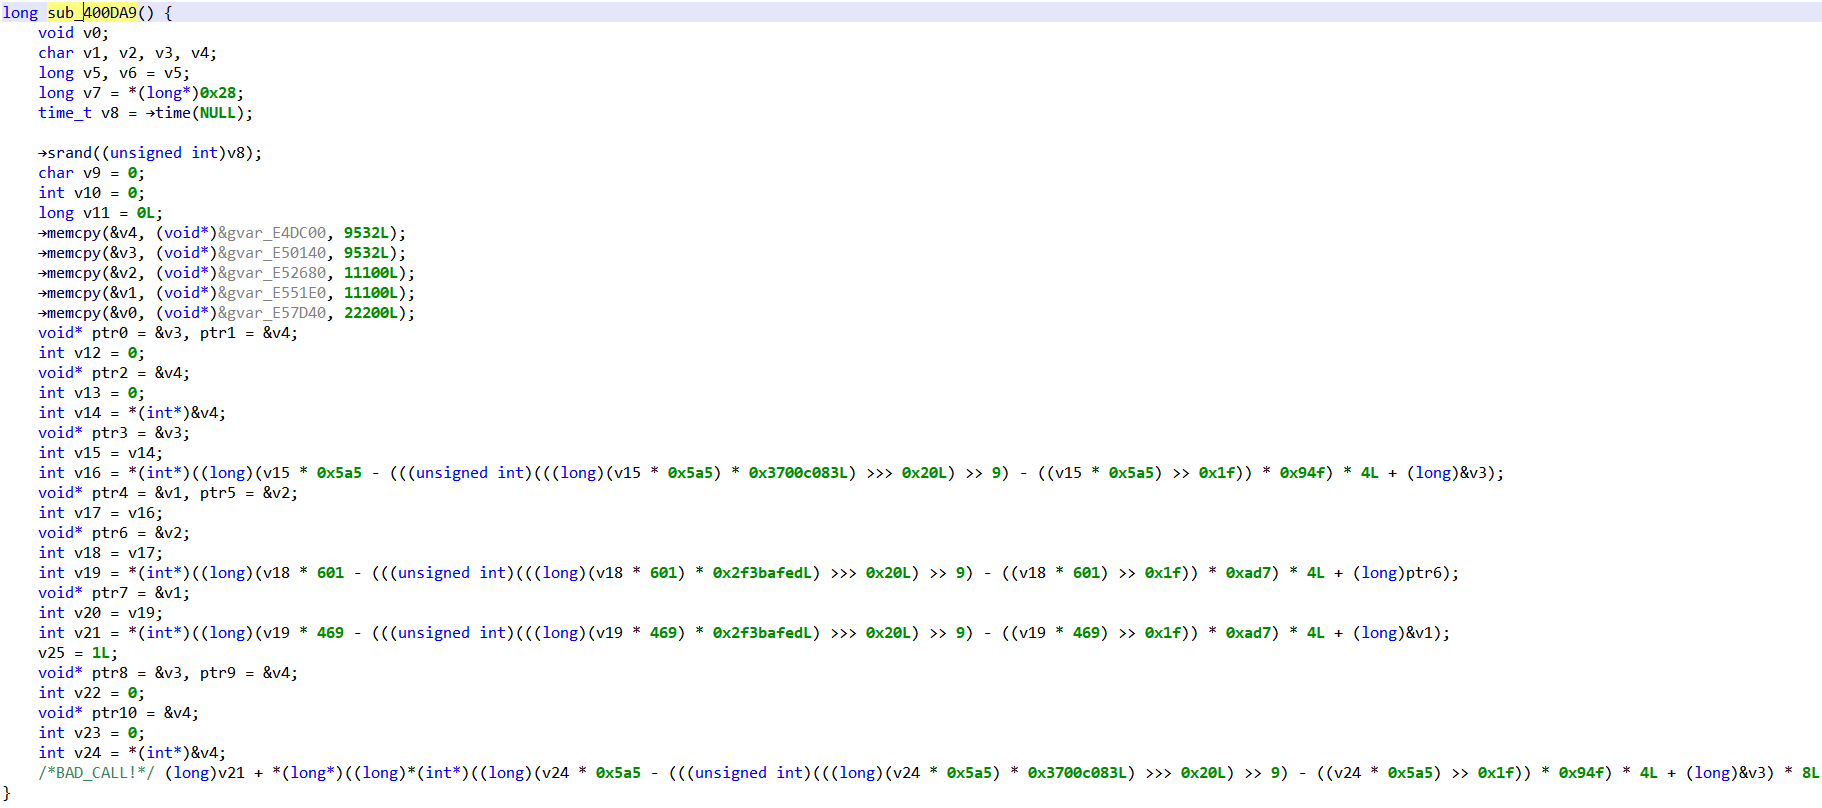
Let’s now take a look at the pseudo-C code produced by JEB for those first routines. For example, here is main():
Decompiled main()
Overall, around 40 lines of C code, most of them being simple assignments, and a few others being complex operations. In comparison to the 200 non-trivial assembly instructions previously shown, that’s pretty encouraging.
What Do We Know
Let’s sum up what we noticed so far: MarsAnalytica’s executable is divided into (pretty large) handler routines, each of them passing control to the next one by computing its address. For that purpose, each handler reads values from a large stack, make a series of non-trivial computations on them, then write back new values into the stack.
As originally mentioned by 0xTowel, the crackme author, it looks like a virtual-machine style obfuscation, where bytecodes are read from memory, and are interpreted to guide the execution. It should be noted that virtual machine handlers are never re-executed: execution seems to go from lower to higher addresses, with new handlers being discovered and executed.
Also, let’s notice that while the executable is strongly obfuscated, there are some “good news”:
There does not seem to be any self-modifying code, meaning that all the code is statically visible, we “just” have to compute the control-flow to find it.
JEB decompiled C code looks (pretty) simple, most C statements are simple assignments, except for some lengthy expression always based on the same operations; the decompilation pipeline simplified away parts of the complexity of the various assembly code patterns.
There are very few subroutines called (we will come back on those later), and also a few system APIs calls, so most of the logic is contained within the chain of obfuscated handlers.
What Can We Do
Given all we know, we could try to trace MarsAnalytica execution by implementing a C emulator working on JEB decompiled code. The emulator would simulate the execution of each handler routine, update a memory state, and retrieve the address of the next handler.
The emulator would then produce an execution trace, and provide us access to the exact memory state at each step. Hence, we should find at some point where the user’s input is processed (typically, a call to getchar()), and then hopefully be able to follow how this input gets processed.
The main advantage of this approach is that we are going to work on (small) C routines, rather than large and complex assembly routines.
There are a few additional reasons we decided to go down that road:
– The C emulator would be architecture-independent — several native architectures are decompiled to C by JEB –, allowing us to re-use it in situations where we cannot easily execute the target (e.g. MIPS/ARM).
– It will be an interesting use-case for JEB public API to manipulate C code. Users could then extend the emulator to suit their needs.
– This approach can only work if the decompilation is correct, i.e. if the C code remains faithful to the original native code. In other words, it allows to “test” JEB decompilation pipeline’s correctness, which is — as a JEB’s developer — always interesting!
Nevertheless, a major drawback of emulating C code on this particular executable, is that we need the C code in the first place! Decompiling 10MB of obfuscated code is going to take a while; therefore this “plan” is certainly not the best one for time-limited Capture-The-Flag competitions.
Part 2: Building a (Simple) C Emulator
The emulator comes as a JEB back-end plugin, whose code can be found on our GitHub page. It starts in CEmulatorPlugin.java, whose logic can be roughly summarized as the following pseudo-code:
In this part we will focus on emulate()method. This method’s purpose is to simulate the execution of a given C routine from a given machine state, and to provide in return the final machine state at the end of the routine.
Decompiled C Code
First thing first, let’s explore what JEB decompiled code looks like, as it will be emulate() input. JEB decompiled C code is stored in a tree-structured representation, akin to an Abstract Syntax Tree (AST).
For example, let’s take the following C function:
int myfunction()
{
    int a = 1;
    while(a < 3) {
        a = a + 1;
    }
    return a;
}
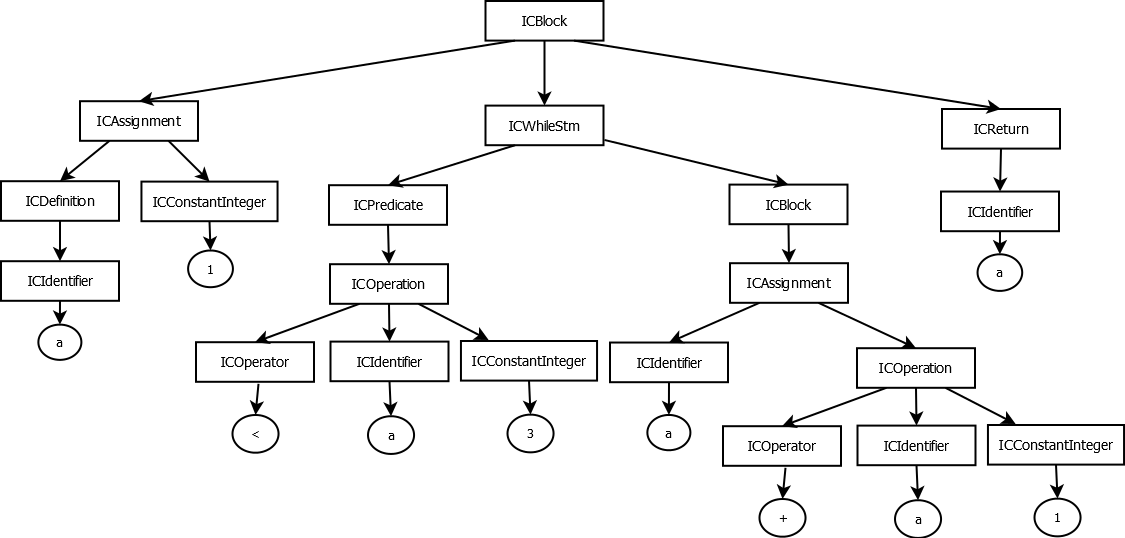
The JEB representation of myfunction body would then be:
AST Representation (rectangles are JEB interfaces, circles are values)
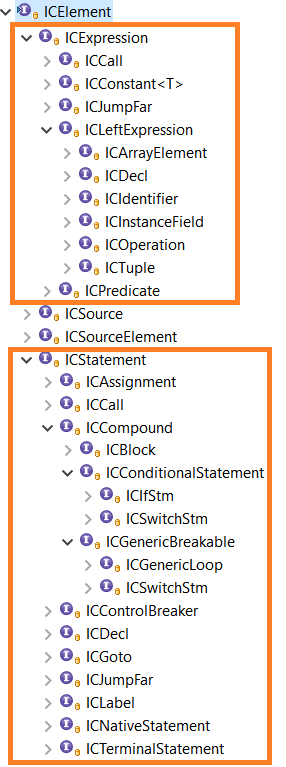
As of JEB 4.0, the hierarchy of interfaces representing AST elements (i.e. nodes in the graph) is the following:
AST ICElement Hierarchy
Two parts of this hierarchy are of particular interest to us, in the context of building an emulator:
ICExpression represents C expressions, for example ICIdentifier (a variable), or ICOperation (any operation). Our emulator is going to evaluate those expressions, i.e. assign concrete values to them.
While an AST provides a precise representation of C elements, it does not provide explicitly the control flow. That is, the order of execution of statements is not normally provided by an AST, which rather shows how some elements contain others from a syntactic point-of-view.
In order to simulate a C function execution, we are going to need the control flow. So here is our first step: compute the control flow of a C method and make it usable by our emulator.
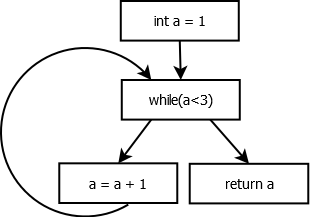
To do so, we implemented a very simple Control-Flow Graph (CFG), which is computed from an AST. The code can be found in CFG.java, please refer to the documentation for the known limitations.
Here is for example the CFG for the routine previously presented myfunction():
myfunction() CFG
Why does JEB does not provide a CFG for decompiled C code? Mainly because at this point JEB decompiler does not need it. Most important optimizations are done on JEB Intermediate Representation — for which there is indeed a CFG. On the other hand, C optimizations are mainly about “beautifying” the code (i.e. pure syntactic transformations), which can be done on the AST only 3.
Before digging into the emulation logic, let’s see how emulator state is represented and initialized.
Emulator State
The emulator state is a representation of the machine’s state during emulation; it mainly comprehends the state of the memory and of the CPU registers.
The memory state is a IVirtualMemory object — JEB interface to represent virtual memory state. This memory state is created with MarsAnalytica executable initial memory space (set by JEB loader), and we allocate a large area at an arbitrary address to use as the stack during emulation:
// initialize from executable memory
memory = nativeUnit.getMemory();

// allocate large stack from BASE_STACK_POINTER_DEFAULT_VALUE (grows downward)
VirtualMemoryUtil.allocateFillGaps(memory, BASE_STACK_POINTER_DEFAULT_VALUE - 0x10_0000, 0x11_0000, IVirtualMemory.ACCESS_RW);
The CPU registers state is simply a Map from register IDs — JEB specific values to identify native registers — to values:
Update the state according to the statement semantic, i.e. propagate all side-effects of the statement to the emulator state.
Determine which statement should be executed next; this might involve evaluating some predicates.
For example, let’s examine the logic to emulate a simple assignment like a = b + 0x174:
void evaluateAssignment(ICAssignment assign) {
  // evaluate right-hand side
  Long rightValue = evaluateExpression(assign.getRight());

  // assign to left-hand side
  state.setValue(assign.getLeft(), rightValue);
}
The method evaluateExpression() is in charge of getting a concrete value for a C expression (i.e. anything under ICExpression), which involves recursively processing all the subexpressions of this expression.
In our example, the right-hand side expression to evaluate is an ICOperation (b + 0x17). Here is the extract of the code in charge of evaluating such operations:
If b is a local variable, i.e. mapped in stack memory, the method ICIdentifier.getAddress() provides us its offset from the stack base address. Also note that an ICIdentifier has an associated ICType, which provides us the variable’s size (through the type manager, see emulator’s getTypeSize()).
Finally, evaluating constant 0x17 in the operation b + 0x17 simply means returning its raw value:
For statements with more complex control flow than an assignment, the emulator has to select the correct next statement from the CFG. For example, here is the emulation of a while loop wStm (ICWhileStm):
// if predicate is true, next statement is while loop body...
if(evaluateExpression(wStm.getPredicate()) != 0) {
   return cfg.getNextTrueStatement(wStm);
}
// ...otherwise next statement is the one following while(){..}
else {
   return cfg.getNextStatement(wStm);
}
In MarsAnalytica there are only a few system APIs that get called during the execution. Among those APIs, only memcpy() is actually needed for our emulation, as it serves to initialize the stack (remember main()). Here is the API emulation logic:
Long simulateWellKnownMethods(ICMethod calledMethod,
            List<ICExpression> parameters) {

        if(calledMethod.getName().equals("→time")) {
            return 42L; // value does not matter
        }
        else if(calledMethod.getName().equals("→srand")) {
            return 37L; // value does not matter
        }
        else if(calledMethod.getName().equals("→memcpy")) {
            ICExpression dst = parameters.get(0);
            ICExpression src = parameters.get(1);
            ICExpression n = parameters.get(2);
            // evaluate parameters concrete values
            [...REDACTED...]
            state.copyMemory(src_, dst_, n_);
            return dst_;
          }
       }
}
Demo Time
The final implementation of our tracer can be found in our GitHub page. Once executed, the plugin logs in JEB’s console an execution trace of the emulated methods, each of them providing the address of the next one:
Good news everyone: the handlers addresses are correct (we double-checked them with a debugger). In other words, JEB decompilation is correct and our emulator remains faithful to the executable logic. Phew…!
Part 3: Solving The Challenge
Plot Twist: It Does Not Work
The first goal of the emulator was to find where user’s input is manipulated. We are looking in particular for a call to getchar(). So we let the emulator run for a long time, and…
…it never reached a call to getchar().
The emulator was correctly passing through the obfuscated handlers (we regularly double-checked their addresses with a debugger), but after a few days the executed code was still printing MarsAnalytica magnificent ASCII art prompt (reproduced below).
MarsAnalytica Prompt
After investigating, it appears that characters are printed one by one with putchar(), and each of these calls is in the middle of one heavily obfuscated handler, which will be executed once only. More precisely, after executing more than one third of the whole 10MB, the program is still not done with printing the prompt!
As mentioned previously, the “problem” with emulating decompiled C code is that we need the decompiled code in the first place, and decompiling lots of obfuscated routines takes time…
Let’s Cheat
Ok, we cannot reach in a decent time the point where the user’s input is processed by the program. But the execution until this point should be deterministic. What if… we start the emulation at the point where getchar() is called, rather than from the entry-point?
In other words, we are going to assume that we “found” the place where user’s input starts to be processed, and use the emulator to analyze how this input is processed.
To do so, we used GDB debugger to set a breakpoint on getchar() and dumped both stack and heap memories at this point 5. Then, we extended the emulator to be able to initialize its memory state from stack/heap memory dumps, and change emulation start address to be the first call to getchar().
What Now?
At this point getchar() is called to get the first input character, so we let the emulator simulate this API by returning a pseudo-randomly chosen character, such that we can follow the rest of the execution. After 19 calls to getchar() we finally enter the place where user’s input is processed. Hooray…
Then, we let the emulator run for a whole day, which provided the execution trace we will be working on for the rest of this blog. After digging into the trace we noticed that input characters were passed as arguments to a few special routines.
Introducing The Stack Machine
When we first skimmed through MarsAnalytica code, we noticed a few routines that seemed specials for two reasons:
While obfuscated routines are executed only once and in a linear fashion (i.e. from low to high memory addresses), these “special” routines are at the very beginning of the executable and are called very often during the execution.
These routines’ code is not obfuscated and seems to be related with memory management at first sight.
For example, here is JEB decompiled code for the first of them (comments are ours):
long sub_400AAE(unsigned long* param0, int param1) {
    long result;
    unsigned long* ptr0 = param0;
    int v0 = param1;

    if(!ptr0) {
        result = 0xffffffffL;
    }
    else {
        // allocate new slot
        void* ptr1 = →malloc(16L);
        if(!ptr1) {
            /*NO_RETURN*/ →exit(0);
        }

        // set value in new slot
        *(int*)((long)ptr1 + 8L) = v0;

        // insert new slot in first position
        *(long*)ptr1 = *ptr0;
        *ptr0 = ptr1;
        result = 0L;
    }

    return result;
}
What we have here is basically a “push” operation for a stack implemented as a chained list (param0 is a pointer to the top of the stack, param1 the value to be pushed).
Each slot of the stack is 16 bytes, with the first 8 bytes being a pointer to the next slot and the next 4 bytes containing the value (remaining 4 bytes are not used).
It now seemed clear that these special routines are the crux of the challenge. So we reimplemented most of them in the emulator, mainly as a way to fully understand them. For example, here is our “push” implementation:
/** PUSH(STACK_PTR, VALUE) */
if(calledMethod.getName().equals("sub_400AAE")) {
    Long pStackPtr = evaluateExpression(parameters.get(0));
    Long pValue = evaluateExpression(parameters.get(1));

    long newChunkAddr = allocateNewChunk();

    // write value
    state.writeMemory(newChunkAddr + 8, pValue, 4);

    // link new chunk to existing stack
    Long stackAdr = state.readMemory(pStackPtr, 8);
    state.writeMemory(newChunkAddr, stackAdr, 8);

    // make new chunk the new stack head
    state.writeMemory(pStackPtr, newChunkAddr, 8);

}
Overall, these operations are implementing a custom data-structure that can be operated in a last-in, first-out fashion, but also with direct accesses through indexes. Let’s call this data structure the “stack machine”.
Here are the most used operators:
Address
Operator (names are ours)
Argument(s)
0x400AAE
PUSH
VALUE
0x4009D7
POP
VALUE
0x400D08
GET
INDEX
0x400D55
SET
INDEX,VALUE
Stack Machine’s Main Operators
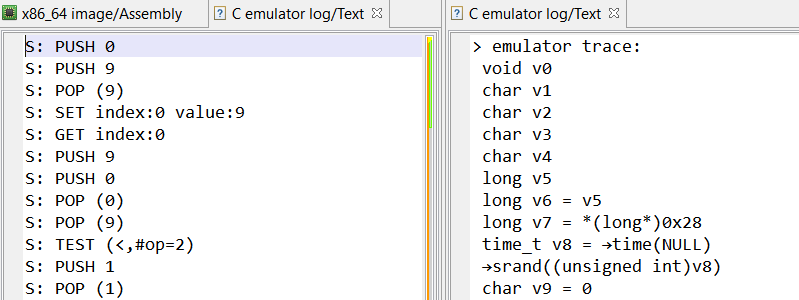
Tracing The Stack Machine
At this point, we modified the emulator to log only stack operations with their arguments, starting from the first call to getchar(). The full trace can be found here, and here is an extract:
S: SET index:7 value:97
S: SET index:8 value:98
S: SET index:13 value:99
S: SET index:15 value:100
S: SET index:16 value:101

[...REDACTED...]

S: PUSH 2700
S: POP (2700)
S: SET index:32 value:2700
S: GET index:32
S: PUSH 2700
S: PUSH 2
S: POP (2)
S: POP (2700)
S: PUSH 2702

[...REDACTED...]
The trace starts with a long series of SET operations, which are storing the result of getchar() at specific indexes in the stack machine (97, 98, 99,… are characters provided by the emulator).
And then, a long series of operations happen, combining the input characters with some constant values. Some interesting patterns appeared at this point, for example:
S: POP (2)
S: POP (2700)
S: PUSH 2702
Here an addition was made between the two popped values, and the result was then pushed. Digging into the trace, it appears there are also handlers popping two values and pushing back a subtraction, multiplication, exclusive or, etc.
Another interesting pattern appears at several places:
S: POP (16335)
S: POP (1234764)
S: PUSH 1
Looking at the corresponding C code, it is actually a comparison between the two popped values — “greater than” in this case –, and the boolean result (0 or 1) is then pushed. Once again, different comparison operators (equal, not equal, …) are used in different handlers.
Finally, something suspicious also stood out in the trace:
S: PUSH 137
S: PUSH 99
S: POP (137)
S: POP (99)
The popped values do not match the order in which they were pushed!
Our objective here is to understand how input characters are manipulated, and what tests are done on them. In other words,we want to know for each POP/POP/PUSH pattern if it is an operation (and which operation — addition, subtraction …–), or a test (and which test — equal, greater than …–).
Again, note that routines implementing POP/POP/PUSH patterns are executed only once. So we cannot individually analyze them and rely on their addresses.
This is where working on decompiled C code becomes particularly handy. For each POP/POP/PUSH series:
We search in the method’s decompiled code if a C operator was used on the PUSH operand. To do so, it is as simple as looking at the operand itself, thanks to JEB decompiler’s optimizations! For example, here is a subtraction:
...
long v1 = pop(v0 - 0x65f48L);
long v2 = pop(v0 - 0x65f48L);
push(v0 - 0x65f48L, v1 - v2);
...
When a C operator is found in push() second operand, the emulator adds the info (with the number of operands) in the trace:
S: POP (137)
S: POP (99)
S: PUSH 38
| operation: (-,#op=2)
Also, we check if there is a “if” statement following a POP in the C code. For example, here is a “greater-than” check between popped values:
...
long v2 = pop(v0 - 0x65f48L);
long v3 = pop(v0 - 0x65f48L);
if(v2 > v3) {
...
If so, the emulator extracts the C operator used in the if statement and logs it in the trace (as a pseudo stack operator named TEST):
S: POP (16335)
S: POP (1234764)
S: TEST (>,#op=2)
S: PUSH 0
It should be noted that operands are always ordered in the same way: first poped value is on left side of operators. So operators and operands are the only thing we need to reconstruct the whole operation.
Time To Go Symbolic
At this point, our execution trace shows how the user’s input is stored onto the stack, and which operations and tests are then done. Our emulator is providing a “bad” input, so they are certainly failed checks in our execution trace. Our goal is now to find these checks, and then the correct input characters.
At this point, it is time to introduce “symbolic” inputs, rather than using concrete values as we have in our trace. To do so, we made a quick and dirty Python script to replay stack machine trace using symbolic variables rather than concrete values.
First, we initialize a Python “stack” with symbols (the stack is a list(), and the symbols are strings representing each character “c0“, “c1“, “c2“…). We put those symbols at the same indexes used by the initial SET operations:
# fill stack with 'symbolic' variables (ie, characters)
# at the initial offset retrieved from the trace
stack = [None] * 50 # arbitrary size
charCounter = 0
stack[7] = 'c' + str(charCounter) # S: SET index:7 value:c0
charCounter+=1
stack[8] = 'c' + str(charCounter) # S: SET index:8 value:c1

[... REDACTED ...]
We also need a temporary storage for expressions that get popped from the stack.
Then, we read the trace file and for each stack operation we execute the equivalent operation on our Python stack:
if operator == "SWAP":
  last = stack.pop()
  secondToLast = stack.pop()
  stack.append(last)
  stack.append(secondToLast)

elif operator == "GET":
  index = readIndexFromLine(curLine)
  temporaryStorage.append(stack[int(index)])

elif operator == "SET":
  index = readIndexFromLine(curLine)
  stack[int(index)] = temporaryStorage.pop()

elif operator == "POP":
  value = stack.pop()
  temporaryStorage.append(value)

[... REDACTED ...]
Now here is the important part: whenever there is an operation, we build a new symbol by “joining” the symbol operands and the operator. Here is an example of an addition between symbols “c5” and “c9“, corresponding respectively to the concrete input characters initially stored at index 26 and 4:
Concrete Trace
Symbolic Trace
...
GET index:26

PUSH 102

GET index:4

PUSH 106

POP (106)

POP (102)

PUSH 208
  | operation: (+,#op=2)
...
...
GET index:26

PUSH "c5"

GET index:4

PUSH "c9"

POP ("c9")

POP ("c5")

PUSH "c9+c5"

...
Concrete execution trace, and its corresponding symbolic trace; on the symbolic side, rather than pushing the actual result of 106 + 102, we build an addition between the two symbols corresponding to the two concrete values
Note that our symbolic executor starts with a clean stack, containing only input symbols. All constants used during the computation are indeed coming from the bytecode (the large memory area copied on the (native) stack at the beginning of the execution), and not from the stack machine.
We can then observe series of operations on input symbols getting build by successive POP/POP/PUSH patterns, and being finally checked against specific values. Here is an extract of our stack at the end:
Here is another advantage to work with C code: the expressions built from our emulator’s trace are using high-level operators, which are directly understood by Z3.
Finally, we ask Z3 for a possible solution to the constraints, and we build the final string from c0, c1,… values:
m = s.model()
result = ''
result += chr(m[c0].as_long())
result += chr(m[c1].as_long())
result += chr(m[c2].as_long())
result += chr(m[c3].as_long())
...
And…
Hurray!
Conclusion
We hope you enjoy this blog post, where we used JEB C decompiled code to analyze a heavily obfuscated executable.
Please refer to our GitHub page for emulator code. While it has been tailored for MarsAnalytica crackme, it can be extended to emulate any executable’s decompiled C code (MarsAnalytica’s specific emulation logic is constrained in subclass MarsAnalyticaCEmulator).
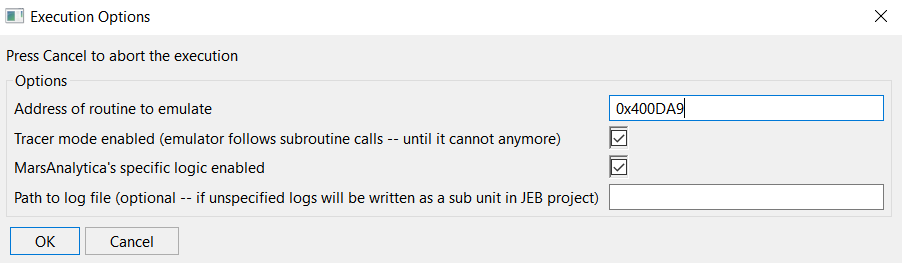
You can run the plugin directly from JEB UI (refer to README):
By default, it will show emulation traces as text subunits in JEB project (stack machine trace in MarsAnalytica mode, or just C statements trace):
Plugin output: left panel is MarsAnalytica stack machine trace (when MarsAnalytica specific emulation logic is enabled), while right panel shows C statements emulation trace
Alternatively, the plugin comes with a headless client, more suitable to gather long running emulation traces.
Finally, kudo to 0xTowel for the awesome challenge! You can also check the excellent Scud’s solution.
Feel free to message us on Slack if you have any questions. In particular, we would be super interested if you attempt to solve complex challenges like this one with JEB!
While JEB’s default decompiled code follows (most of) C syntactic rules and their semantics, some custom operators might be inserted to represent low-level operations and ease the reading; hence strictly speaking JEB’s decompiled code should be called pseudo-C. The decompiled output can also be variants of C, e.g. the Ethereum decompiler produce pseudo-Solidity code. ↩
SHA1 of the UPX-packed executable: fea9d1b1eb9d3f93cea6749f4a07ffb635b5a0bc ↩
Implementing a complete CFG on decompiled C code will likely be done in future versions of JEB, in order to provide more complex C optimizations. ↩
The actual implementation is more complex than that, e.g. it has to deal with pointers dereferencement, refer to emulateStatement() for details. ↩
Dumping memory was done with peda for GDB, and commands dumpmem stack.mem stack and dumpmem heap.mem heap↩
The Go programming language (also known as Golang) has gained popularity during the last few years among malware developers . This can certainly be explained by the relative simplicity of the language, and the cross-compilation ability of its compiler, allowing multi-platform malware development without too much effort.
In this blog post, we dive into Golang executables reverse engineering, and present a Python extension for JEB decompiler to ease Golang analysis; here is the table of content:
The JEB Python script presented in this blog can be found on our GitHub page. Make sure to update JEB to version 3.7+ before running it.
Disclaimer: the analysis in this blog post refers to the current Golang version (1.13) and part of it might become outdated with future releases.
Golang Basics for Reverse Engineers
Feel free to skip this part if you’re already familiar with Golang reverse engineering.
Let’s start with some facts that reverse engineers might find interesting to know before analyzing their first Golang executable.
1. Golang is an open-sourcelanguage with a pretty active development community. The language was originally created at Google around 2007, and version 1.0 was released in March 2012. Since then, two major versions are released each year.
2. Golang has a long lineage: in particular many low-level implementation choices — some would say oddities — in Golang can be traced back to Plan9, a distributed operating system on which some Golang creators were previously working.
3. Golang has been designed for concurrency, in particular by providing so-called “goroutines“, which are lightweight threads executing concurrently (but not necessarily in parallel).
Developers can start a new goroutine simply by prefixing a function call by go. A new goroutine will then start executing the function, while the caller goroutine returns and continues its execution concurrently with the callee. Let’s illustrate that with the following Golang program:
func myDummyFunc(){
	time.Sleep(1 * time.Second)
	fmt.Println("dummyFunc executed")
}

func main(){

	myDummyFunc() // normal call
	fmt.Println("1 - back in main")

	go myDummyFunc() // !! goroutine call
	fmt.Println("2 - back in main")

	time.Sleep(3 * time.Second)
}
Here, myDummyFunc() is called once normally, and then as a goroutine. Compiling and executing this program results in the following output:
dummyFunc executed
1 - back in main
2 - back in main
dummyFunc executed
Notice how the execution was back in main() before executing the second call to dummyFunc().
Implementation-wise, many goroutines can be executed on a single operating system thread. Golang runtime takes care of switching goroutines, e.g. whenever one executes a blocking system call. According to the official documentation “It is practical to create hundreds of thousands of goroutines in the same address space“.
What makes goroutines so “cheap” to create is that they start with a very limited stack space (2048 bytes — since Golang 1.4), which will be increased when needed.
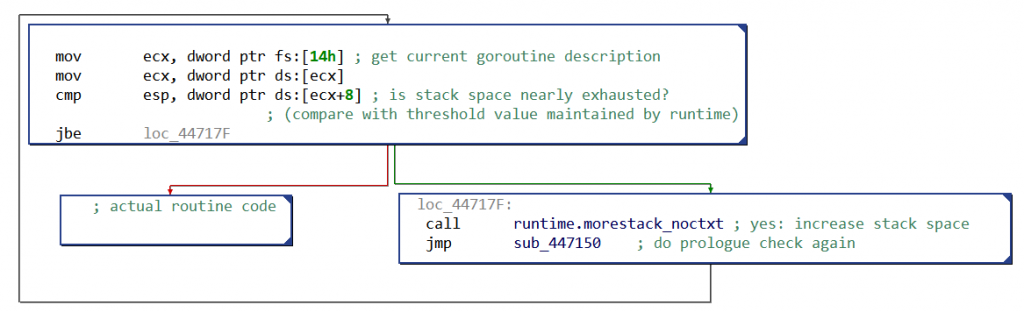
One of the noticeable consequence for reverse engineers is that native routines (almost) all start with the same prologue. Its purpose is to check if the current goroutine’s stack is large enough, as can be seen in the following CFG:
Fig. 1: Simplified x86 CFG with Golang prologue for stack growth
When the stack space is nearly exhausted, more space will be allocated — actually, the stack will be copied somewhere with enough free space. This particular prologue is present only in routines with local variables.
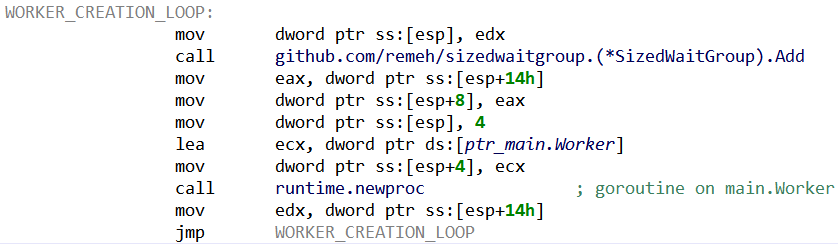
How to distinguish a goroutine call from a “normal” call when analyzing a binary? Goroutine calls are implemented by calling runtime.newproc, which takes in input the address of the native routine to call, the size of its arguments, and then the actual routine’s arguments.
4. Golang has a concurrent garbage collector(GC): Golang’s GC can free memory while other goroutines are modifying it.
Roughly speaking, when the GC is freeing memory, goroutines report to it all their memory writes — to prevent concurrent memory modifications to be missed by the current freeing phase. Implementation-wise, when the GC is in the process of marking used memory, all memory writes pass through a “write barrier“, which performs the write and informs the GC.
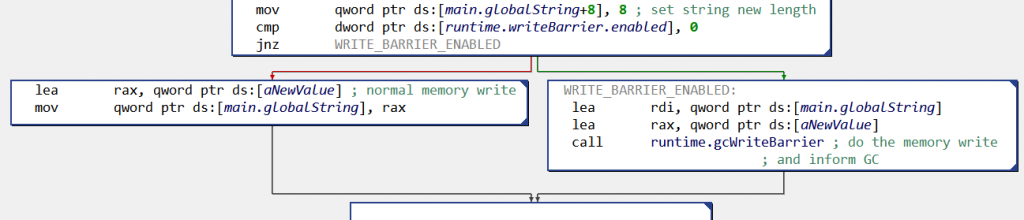
For reverse engineers this can result in particularly convoluted control flow graphs (CFG). For example, here is the CFG when a global variable globalString is set to newValue:
Fig. 2: Write to global variable globalString (x86 CFG): before doing the memory write, the code checks if the write barrier is activated, and if yes calls runtime.gcWriteBarrier()
Not all memory writes are monitored in that manner; the rules for write barriers’ insertion are described in mbarrier.go.
5. Golang comes with a custom compiler tool chain (parser, compiler, assembler, linker), all implemented in Golang. 12
From a developer’s perspective, it means that once Go is installed on a machine, one can compiled for any supported platform (making Golang a language of choice for IoT malware developers). Examples of supported platforms include Windows x64, Linux ARM and Linux MIPS (see “valid combinations of $GOOS and $GOARCH“).
From a reverse engineer’s perspective, the custom Go compiler toolchain means Golang binaries sometimes come with “exotic” features (which therefore can give a hard time to reverse engineering tools).
For example, symbols in Golang Windows executables are implemented using the COFF symbol table (while officially “COFF debugging information [for executable] is deprecated“). The Golang COFF symbol implementation is pretty liberal: symbols’ type is set to a default value — i.e. there is no clear distinction between code and data.
Interestingly, Golang compiler internally uses pseudo assembly instructions (with architecture-specific registers). For example, here is a snippet of pseudo-code for ARM (operands are ordered with source first):
These pseudo-instructions could not be understood by a classic ARM assembler (e.g. there is no CALL instruction on ARM). Here are the disassembled ARM instructions from the corresponding binary:
Notice how the same pseudo-instruction MOVW got converted either as STRorMOV machine instructions. The use of pseudo-assembly comes from Plan9, and allows Golang assembler parser to easily handle all architectures: the only architecture-specific step is the selection of machine instructions (more details here).
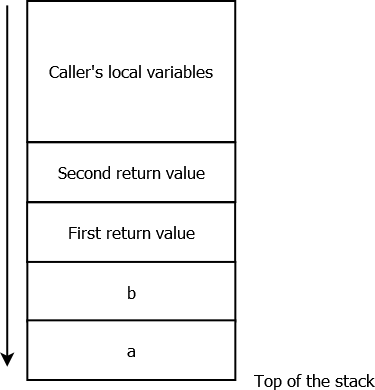
6. Golang uses by default a stack-only calling convention.
Let’s illustrate that with the following diagram, showing the stack’s state when a routine with two integer parameters a and b, and two return values — declared in Go as “func myRoutine(a int, b int) (int, int)” — is called:
Fig. 3: Simplified stack view (stack grows downward), when a routine with two parameters and two return values is called . The return values are reserved slots for the callee.
It is the caller’s responsibilities to reserve space for the callees’ parameters and returned values, and to free it later on.
Note that Golang’s calling convention situation might soon change: since version 1.12, several calling conventions can coexist — the stack-only calling convention remaining the default one for backward compatibility reasons.
7. Golang executables are usually statically-linked, i.e. do not rely on external dependencies3. In particular they embed a pretty large runtime environment. Consequently, Golang binaries tend to be large: for example, a “hello world” program compiled with Golang 1.13 is around 1.5MB with its symbols stripped.
8. Golang executables embed lots of symbolic information:
Debug symbols, implemented as DWARF symbols. These can be stripped at compilation time (command-line option -ldflags "-w") .
Classic symbols for each executable file format (PE/ELF/Mach-O). These can be stripped at compilation time (command-line option -ldflags "-s").
Go-specific metadata, including for example all functions’ entry points and names, and complete type information. These metadata cannot (easily) be stripped, because Golang runtime needs them: for example, functions’ information are needed to walk the stack for errors handling or for garbage collection, while types information serve for runtime type checks.
Of course, Go-specific metadata are very good news for reverse engineers, and parsing these will be one of the purpose of the JEB’s Python extension described in this blog post.
Making JEB Great for Golang
Current Status
What happens when opening a Golang executable in JEB? Let’s start from the usual “hello world” example:
package main

import "fmt"

func main() {
	fmt.Printf("hello, world\n")
}
If we compile it for as a Windows x64 PE file, and open it in JEB, we can notice that its code has only been partially disassembled. Unexplored memory areas can indeed be seen next to code areas in the native navigation bar (right-side of the screen by default):
Fig.4: Navigation bar for Golang PE file (blue is code, green is data, grey represents area without any code or data)
We can confirm that the grey areas surrounding the blue areas are code, by manually disassembling them (hotkey ‘C’ by default).
Why did JEB disassembler miss this code? As can be seen in the Notifications window, the disassembler used a CONSERVATIVE strategy, meaning that it only followed safe control flow relationships (i.e. branches with known targets) 4.
Because Go runtime calls most native routines indirectly, in particular when creating goroutines, JEB disassembler finds little reliable control flow relationships, explaining why some code areas remain unexplored.
Before going on, let’s take a look at the corresponding Linux executable, which we can obtain simply by setting environment variable $GOOS to linux before compiling. Opening the resulting ELF file in JEB brings us in a more positive situation:
Fig. 5: Navigation bar for Golang ELF file (blue is code, green is data, grey represents area without any code or data)
Due to the use by default of AGGRESSIVE strategy for disassembling ELF files, JEB disassembler found the whole code area (all code sections were linearly disassembled). In particular this time we can see our main routine, dubbed main.main by the compiler:
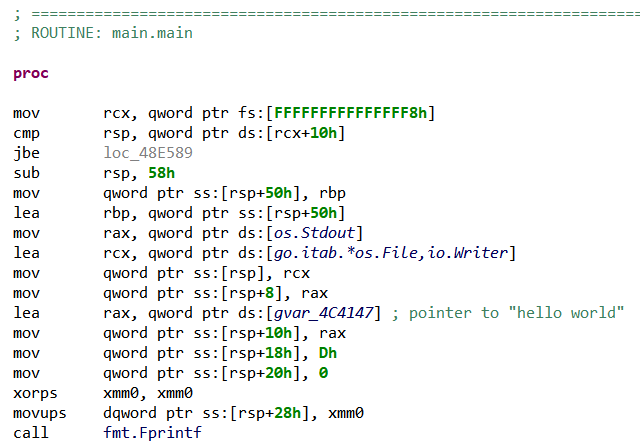
Fig. 6: Extract of main.main routine’s disassembly
Are data mixed with code in Golang executables? If yes, that would make AGGRESSIVE disassembly a risky strategy. At this moment (version 1.13 with default Go compiler), this does not seem to be the case:
– Data are explicitly stored in different sections than code, on PE and ELF.
– Switch statements are not implemented with jumptables — a common case of data mixed with code, e.g. in Visual Studio or GCC ARM. Note that Golang provides several switch-like statements, as the select statement or the type switch statement.
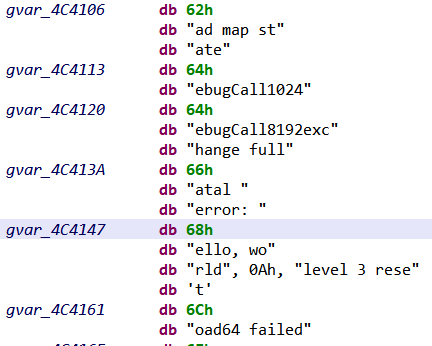
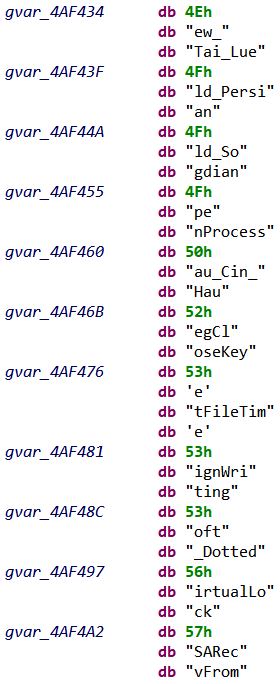
Yet, there is still something problematic in our ELF disassembly: the “hello world” string was not properly defined. Following the reference made by LEA instruction in the code, we reach a memory area where many strings have indeed been misrepresented as 1-byte data items:
Fig. 7: Dump of the memory area containing strings. Only the first byte of the strings is defined.
Now that we have a better idea of JEB’s current status, we are going to explain how we extended it with a Python script to ease Golang analysis.
Finding and Naming Routines
The first problem on our road is the incomplete control flow, specially on Windows executables. At first, it might seem that PE files disassembly could be improved simply by setting disassembler’s strategy to AGGRESSIVE, exactly as for ELF files. While it might be an acceptable quick solution, we can actually improve the control flow in a much safer way by parsing Go metadata.
Parsing “Pc Line Table”
Since version 1.2, Golang executables embed a structure called “pc line table”, also known as pclntab. Once again, this structure (and its name) is an heritage from Plan9, where its original purpose was to associate a program counter value (“pc”) to another value (e.g. a line number in the source code).
The structure has evolved, and now contains a function symbol table, which stores in particular the entry points and names of all routines defined in the binary. The Golang runtime uses it in particular for stack unwinding, call stack printing and garbage collection.
In others words, pclntab cannot be easily stripped from a binary, and provide us a reliable way to improve our disassembler’s control flow!
First, our script locates pclntab structure (refer to locatePclntab() for the details):
  # non-stripped binary: use symbol
  if findSymbolByName(golangAnalyzer.codeContainerUnit, 'runtime.pclntab') != None:
      pclntabAddress = findSymbolByName(..., 'runtime.pclntab')

  # stripped binary
  else:
    # PE: brute force search in .rdata. or in all binary if section not present
    if [...].getFormatType() == WellKnownUnitTypes.typeWinPe
    [...]

    # ELF: .gopclntab section if present, otherwise brute force search
    elif [...].getFormatType() == WellKnownUnitTypes.typeLinuxElf:
    [...]
On stripped binaries (i.e. without classic symbols), we search memory for the magic constant 0xFFFFFFFB starting pclntab, and then runs some checks on the possible fields. Note that it is usually easier to parse Golang ELF files, as important runtime structures are stored in distinct sections.
Second, we parse pclntab and use its function symbol table to disassemble all functions and rename them:
[...]
# enqueue function entry points from pclntab and register their names as labels
for myFunc in pclntab.functionSymbolTable.values():
 nativeCodeAnalyzer.enqueuePointerForAnalysis(EntryPointDescription(myFunc.startPC), INativeCodeAnalyzer.PERMISSION_FORCEFUL)
 if rename:
   labelManager.setLabel(myFunc.startPC, myFunc.name, True, True, False)

# re-run disassembler with the enqueued entry points
self.nativeCodeAnalyzer.analyze()
Running this on our original PE file allows to discover all routines, and gives the following navigation bar:
Fig. 8: Navigation bar for Golang PE file after running the script (blue is code, green is data, grey represents area without any code or data)
Interestingly, a few Golang’s runtime routines provide hints about the machine used to compile the binary, for example:
– runtime.schedinit(): references Go’s build version. Knowing the exact version allows to investigate possible script parsing failures (as some internal structures might change depending on Go’s version).
– runtime.GOROOT(): references Go’s installation folder used during compilation. This might be useful for malware tracking.
These routines are present only if the rest of the code relies on them. If it is the case, FunctionsFinder module highlights them in JEB’s console, and the user can then examine them.
The Remaining Unnamed Routines
Plot twist! A few routines found by the disassembler remain nameless even after FunctionsFinder module parsed pclntab structure. All these routines are adjacent in memory and composed of the same instructions, for example:
Fig. 9: Series of unnamed routines in x86
Long story short, these routines are made for zeroing or copying memory blobs, and are part of two large routines respectively named duff_zero and duff_copy.
These large routines are Duff’s devices made for zeroing/copying memory. They are generated as long unrolled loops of machine instructions. Depending on how many bytes need to be copied/zeroed the compiler will call directly on a particular instruction. For each of these calls, a nameless routine will then be created by the disassembler.
DuffDevicesFinder module identifies such routines with pattern matching on assembly instructions. By counting the number of instructions, it then renames them duff_zero_N/duff_copy_N, with N the number of bytes zeroed/copied.
Source Files
Interestingly, pclntab structure also stores original source files‘ paths. This supports various Golang’s runtime features, like printing meaningful stack traces, or providing information on callers from a callee (see runtime.Caller()). Here is an example of a stack trace obtained after a panic():
The second problem we initially encountered in JEB was the badly defined strings.
What Is a String?
Golang’s strings are stored at runtime in a particular structure called StringHeader with two fields:
type StringHeader struct {
        Data uintptr       // string value
        Len  int           // string size
}
The string’s characters (pointed by the Data field) are stored in data sections of the executables, as a series of UTF-8 encoded characters without null-terminators.
Dynamic Allocation
StringHeader structures can be built dynamically, in particular when the string is local to a routine. For example:
Fig. 10: StringHeader instantiation in x86
By default JEB disassembler defines a 1-byte data item (gvar_4AFB52 in previous picture) for the string value, rather than a proper string, because:
As the string value is referenced only by LEA instruction, without any hints on the data type (LEA is just loading an “address”), the disassembler cannot type the pointed data accordingly.
The string value does not end with a null-terminator, making JEB’s standard strings identification algorithms unable to determine the string’s length when scanning memory.
To find these strings, StringsBuilder module searches for the particular assembly instructions usually used for instantiating StringHeader structures (for x86/x64, ARM and MIPS architectures). We can then properly define a string by fetching its size from the assembly instructions. Here is an example of recovered strings:
Before strings recovery
After strings recovery
Of course, this heuristic will fail if different assembly instructions are employed to instantiate StringHeader structures in future Golang compiler release (such change happened in the past, e.g. x86 instructions changed with Golang 1.8).
Static Allocation
StringHeader can also be statically allocated, for example for global variables; in this case the complete structure is stored in the executable. The code referencing such strings employs many different instructions, making pattern matching not suitable.
The script employs twoadditional final heuristics, which scan memory for printable strings located between two already-defined strings. This allows to recover strings missed by previous heuristics.
When a small local string is used for comparison only, no StringHeader structure gets allocated. The string comparison is done directly by machine instructions; for example, CMP [EAX], 0x64636261 to compare with “abcd” on x86.
Types Recovery
Now that we extended JEB to handle the “basics” of Golang analysis, we can turn ourselves to what makes Golang-specific metadata particularly interesting: types.
Golang executables indeed embed descriptions for all typesmanipulated in the binary, including in particular those defined by developers.
To illustrate that, let’s compile the following Go program, which defines a Struct (Golang’s replacement for classes) with two fields:
package main

type DummyStruct struct{
	boolField bool
	intField int
}

func dummyFunc(s DummyStruct) int{
	return 13 * s.intField
}

func main(){
	s := DummyStruct{boolField: true, intField:37}
	t := dummyFunc(s)
	t += 1
}
Now, if we compile this source code as a stripped x64 executable, and analyze it with TypesBuilder module, the following structure will be reconstructed:
Fig. 14: Structure reconstructed by TypesBuilder, as seen in JEB’s type editor
Not only did we get the structure and its fields’ original names, but we also retrieved the structure’s exact memory layout, including the padding inserted by the compiler to align fields. We can confirm DummyStruct‘s layout by looking at its initialization code in main():
Fig. 15: DummyStruct initialization: intField starts at offset 8, as extracted from type information
Why So Much Information?
Before explaining how TypesBuilder parses types information, let’s first understand why these information are needed at all. Here are a few Golang features that rely on types at runtime:
Dynamic memory allocation, usually through a call to runtime.newobject(), which takes in input the description of the type to be allocated
Dynamic type checking, with statements like type assertions or type switches. Roughly speaking, two types will be considered equals if they have the same type descriptions.
Reflection, through the built-in package reflect, which allows to manipulate objects of unknown types from their type descriptions
Golang type descriptions can be considered akin to C++ Run-Time Type Information, except that there is no easy way to prevent their generation by the compiler. In particular, even when not using reflection, types descriptors remain present.
For reverse engineers, this is another very good news: knowing types (and their names) will help understanding the code’s purpose.
Of course, it is certainly doable to obfuscate types, for example by giving them meaningless names at compilation. We did not find any malware using such technique.
What Is A Type?
In Golang each type has an associated Kind, which can take one the following values:
Struct: collection of fields, Golang’s replacement for classes
Interface: collection of methods, implemented by Structs
The type’s kind is the type’s “category”; what identifies the type is its complete description, which is stored in the following rtype structure:
    type rtype struct {
      size       uintptr
      ptrdata    uintptr  // number of bytes in the type that can contain pointers
      hash       uint32   // hash of type; avoids computation in hash tables
      tflag      tflag    // extra type information flags
      align      uint8    // alignment of variable with this type
      fieldAlign uint8    // alignment of struct field with this type
      kind       uint8    // enumeration for C
      alg        *typeAlg // algorithm table
      gcdata     *byte    // garbage collection data
      str        nameOff  // string form
      ptrToThis  typeOff  // type for pointer to this type, may be zero
    }
The type’s name is part of its description (str field). This means that, for example, one could define an alternate integer type with type myInt int, and myInt and int would then be distinct types (with distincttype descriptors, each of Int kind). In particular, assigning a variable of type myInt to a variable of type int would necessitate an explicit cast.
The rtype structure only contains general information, and for non-primary types (Struct, Array, Map,…) it is actually embedded into another structure (as the first field), whose remaining fields provides type-specific information.
For example, here is strucType, the type descriptor for types with Struct kind:
    type structType struct {
      rtype
      pkgPath name
      fields  []structField
    }
Here, we have in particular a slice of structField, another structure describing the structure fields’ types and layout.
Finally, types can have methods defined on them: a method is a function with a special argument, called the receiver, which describes the type on which the methods applies. For example, here is a method on MyStruct structure (notice receiver’s name after func):
func (myStruct MyStruct) method1() int{
    ...
}
Where are methods’ types stored? Into yet another structure called uncommonType, which is appended to the receiver’s type descriptor. In other words, a structure with methods will be described by the following structure:
type UncommonStructType struct {
      rtype
      structType
      uncommonType
}
Here is an example of such structure, as seen in JEB after running TypesBuilder module:
Fig. 16: Type descriptor for a structure with methods: StrucType (with embedded rtype, and referencing StructField), followed by UncommonType (referencing MethodType)
Parsing type descriptors can therefore be done by starting from rtype (present for all types), and adding wrapper structures around it, if needed. Properly renaming type descriptors in memory greatly helps the analysis, as these descriptors are passed as arguments to many runtime routines (as we will see in StealthWorker’s malware analysis).
The final step is to transform the type descriptors into the actual types — for example, translating a structType into the memory representation of the corresponding structure –, which can then be imported in JEB types. For now, TypesBuilder do this final import step for named structures only.
Describing in details all Golang’s type descriptors is out-of-scope for this blog. Refer to TypesBuilder module for gory details.
Locating Type Descriptors
The last question we have to examine is how to actually locate type descriptors in Golang binaries. This starts with a structure called moduledata, whose purpose is to “record information about the layout of the executable“:
This structure defines in particular a range of memory dedicated to storing type information (from types to etypes). Then, typelink field stores offsets in the range where type descriptors begin.
So first we locate moduledata, either from a specific symbol for non-stripped binaries, or through a brute-force search. For that, we search for the address of pclntab previously found (first moduledata field), and then apply some checks on its fields.
There is no backward compatibility requirement on runtime’s internal structures — as Golang executables embed their own runtime. In particular, moduledata and type descriptions are not guaranteed to stay backward compatible with older Golang release (and they were already largely modified since their inception).
In others words, TypesBuilder module’s current implementation might become outdated in future Golang releases (and might not properly work on older versions).
Use-Case: StealthWorker
We are now going to dig into a malware dubbed StealthWorker. This malware infects Linux/Windows machines, and mainly attempts to brute-force web platforms, such as WordPress, phpMyAdmin or Joomla. Interestingly, StealthWorker heavily relies on concurrency, making it a target of choice for a first analysis.
The sample we will be analyzing is a x86 Linux version of StealthWorker, version 3.02, whose symbols have been stripped (SHA1: 42ec52678aeac0ddf583ca36277c0cf8ee1fc680)
Reconnaissance
Here is JEB’s console after disassembling the sample and running the script with all modules activated (FunctionsFinder, StringsBuilder, TypesBuilder, DuffDevicesFinder, PointerAnalyzer):
>>> Golang Analyzer <<<
> pclntab parsed (0x84B79C0)
> first module data parsed (0x870EB20)
> FunctionsFinder: 9528 function entry points enqueued (and renamed)
> FunctionsFinder: running disassembler... OK
 > point of interest: routine runtime.GOROOT (0x804e8b0): references Go root path of developer's machine (sys.DefaultGoroot)
 > point of interest: routine runtime.schedinit (0x8070e40): references Go version (sys.TheVersion)
> StringsBuilder: building strings... OK (4939 built strings)
> TypesBuilder: reconstructing types... OK (5128 parsed types - 812 types imported to JEB - see logs)
> DuffDevicesFinder: finding memory zero/copy routines... OK (93 routines identified)
> PointerAnalyzer: 5588 pointers renamed
> see logs (C:\[REDACTED]\log.txt)
Let’s start with some reconnaissance work:
The binary was compiled with Go version 1.11.4 (referenced in runtime.schedinit‘s code, as mentioned by the script’s output)
Go’s root path on developer’s machine is /usr/local/go (referenced by runtime.GOROOT‘s code)
Now, let’s turn to the reconstructed strings; there are too many to draw useful conclusions at this point, but at least we got an interesting IP address (spoiler alert: that’s the C&C’s address):
Fig. 17: Extract of StealthWorker’s strings as seen in JEB after running the script
More interestingly, the list of source files extracted from pclntab (outputted in the script’s log.txt) shows a modular architecture:
Each main.go corresponds to a Go package, and its quite obvious from the paths that each of them targets a specific web platform. Moreover, there seems to be mainly two types of packages: WorkerTARGET_brut, and WorkerTARGET_check.
Let’s dig a bit further by looking at main package, which is where execution begins; here are its routines with pretty informative names:
Fig. 18: main’s package routines
Additionally there is a series of type..hash* and type..eq* methods for main package:
Fig. 19: Hashing methods (automatically generated for complex types)
These methods are automatically generated for types equality and hashing, and therefore their presence indicates that non-trivial custom types are used in main package (as we will see below).
We can also examine main.init() routine. The init() routine is generated for each package by Golang’s compiler to initialize others packages that this package relies on, and the package’s global variables:
Fig. 20: Packages initialization from main.init()
Along the previously seen packages, one can notice some interesting custom packages:
github.com/remeh/sizedwaitgroup: a re-implementation of Golang’s WaitGroup — a mechanism to wait for goroutines termination –, but with a limit in the amount of goroutines started concurrently. As we will see, StealthWorker’s developer takes special care to not overload the infected machine.
Golang packages’ paths are part of a global namespace, and it is considered best practice to use GitHub’s URLs as package paths for external packages to avoid conflicts.
Concurrent Design
In this blog, we will not dig into each StealthWorker’s packages implementation, as it has been already been done severaltimes. Rather, we will focus on the concurrent design made to organize the work between these packages.
Let’s start with an overview of StealthWorker’s architecture:
Fig. 21: StealthWorker’s design overview
At first, a goroutine executing getActiveProject() regularly retrieves a list of “projects” from the C&C server. Each project is identified by a keyword (wpChk for WordPress checker, ssh_b for SSH brute-forcer, etc).
From there, the real concurrent work begins: five goroutines executing PrepareTaskFunc() retrieve a list of targets for each project, and then distribute work to “Workers”. There are several interesting quirks here:
To allow PrepareTaskFunc() goroutines to communicate with Worker() goroutines, a Channel is instantiated:
Fig. 22: Channel’s instantiation
As can be seen from the channel type descriptor — parsed and renamed by the script –, the Channel is made for objects of type interface {}, the empty interface. In others words, objects of any type can be sent and received through it (because “direction:both”).
PrepareTaskFunc() will then receive from the C&C server a list of targets for a given project — as JSON objects –, and for each target will instantiate a specific structure. We already noticed these structures when looking at main package’s routines, here are their reconstructed form in the script’s logs:
Note that all structures have Worker and Host fields. The structure (one per target) will then be sent through the channel.
On the other side of the channel, a Worker() goroutine will fetch the structure, and use reflection to generically process it (i.e. without knowing a priori which structure was sent):
Fig. 23: StealthWorker’s use of reflection to retrieve a field from an unknown structure
Finally, depending on the value in Worker field, the corresponding worker’s code will be executed. There are two types of workers: brute-forcing workers, which try to login into the target through a known web platform, and checking workers, which test the existence of a certain web platform on the target.
From a design point-of-view, there is a difference between the two types of workers: checking workers internally relies on another Channel, in which the results are going to be written, and fetched by another goroutine named saveGood(), which reports to the C&C. On the other hand, brute-forcing workers do their task and directly report to the C&C server.
Interestingly, the maximum number of Worker() goroutines can be configured by giving a parameter to the executable (preceded by the argument dev). According to the update mechanism, it seems that the usual value for this maximum is 400. Then, the previously mentioned SizedWaitGroup package serves to ensure the number of goroutines stay below this value:
Fig. 24: Worker’s creation loop SizeWaitGroup.Add() is blocking when the maximum number of goroutines has been reached. Each main.Worker() will release its slot when terminating.
We can imagine that the maximum amount of workers is tuned by StealthWorker’s operators to lower the risk of overloading infected machines (and drawing attention).
There are two additional goroutines, respectively executing routines KnockKnock() and CheckUpdate(). Both of them simply run specific tasks concurrently (and infinitely): the former sends a “ping” message to the C&C server, while the latter asks for an updated binary to execute.
What’s Next? Decompilation!
The provided Python script should allow users to properly analyze Linux and Windows Golang executables with JEB. It should also be a good example of what can be done with JEB API to handle “exotic” native platforms.
Regarding Golang reverse engineering, for now we remained at disassembler level, but decompiling Golang native code to clean pseudo-C is clearly a reachable goal for JEB. There are a few important steps to implement first, like properly handling Golang stack-only calling convention (with multiple return values), or generating type libraries for Golang runtime.
So… stay tuned for more Golang reverse engineering!
As usual, if you have questions, comments or suggestions, feel free to:
The Golang compiler was originally inherited from Plan9 and was written in C, in order to solve the bootstrapping problem (how to compile a new language?), and also to “easily” implement segmented stacks — the original way of dealing with goroutines stack. The process of translating the original C compiler to Golang for release 1.5 has been described in details here and here. ↩
There are alternate compilers, e.g. gccgo and a gollvm↩
Golang also allows to compile ‘modules’, which can be loaded dynamically. Nevertheless, for malware writers statically-linked executables remain the usual choice. ↩
Readers interested in the internals of JEB disassembler engine should refer to our recent REcon presentation↩
Last week we presented a talk at REcon on the internals of JEB’s native disassembler.
During this talk, we focused on some of the research problems we encountered while developing our custom disassembler engine — the foundation for JEB native decompiler.
JEB 3.3 ships with our internal tool SiglibGen to generate signatures for native routines. Until now, users could sign individual routines only from JEB user interface (menu Native> Create Signature for Procedure), or with the auto-signing mode.
With the release of SiglibGen, users can now create signatures for whole files in batch mode, notably executables (PE, ELF) libraries (Microsoft COFF and AR files) and JDB2 (JEB project files)1.
In this post, we will explain how SiglibGen allows power-users to generate custom signature libraries, in order to quickly identify similar code between different executables.
Signature Libraries (siglibs)
Signature libraries are stored in <JEB install folder>/siglibs folder. Each signature contains a set of features identifying a routine (detailed below), and a set of attributes representing the knowledge about the routine (name, internal labels, comments…).
JEB currently ships with signature libraries for x86/x64 Microsoft Visual Studio libraries (from Visual Studio 2008 to 2017), and for ARM/ARM64 Android NDKs (from NDKr10 to NDKr19). These signatures will be automatically loaded when a suitable file is opened (see File>Engines>Signature Libraries for the complete list of available signature libraries).
These compiler signatures are intended to be “false positive free”, i.e. they should only identify the exact same routine (though it can be mapped at a different location). Therefore, the signatures can be blindly trusted by users, and by JEB automatic analysis2.
But users might want to generate their own signature libraries, for example in the following scenarios:
User analyzed an unknown executable. The resulting JDB2 file can then be signed, such that all routines can be identified in others executables and related information (name, comments, labels) be imported.
User found out that an executable is statically linked with a public library. The library can then be compiled with symbols and signed such that the library routines will be renamed in the analyzed executable3.
Use Case: Operation ShadowHammer
To illustrate the signatures generation process, we are going to use the recent attack dubbed “Operation ShadowHammer” as an example. This operation was originally documented by Kaspersky. Roughly summarized, malicious code was inserted into a legitimate ASUS’s automatic update tool named “ASUS Live Update Utility” 4 .
In this use case, we are going to put ourselves in the shoes of an analyst willing to understand the trojanized ASUS installers. We do not intend to analyze them in-depth – it has been done several times already -, but rather show how SiglibGen can accelerate the analysis.
At first, we got our hands on three samples, originally mentioned in CounterCept’s analysis with their date of use:
An analyst would likely start looking at the oldest sample (6aedfef6…), in order to investigate possible evolution of the attack. In this sample, the installer’s main() routine was modified to load a malicious PE executable from its resources:
JEB Project View. The embedded executable can be seen in resources5.
Here is the memory map after opening the malicious executable in JEB:
Embedded PE navigation view. Blue is code, cyan is code identified by siglib, green is data.
The large chunks of cyan correspond to routines identified as being part of “Microsoft Visual C++ 2010 /MT” libraries. Then, we analyzed the remaining seven routines (the blue chunk in the navigation view), and renamed them as follow:
Malicious Routines (our names)
These routines implement the following logic: check if one of the machine’s MAC address match a hard coded list, and if it’s the case download a payload (otherwise a .idx log file is dropped).
Now in order to re-use this knowledge on more recent trojanized ASUS installers, let’s generate signatures for this first sample.
Generating Signatures
In order to sign the analyzed file, we are going to create a configuration file from the sample file provided in <JEB install folder>/siglibs/custom:
;------------------------------------------------------------------------------
; *** SAMPLE *** JEB Signature Library configuration file
;------------------------------------------------------------------------------

;template file used to configure the generation of a *.siglib file for JEB

;how to generate the siglib specified by this file?
;open a terminal and execute: (eg, on Windows)
;  $ ..\..\jeb_wincon.bat -c --siglibgen=sample-siglib.cfg

;(mandatory) name of the folder containing files to sign
; must be in the same folder as this configuration file
input_folder_name=

;(mandatory) processor type
; see com.pnfsoftware.jeb.core.units.codeobject.ProcessorType
; eg: X86, X86_64, ARM, ARM64, MIPS, MIPS64
processor=

;(mandatory) output siglib file name
; '.siglib' extension will be appended to it
; IMPORTANT! once generated, this file must be moved to the <JEB>/siglibs/ folder
; (user generated siglibs have to be manually loaded)
output_file_name=mysiglib

;(mandatory) unique identifier for your siglib
; keep it < 0 and decrement for each package you generate
uuid=-1

;(mandatory) *absolute* path to JEB typelibs folder, usually <JEB>/typelibs
typelibs_folder=

;(mandatory) name of your package
; e.g. 'Microsoft Visual C++ 2008 signatures' (without '')
package_name=

;(mandatory) package version
package_version=0

;(optional) description of your package
package_description=

;(optional) package author
package_author=

;(mandatory) list of features included in each signature
; i.e. the characteristics of the signed routines serving to identify them
; see com.pnfsoftware.jeb.core.units.code.asm.sig.NativeFeatureSignerID
; note: defaults should be suitable for most cases. ROUTINE_SIZE must always be included.
features=ROUTINE_SIZE,ROUTINE_CODE_HASH,CALLED_ROUTINE_NAME_ONLY_EXTERN

;(mandatory) list of attributes included in each signature
; i.e. additional knowledge on the signed routines conveyed by signatures
; (other than routine name)
; see com.pnfsoftware.jeb.core.units.code.asm.sig.NativeAttributeSignerID
attributes=COMMENT,LABEL
A particularly interesting part of this configuration is the features field, where users can select the characteristics of the routine they want to put in signatures. The complete feature list can be found here; here are the features we included in our case (the default ones):
Feature Name
Description
ROUTINE_SIZE
Size of the routine (number of instructions).
ROUTINE_CODE_HASH
Custom hash computed from the routine assembly code.
CALLED_ROUTINE_NAME_ONLY_EXTERN
Names of the external routines called by the signed routine.
Note that by including ROUTINE_CODE_HASH, our signatures will only match routines with the exact same code (but possibly mapped at a different location). The use of CALLED_ROUTINE_NAME_ONLY_EXTERN allows to distinguish different wrapper routines calling different API routines, but having the same code.
Here is the specific configuration file shadowhammer-oldest.cfg we made for this first sample:
input_folder_name=input
processor=X86
output_file_name=shadowhammer-6aedfef6
uuid=-1
typelibs_folder=[...REDACTED...]\typelibs
package_name=ShadowHammer -- sample 6aedfef6 (oldest)
package_version=0
package_description=Signatures generated from the analysis of the oldest sample known
package_author=Joan Calvet
features=ROUTINE_SIZE,ROUTINE_CODE_HASH,CALLED_ROUTINE_NAME_ONLY_EXTERN
attributes=COMMENT,LABEL
Then we put the JDB2 file of the analyzed sample into the input folder (see configuration’s input_folder_name field). SiglibGen can then be called by executing JEB startup script (e.g. jeb_wincon.bat) with the following flags:
$jeb -c --siglibgen=shadowhammer-oldest.cfg
The generated signature libraries will then be written in the output folder. In our case, SiglibGen signed our seven routines, as indicated in siggen_stat.log file 6:
> Package created on 2019.05.01.15.29.23
> metadata: X86/ShadowHammer -- sample 6aedfef6 (oldest)/0/Signatures generated from the analysis of the oldest sample known/Joan Calvet/1556738959
> # sigs created: 7
> # very small routines: 0
> # small routines: 0
> # medium routines: 6
> # large routines: 1
> # unnamed routines: 1
> # blacklisted routines: 0
> # duplicated routines: 0
We can now copy shadowhammer-6aedfef6.siglib to <JEB>/siglibs/ folder. It will now be available under File>Engines>Signature Libraries to be manually loaded.
Second Sample Analysis
Now, it is time to turn to the second sample (736bda6432…). The workflow is quite different from the previous one: a routine call has been inserted into Visual Studio library method __crtExitProcess, which is called whenever the program exists:
Trojanized __crtExitProcess. Call to __crtCorExitProcess was replaced by a call to malicious code.
The astute reader might wonder why the routine is still named __crtExitProcess(), as if it was the original one, if one of its call has been rewritten to point elsewhere. In this case, the routine’s name comes from the fact that several caller routines were identified as library code (and are known to call __crtExitProcess()), as indicated by the routine header comment “Routine’s name comes from a caller […]”.
Following the dubious call, we end up decrypting the malicious payload, which is then executed. We can load the malicious dump in JEB with the x86 processor and the correct base address. After manually defining the code area, we obtain the following navigation view:
Memory dump’s initial navigation view. Blue is code.
For now, no compiler signature libraries were loaded because it is a memory dump without a proper PE header. As we know the previous malicious sample was compiled with Visual Studio 2010 /MT libraries, we can manually load the corresponding signatures (File>Engines>Signature Libraries). Here is the navigation bar at this time:
Memory dump’s navigation view with Visual Studio 2010 /MT signature libraries loaded. Blue is code, cyan is library code.
Most of the code has been identified. Now, we can load the custom signatures we generated from the previous sample, and we end up with two more routines being identified (i.e. miscreants directly re-used them from the first sample):
We can now look at the non-identified routines, without having to reanalyze the duplicates.
Finally, after having analyzed the remaining routines, we can generate a new signature library, following the same steps previously described. This time we put two samples in the input folder (the trojanized installer’s JDB2, and the memory dump’s JDB2). Eight routines are then signed.
Third Sample Analysis
The most recent sample (9a72f971944f…) follows the same logic as the previous one, namely it dynamically decrypts the malicious code, which is then executed. As previously, we load the memory dump in JEB with Visual Studio 2010 /MT signatures:
Memory dump’s navigation view with Visual Studio 2010 /MT signature libraries loaded.
Finally, we load the ShadowHammer signature libraries generated from the previous two samples:
Memory dump’s navigation view with Visual Studio 2010 /MT and ShadowHammer signature libraries loaded.
At this point, only one malicious routine has not been identified (the large blue area in the navigation view). We can now focus on it, knowing that the rest of the code is the same.
If we open the two binaries side-by-side, we can rapidly pinpoint that the unidentified routine has indeed been modified between the two samples. For example:
Sample 736bda643291c
Sample 9a72f971944fc
It appears the hardcoded list of searched MAC addresses (represented by their MD5 hashes) has been modified between the two samples.
Conclusion
We hope this blog post demonstrated how SiglibGen allows users to speed up their analysis by easily re-using their work. Remember that signatures can be generated in a lighter manner directly from JEB UI (as shown in the auto-signing mode video). As usual, do not hesitate to contact us if you have any questions (email, Twitter, Slack).
Note: SiglibGen might set .parsers.*.AnalysisStyle and .parsers.*.AllowAdvancedAnalysis engines option to specific values suitable for signatures generation, without restoring the original values after the generation. For now, JEB power-users have to manually restore these two engines options to the intended values after having generated signatures (menu Edit>Options>Engines). This will be fixed in next release JEB 3.4.
Annex: SiglibGen Log Files
A typical SiglibGen run will produce several log files (in the same folder):
File Name
Purpose
siggen_stat.log
Summary log (number of signatures created, etc). A new entry is appended to the log file at each signature generation.
siggen_report.html
Complete HTML log file; each signed routine is shown with the corresponding features and attributes.
conflicts.txt
Conflict resolution file; users can tweak here the decisions taken when several routines have the same features (and then regenerate the signatures).
removals.txt
Removals resolution file; users can tweak here the automatic decisions regarding removing certain signatures (and then regenerate the signatures) .
More formats could be handled, do not hesitate to contact us if you have such needs. ↩
While the signatures shown in this blog post will also be generated in a false positive free manner, SiglibGen allows to build more flexible signatures; this will the topic of another blog post. ↩
If signatures were built to be strict (i.e. not allowing any modifications to the original routine), this can be far from trivial, as the library needs to be compiled with the exact same options as the analyzed executable. ↩
There are numerous excellent analysis available for Operation ShadowHammer, like the one from CounterCept. ↩
Note that thanks to JEB recursive processing, the embedded executable does not need to be extracted, and can be directly analyzed within the original JEB’s project ↩
See Annex for a description of all log files produced by SiglibGen. ↩