Debugging Android apps on Android Pie and above

Update (March 2020): It looks like the problem highlighted below regarding the impossibility to read locals that do not have associated DebugLocalInfo on Android P and Q was fixed in Android R (verified with the Developer Preview 1 released on Feb 19). The patch solving this issue is likely this one.

Lower-level components of the Dalvik debugging stack, namely JDWP, JVM TI, and JVM DI implementations, were upgraded in Android Pie. It is something we indirectly noticed after installing P.beta-1 in the Spring of 2018. For lack of time, and because our recommendation is to debug apps (non-debuggable and debuggable alike) using API levels 21 (Lollipop) to 27 (Oreo)1, reversers could easily avoid road blocks which manifested in JEB as the following:

  • An empty local variable panel (with the exception of this for non-static methods)
  • Type 35 JDWP errors reported in the console, indicating that an invalid slot was being accessed
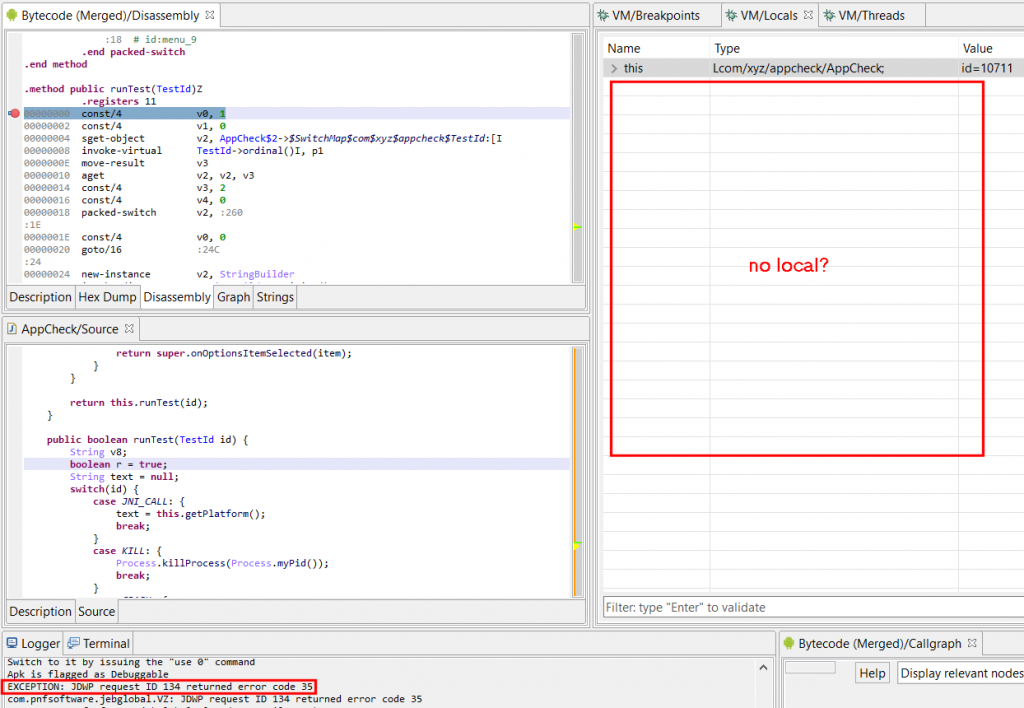
Since JEB 3.2 is out, I decided to revisit that error before jumping into anything else2

A type 35 error in this context means an invalid local slot is being accessed. In the example shown above, it would mean accessing a slot outside of [0, 10] (per the .registers directive) since the method declares a frame of 11 registers.

The second type of noticeable errors (not visible in the screenshot) were mix-ups between variable indices. Normally, and up to the JDWP implementation used in Android Pie, indices used to access slots were Java-style parameter indices (represented in Dalvik as pX), instead of Dalvik-style indices (vX). Converting from one to the other is trivial assuming the method staticity and prototype is known. It is a matter of generating pX so that they end up at the bottom of the frame. In the case above:

v0    p2
v1    p3
v2    p4
..
v9
v10   p0
v11   p1

When issuing a JDWP request (16,1) to read frame slots, we would normally use pX indices. It is no longer the case with Android P and Q: vX indices are to be used.

Open up JEB, start debugging any APK, switch to the Terminal view, and type ‘info’. In the context of JDWP, this JEB Debugger command issues Info and Sizes requests. Notice the differences:

=> On Android Oreo (API 27):

VM> info
Debuggee is running on ?
VM information: JDWP:"Android Runtime 2.1.0" v1.6 (VM:Dalvik v1.6.0)
VM identifier sizes: f=8,m=8,o=8,rt=8,fr=8

=> On Android Pie (API 28) and Android Q:

VM> info
Debuggee is running on ?
VM information: JDWP:"Java Debug Wire Protocol (Reference Implementation) version 1.8
JVM Debug Interface version 1.2
JVM version 0 (Dalvik, )" v1.8 (VM:Dalvik v0)
VM identifier sizes: f=4,m=4,o=8,rt=8,fr=8

Notice the reported version 1.2 for JVM DI, previously unspecified, and reported version 1.8 for JDWP, likely the cause of the breakage. Also note ID encoding size updates. JDWP had been reported a 1.6 version number, as well as field and method IDs encoded on 8 bytes, for as long as I can remember.

The vX/pX index issue was easily solved. It took a little while to crack the second issue. A superficial browsing of AOSP did not show anything fruitful, but after digging around, it seemed clear that this updated implementation of JDWP used CodeItem variables’ debug information to determine which variables are worth checking, and using what type.
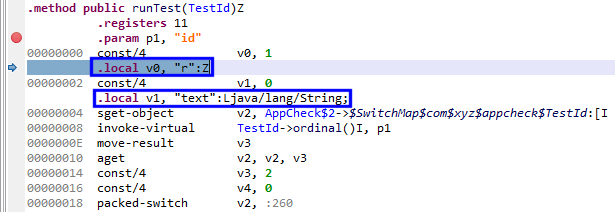
In JEB, right-click and select Rendering Options, tick Show Debug Directives to display variable definition and re-definition information. In the example above, the APK holds information stating that v0 is being using as a boolean starting at address 2, and v1 a String starting at address 4. Android P+’s JDWP implementation does use this information to validate local variables accesses.

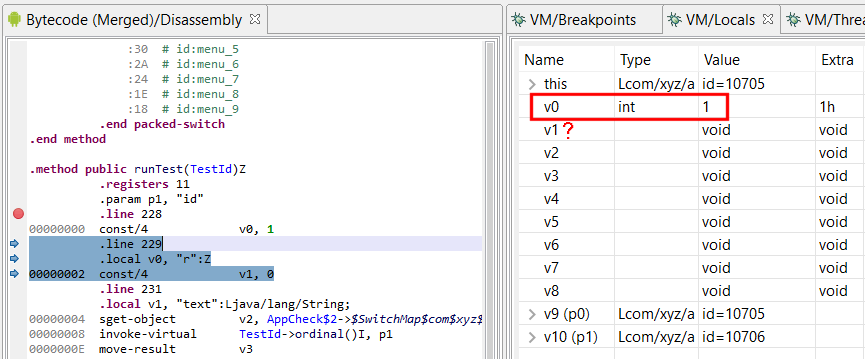
See below: at address 2, v0 has been declared and is rendered. v1 has not been declared yet, the debugger cannot read it (we’ll get error 35).
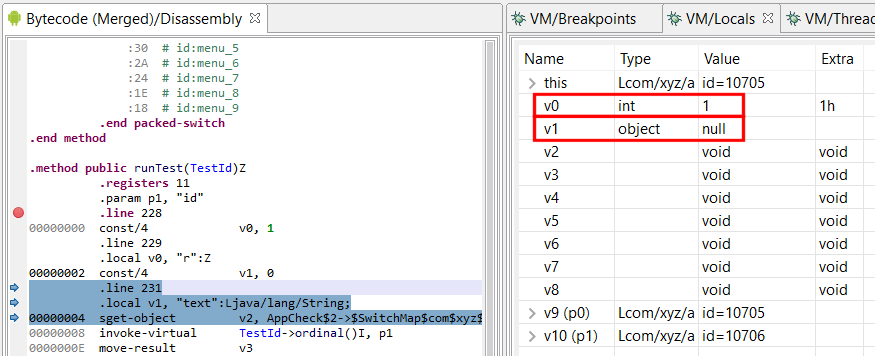
Single-step: at address 4, v1 is declared. Although it is uninitialized, the debugger can successfully read the var:
So – Up until P, this metadata information, when present (almost all Release-type builds of legitimate and malware files alike discard it), had been considered indicative. Now, the debugger takes it literally. There are multiple candidate reasons as of why, but an obvious one is Safety. JDWP has been known to have the potential to crash the VM when receiving reading requests for frame variables using a bad type. E.g., requesting to read an integer-holding slot as a reference would most likely crash the target VM. Using type information providing in metadata, a debugger server can now ensure that a debugger requesting to read a slot as type T is indeed a valid request – assuming the metadata is legitimate, and since the primary use case is to debug applications inside IDE, which hold source information used to generate valid debug metadata, the assumption is fair.

Validating access to local vars has the interesting side-effect to act as an anti-debugging feature. While debugging the app remains possible, not being able to easily read some locals (parameters pX are always readable though), can be quite an annoyance.

In the future, how could we work around the JDWP limitation? Well, aside from the obvious cop out “use Oreo or below”, an idea would be to extend JEB’s –makeapkdebug option (that generates a debuggable version of a non-debuggable APK) to insert DEX metadata information specifying that all variables of a frame are used and of a given type. That may not work depending on the type of validation performed by the DEX verifier, but it’s something worth exploring. Maybe more simply, an alternative could be a custom AOSP build that disabled that feature.3 Or better yet, finding if a system property exists to disable/enable that JDWP functionality.

A final note: debugging non-debuggable APKs on Android Pie or above also proved more difficult, if not practically impossible, than on Oreo and below. Assuming your phone is rooted, here’s a solution (found when browsing around AOSP commits). On a rooted phone:

> adb root
> adb shell setprop dalvik.vm.dex2oat-flags --debuggable
> adb shell stop
> adb shell start

Until next time – Thanks!

  1. Still a valid recommendation.
  2. Native decompiler upgrades are around the corner!
  3. If a charitable soul could point us to where in AOSP that would be, we’d greatly appreciate it? 🙂

Android Updates in JEB 3.2

As the latest update makes its way to all users (changelog), it is a good time to quickly recap additions related to Android analysis that made it into JEB versions 3.1.4, 3.1.5, and 3.2.

Dalvik Decompiler Updates

The newest releases of JEB contain several improvements to the Dalvik decompiler. I will highlight only a couple that users may find interesting. 1

Enumerations

Compiled Java enumerations can be complicated beasts. JEB attempts to re-sugar them to the best of its ability. On failure, regular classes extending java.lang.Enum will be rendered.

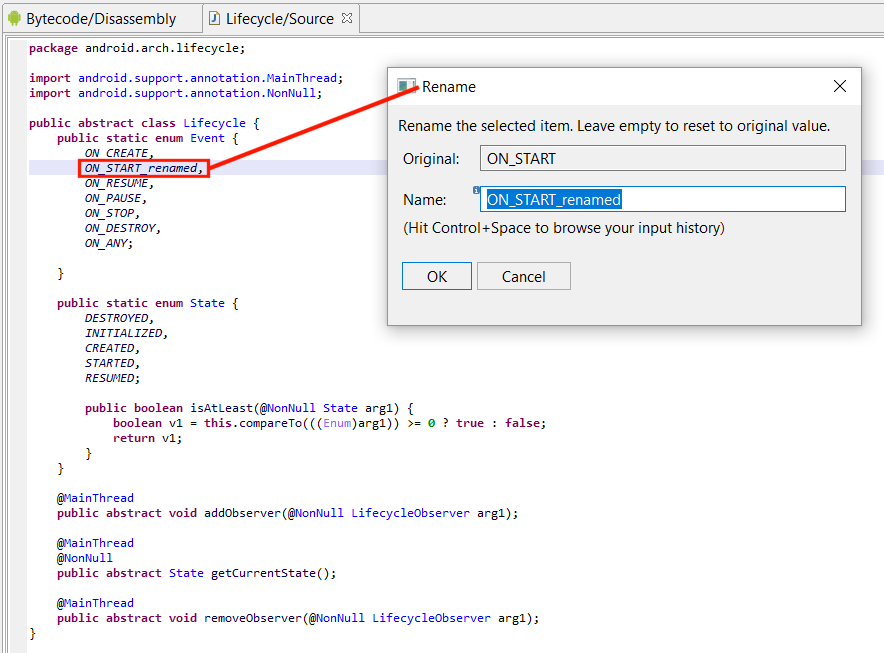
Obfuscation sometimes destroy important synthetic fields and structures that allow recovery heuristics to work. However, support should function reasonably well, even on enumeration data that was intentionally shuffled to generate decompilation errors. Moreover, and to keep with the spirit of interactivity in JEB, enumerated fields can be renamed – and it is done consistently over the code base, including over reconstructed switches making use of such enums.

Decompiled enums in android.arch.lifecycle. Renaming and cross-referencing enumerated constants is supported.

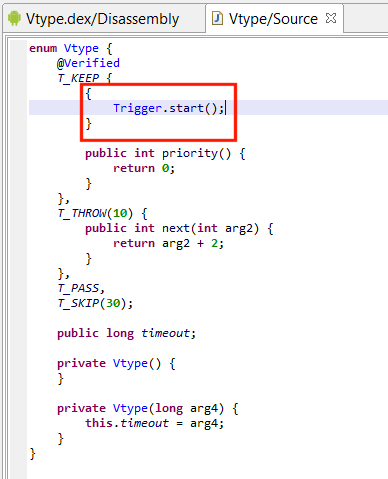
Custom enumerated constants are also properly reconstructed, including:

  • Field annotations
  • Custom initializers (see below)
  • Additional methods and method overrides
In this complex enumeration, the red block shows a custom initializer. Other interesting bits are the use of overrides and custom methods, annotations, as well as default and non-default constructors.

Switches

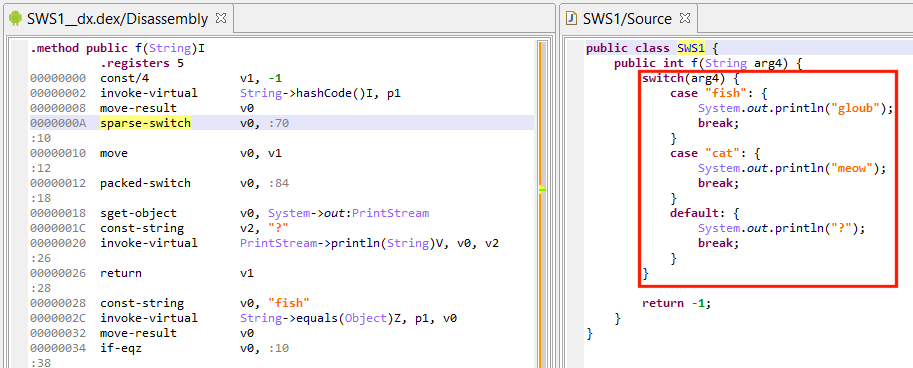
Support was recently added for switch-on-enum and switch-on-string (partial support for the latter, to be continued in the next software update).

This successfully reconstructed switch-on-string is implemented as a double-switch idiom by dx (a sparse switch on hashCode/equals to generate custom indices i, followed by a packed-switch on i). Not all switches are implemented like this. Regular if-conditional trees may be strategically generated by optimizing compilers.

Inner classes, Anonymous classes

We improved rendering support for named- and anonymous-inner classes. Properly rendering anonymous classes in particular is made difficult by the fact that some of its arguments are captured from the outer classes. Properly rendering anonymous constructors, with exact argument types and position, is also challenging.

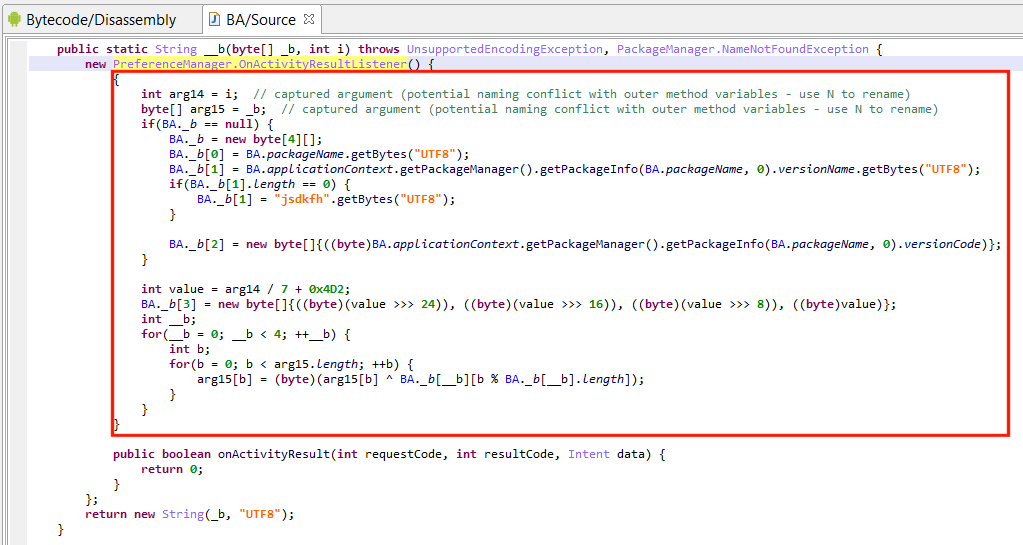
Lately, a user sent us a sample making use of an anonymous class initializer to hide string decryption code. See below:

  • The anonymous class extends Android’s OnActivityResultListener, instantiates the object, and tosses it immediately.
  • Decryption code takes place in the initializer. Note the captured arguments from the outer container method __m: i, _b. Access to other private class fields is made via synthetic accessor calls that were re-sugared into seemingly direct field access (BA._b).
Pseudo-moot anonymous class with an instance initializer attempting to conceal string decryption code.

Plugin options

Remember that some decompiler properties are publicly available in the options: (menu: Edit, Options, Advanced, Engines)

  • All Dalvik decompilation options: see the .parsers.dcmp_dex.* namespace
  • All Java rendering options of decompiled code: see the .parsers.dcmp_dex.text.* namespace

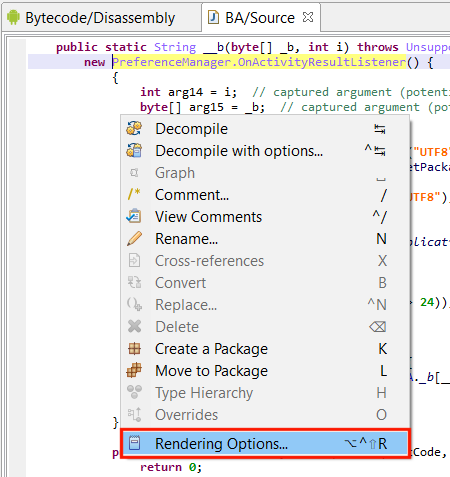
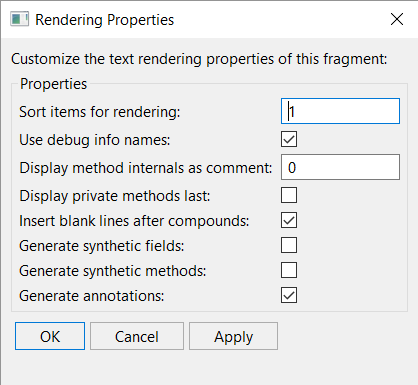
1)Rendering options are real-time options that can be changed after the fact to customize the output. Right-click on a decompiled class output, and select Rendering Options:

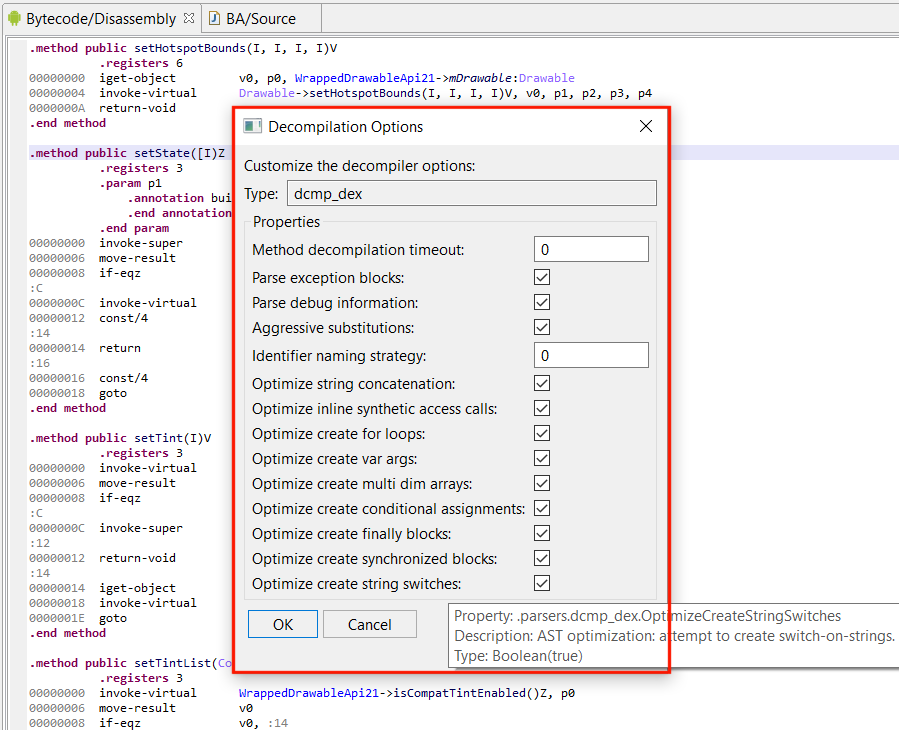
2) Decompilation options are used to guide and customize the decompilation. They can be changed in the Engines options, or more simply, when performing a decompilation itself, by invoking “Decompile with Options…” instead of “Decompile”.

Keyword for “Decompile with Options”:
CTRL+TAB (Windows, Linux) or COMMAND+TAB (macOS)

Bring up the “Decompile with Options” dialog by using CTRL+TAB/COMMAND+TAB when decompiling. Hover over properties to get extra documentation in the tooltip.

API additions

Essential updates to:

  • IJavaSwitch: additional methods to access switch-on-enum and switch-on-string data
  • IJavaForEach: additional type introduced to manipulate for-each statements: for(Type var: iterator_or_array) { … }

Other changes, What next

JEB 3.2 contains other improvements, such as:

  • Better auto-naming, including default usage of debug data, if present (can be disabled in the options)
  • Improved typing and type propagation
  • Additional IR and AST optimizations
  • Better exceptional flow processing
  • Rendering of try-catch, synchronized blocks, etc.
  • Decompilation of invoke-polymorphic (invoke-custom is not supported, see below the part on lambdas on method handles)

We have more planned for the coming releases, including:

  • Improved support for switch-on-string. As said earlier, some of those switches, when properly detected, are re-sugared into legal Java-8 switch-on-string. However, the nature of those high-level constructs (they are implemented as double-conditionals, sometimes double-switches) makes it quite hard in some cases to provide proper reconstruction. It is something that will be improved in the future.
  • Support for generics. We had decided to not implement Java 5-style type generic since the information, when provided, is stored as pure metadata and should not be trusted. However, in practice, it turns out to be helpful when auditing legitimate, non-obfuscated compiled apps. We will add optional support for that in a coming release.
  • Support for try-with-resources. try(resource)/catch/finally are difficult very-high-level idioms to reconstruct. Optimizing compilers generate a substantial amount of additional, highly optimized code to implicitly catch exceptions and auto-close resources, making it extra difficult to reconstruct in the general case. We will likely introduce partial support before the summer.
  • Lambdas. It is a planned addition. We will soon be re-sugaring Android implementations of Java 8+ lambdas into proper lambda functions. Same goes for method handles (::). That’s quite exciting and may pave the way for a hypothetical Kotlin decompiler, since that language implicitly and explicitly rely on lambdas extensively.

Debuggable APK Generation

For several reasons, it is easier to debug Android applications explicitly marked debuggable in their Manifest.

  • Debugging non-debuggable APK requires root access to the operating system. Which means rooting a production phone, using an emulator
    2 image built as userdebug, or building a custom userdebug image from AOSP.
  • Any of the above solutions have shortcomings: rooted production builds and userdebug builds expose features that non-rooted production builds do not have, and can be fingerprinted as such; Debugging native code of applications on non-rooted devices requires replacing system-level utilities; the API level and OS features also play a role, eg, SE-Android needs to be disabled on recent OS in order for debugging to work.

In many cases, rebuilding a release app into a debug-mode app (with <application android:debuggable=”true” …>) is a viable solution, and one that does not require using root, obviously. Many users are implementing this solution via apktool. However it is frequent for the tool to fail decoding complex APKs, let alone rebuild them with different settings.

We have introduced a feature in JEB that makes rebuilding non-debuggable APK to debuggable APK easy and fast:

$ jeb_wincon.bat -c --makeapkdebug -- file.apk

Upon success, file_debuggable.apk will be generated. Sign it (Android SDK’s apksigner), install it on your device, and start debugging. Remember that this solution has its shortcomings as well! Anti-debugging code may check at runtime that the app is not debuggable, as would be expected. More elaborate solutions implement certificate pinning-style checks, where the code verifies that it is signed using a specific certificate. Be careful when debugging rebuilt APK.

This malware app was made debuggable

Keyboard Shortcuts for Script

Bind your JEB Python scripts to keyboard shortcut by adding a line at the top of your script:

#?shortcut=xxx

where xxx is your keyboard shortcut, eg: Ctrl+Shift+T

Permitted keyboard modifiers are Ctrl, Shift, Alt, as well as the generic Mod1, mapping to macOS’s Command (Apple) key, or Control on Windows/Linux.

Sublime Text 3 Extension

Are you writing Python scripts to automate your JEB reversing tasks? If so, give a try to using the “JEB Script Development Helper” package available on Sublime Text’s Package Control.

JEB Python scripts with Sublime Text

To install it:

  • Install ST3
  • Install Package Control
  • Open the Package Control and Install a new extension
  • Search for “JEB” and install the extension

The extension allows you to:

  • Auto-completion on JEB types and attributes
  • Auto-import JEB classes: CTRL+ALT+I on a class names
  • Easily create script skeleton (CTRL+SHIFT+P, “JEB: Create a new script”)
  • Easily update to the latest API doc, usually published right after a new release (CTRL+SHIFT+P, “JEB: Update to latest API doc file”)

API changes

Recent API changes are not specific to Android components of JEB. You will find updated sample code on GitHub.

  1. If you are seeing unintended changes or bugs related to this update, let us know so that we can fix things quickly.
  2. Emulator here means an emulator running a userdebug Android build, as Google-provided images are