We’re kicking off a malware analysis series explaining how to use JEB Decompiler to perform reverse engineering tasks ranging from out-of-the-box actions to complex use cases requiring scripts or custom plugins.
In this first entry, we look at a Windows malware compiled for x86 32-bit targets. The malware is an Ethereum cryptocurrency stealer. It monitors and intercepts clipboard activity to find and replace wallet addresses by an address of its own — presumably, one controlled by the malware authors to collect stolen ether.
Quick look at the malware
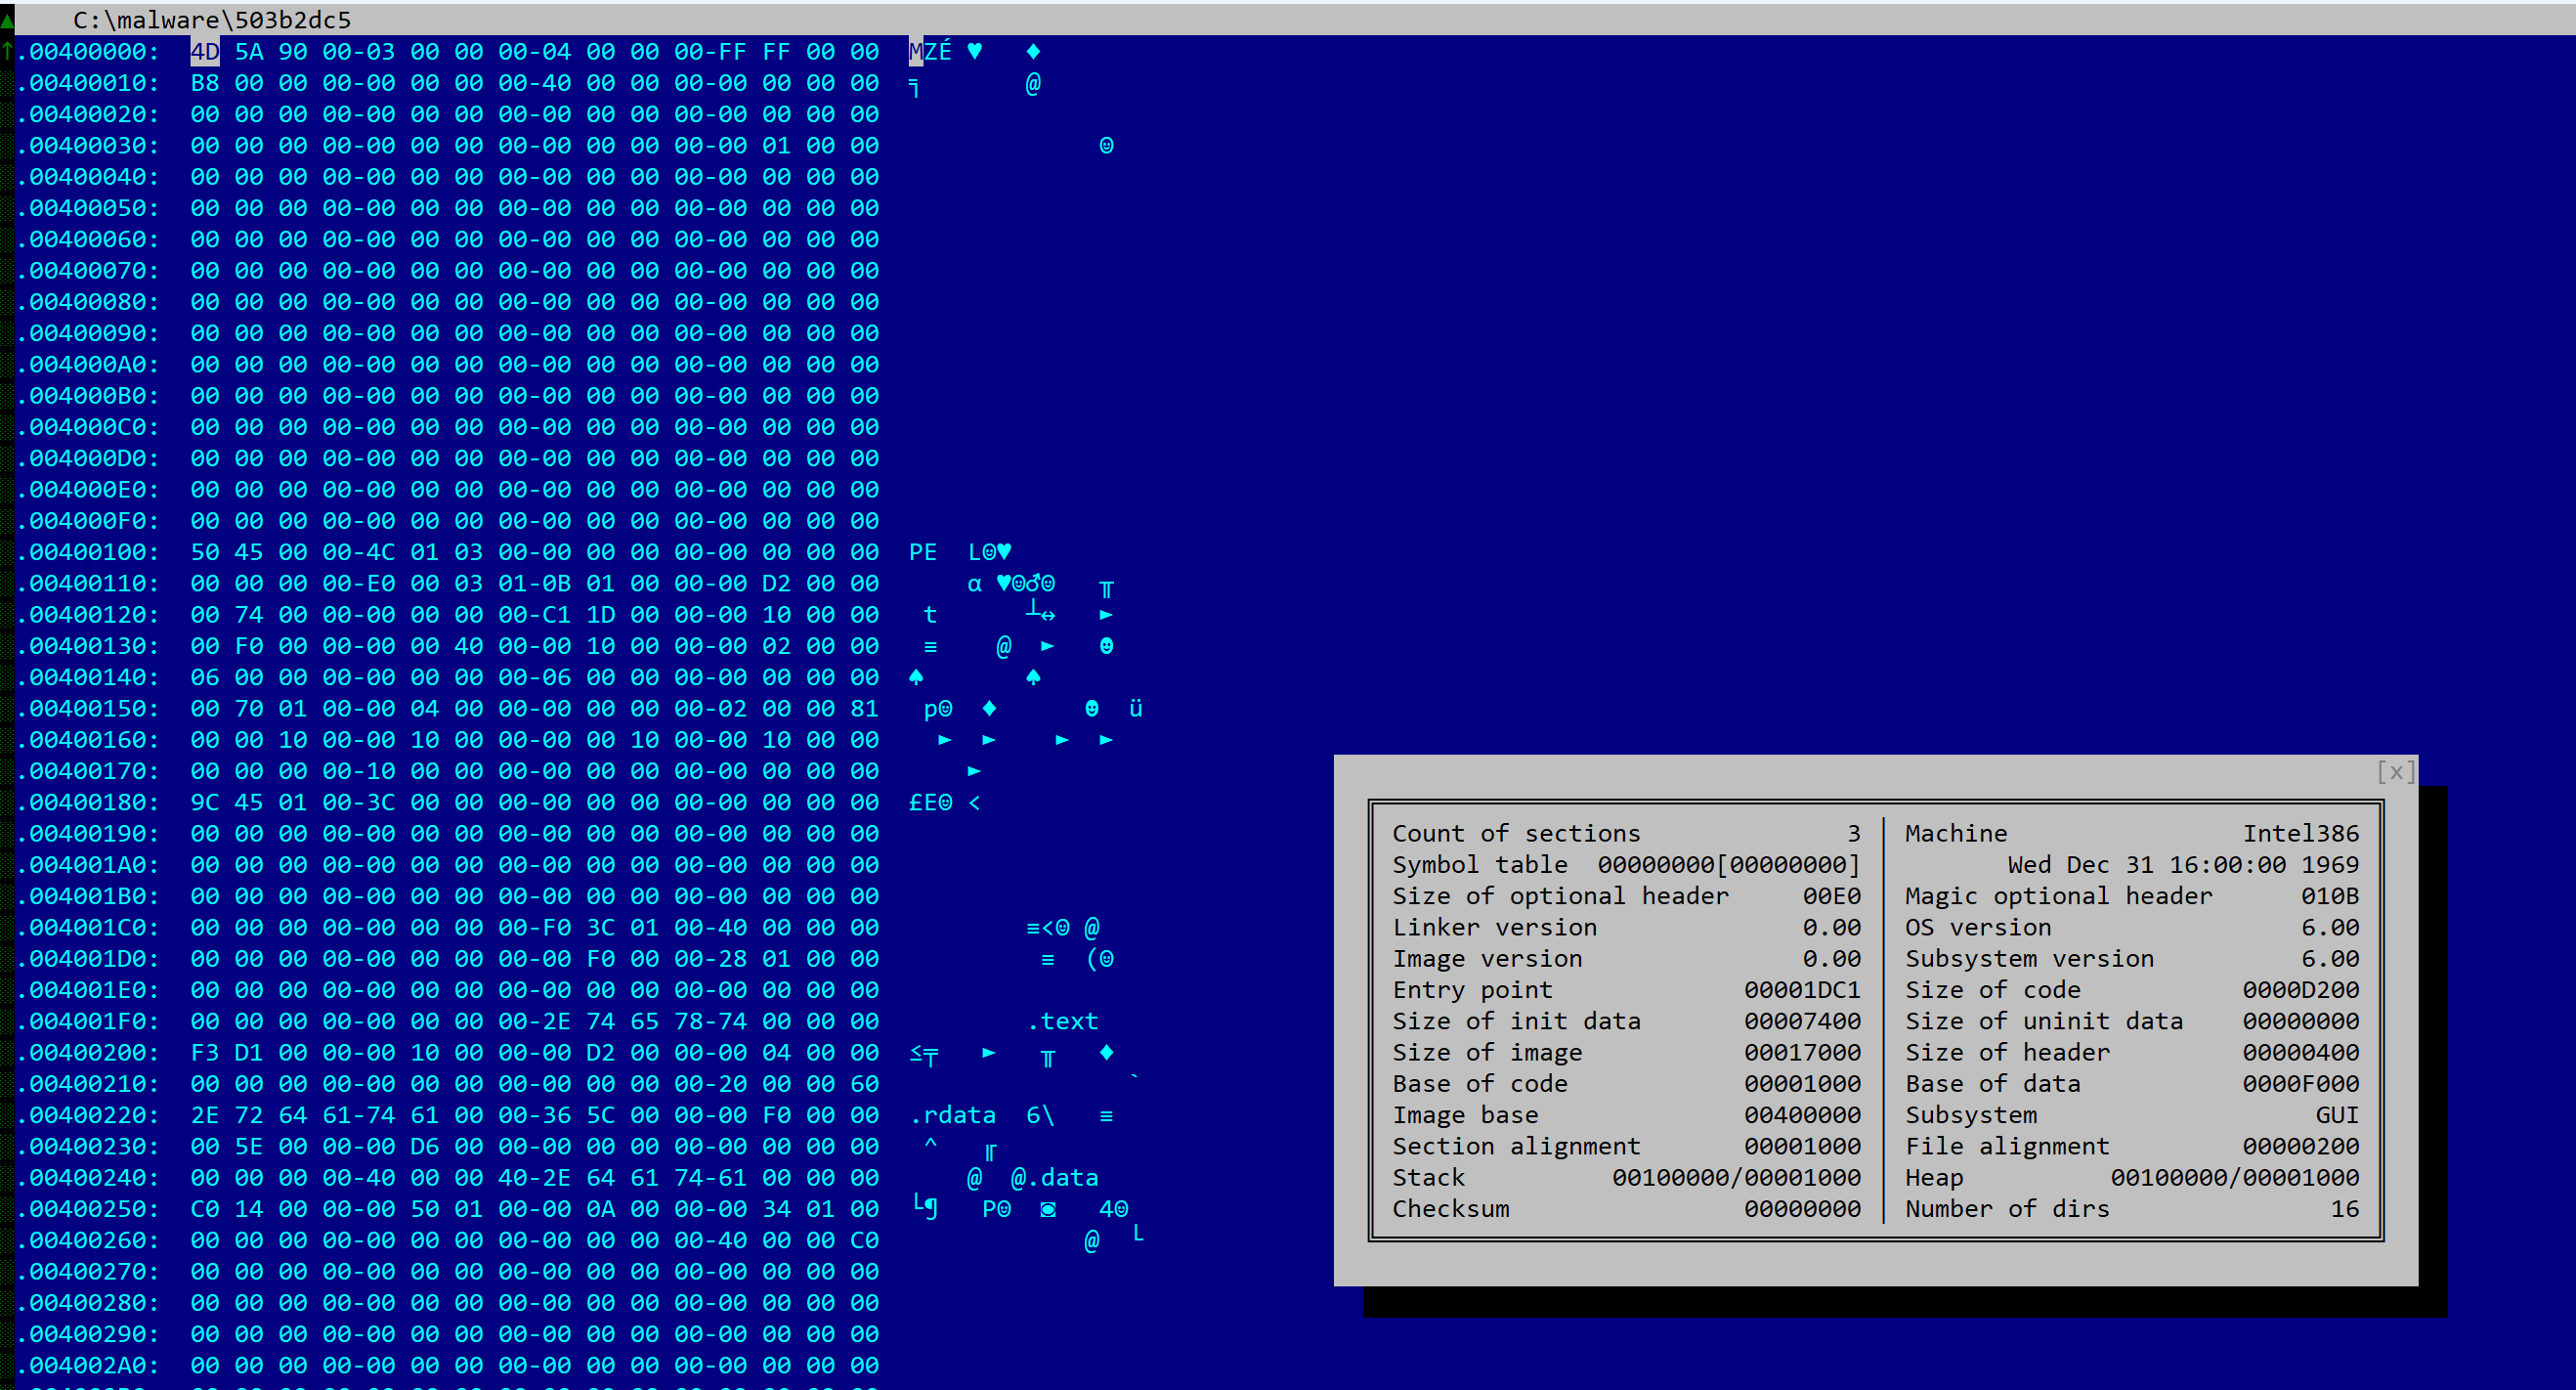
The file has a size of 81Kb, is compiled for x86 platforms. Although it does not appear to be packed, most metadata elements of the PE header were scraped. There is no rich data or timestamp.
SHA256: 503b2dc50262be583633db7b52dca9bcadc698413270047c209818436196c987
If you are familiar with JEB, its terminology, and the organization of its UI elements, you may skip the next section and go directly to “Examining the code”.
Opening the file in JEB
Let’s fire up JEB. Any recent build (5.7+) with the x86 analysis modules and decompiler will do, i.e. JEB Community Edition or JEB Pro.
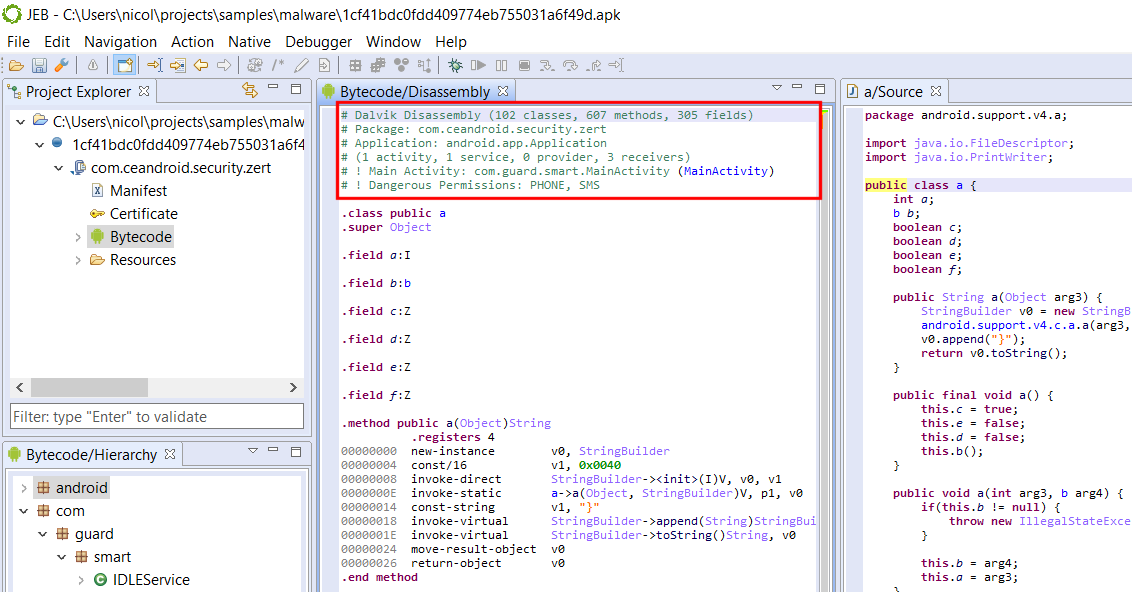
Project and units
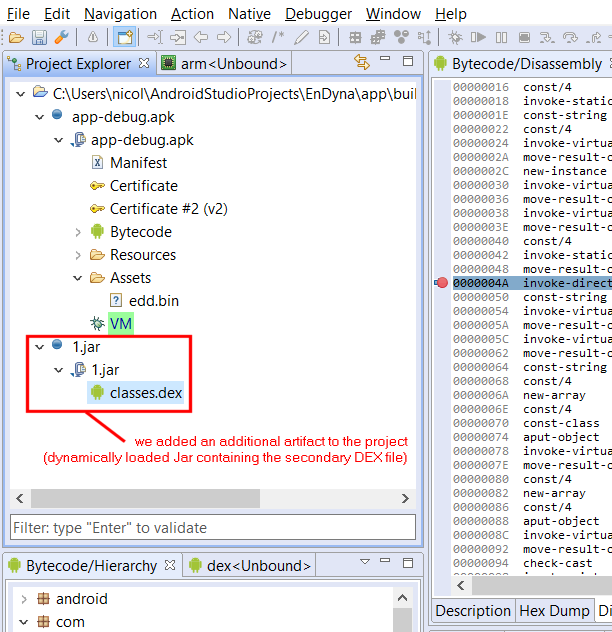
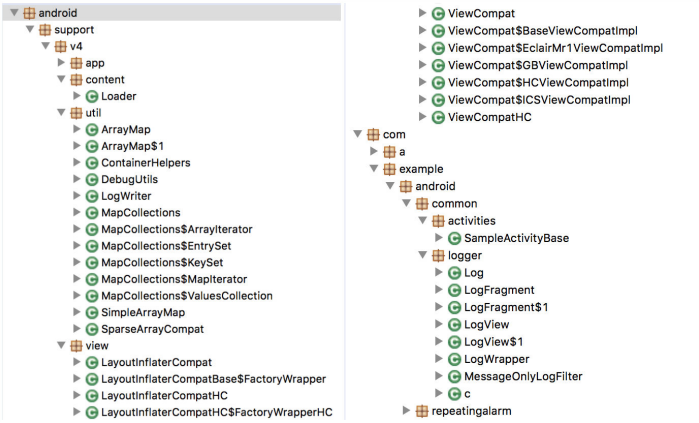
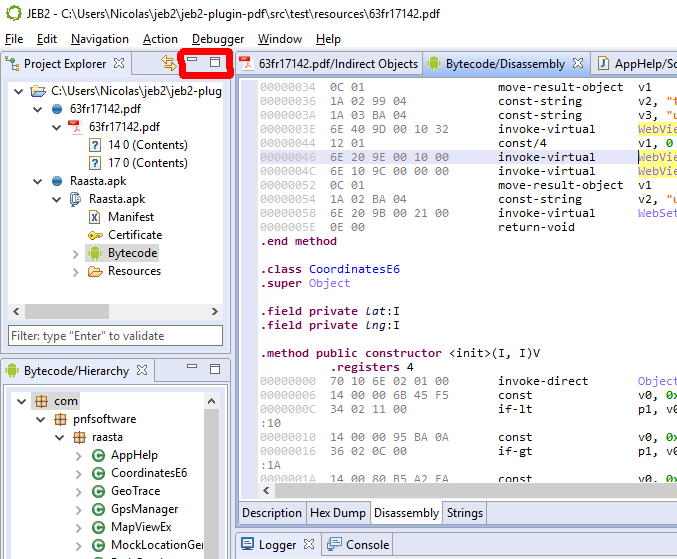
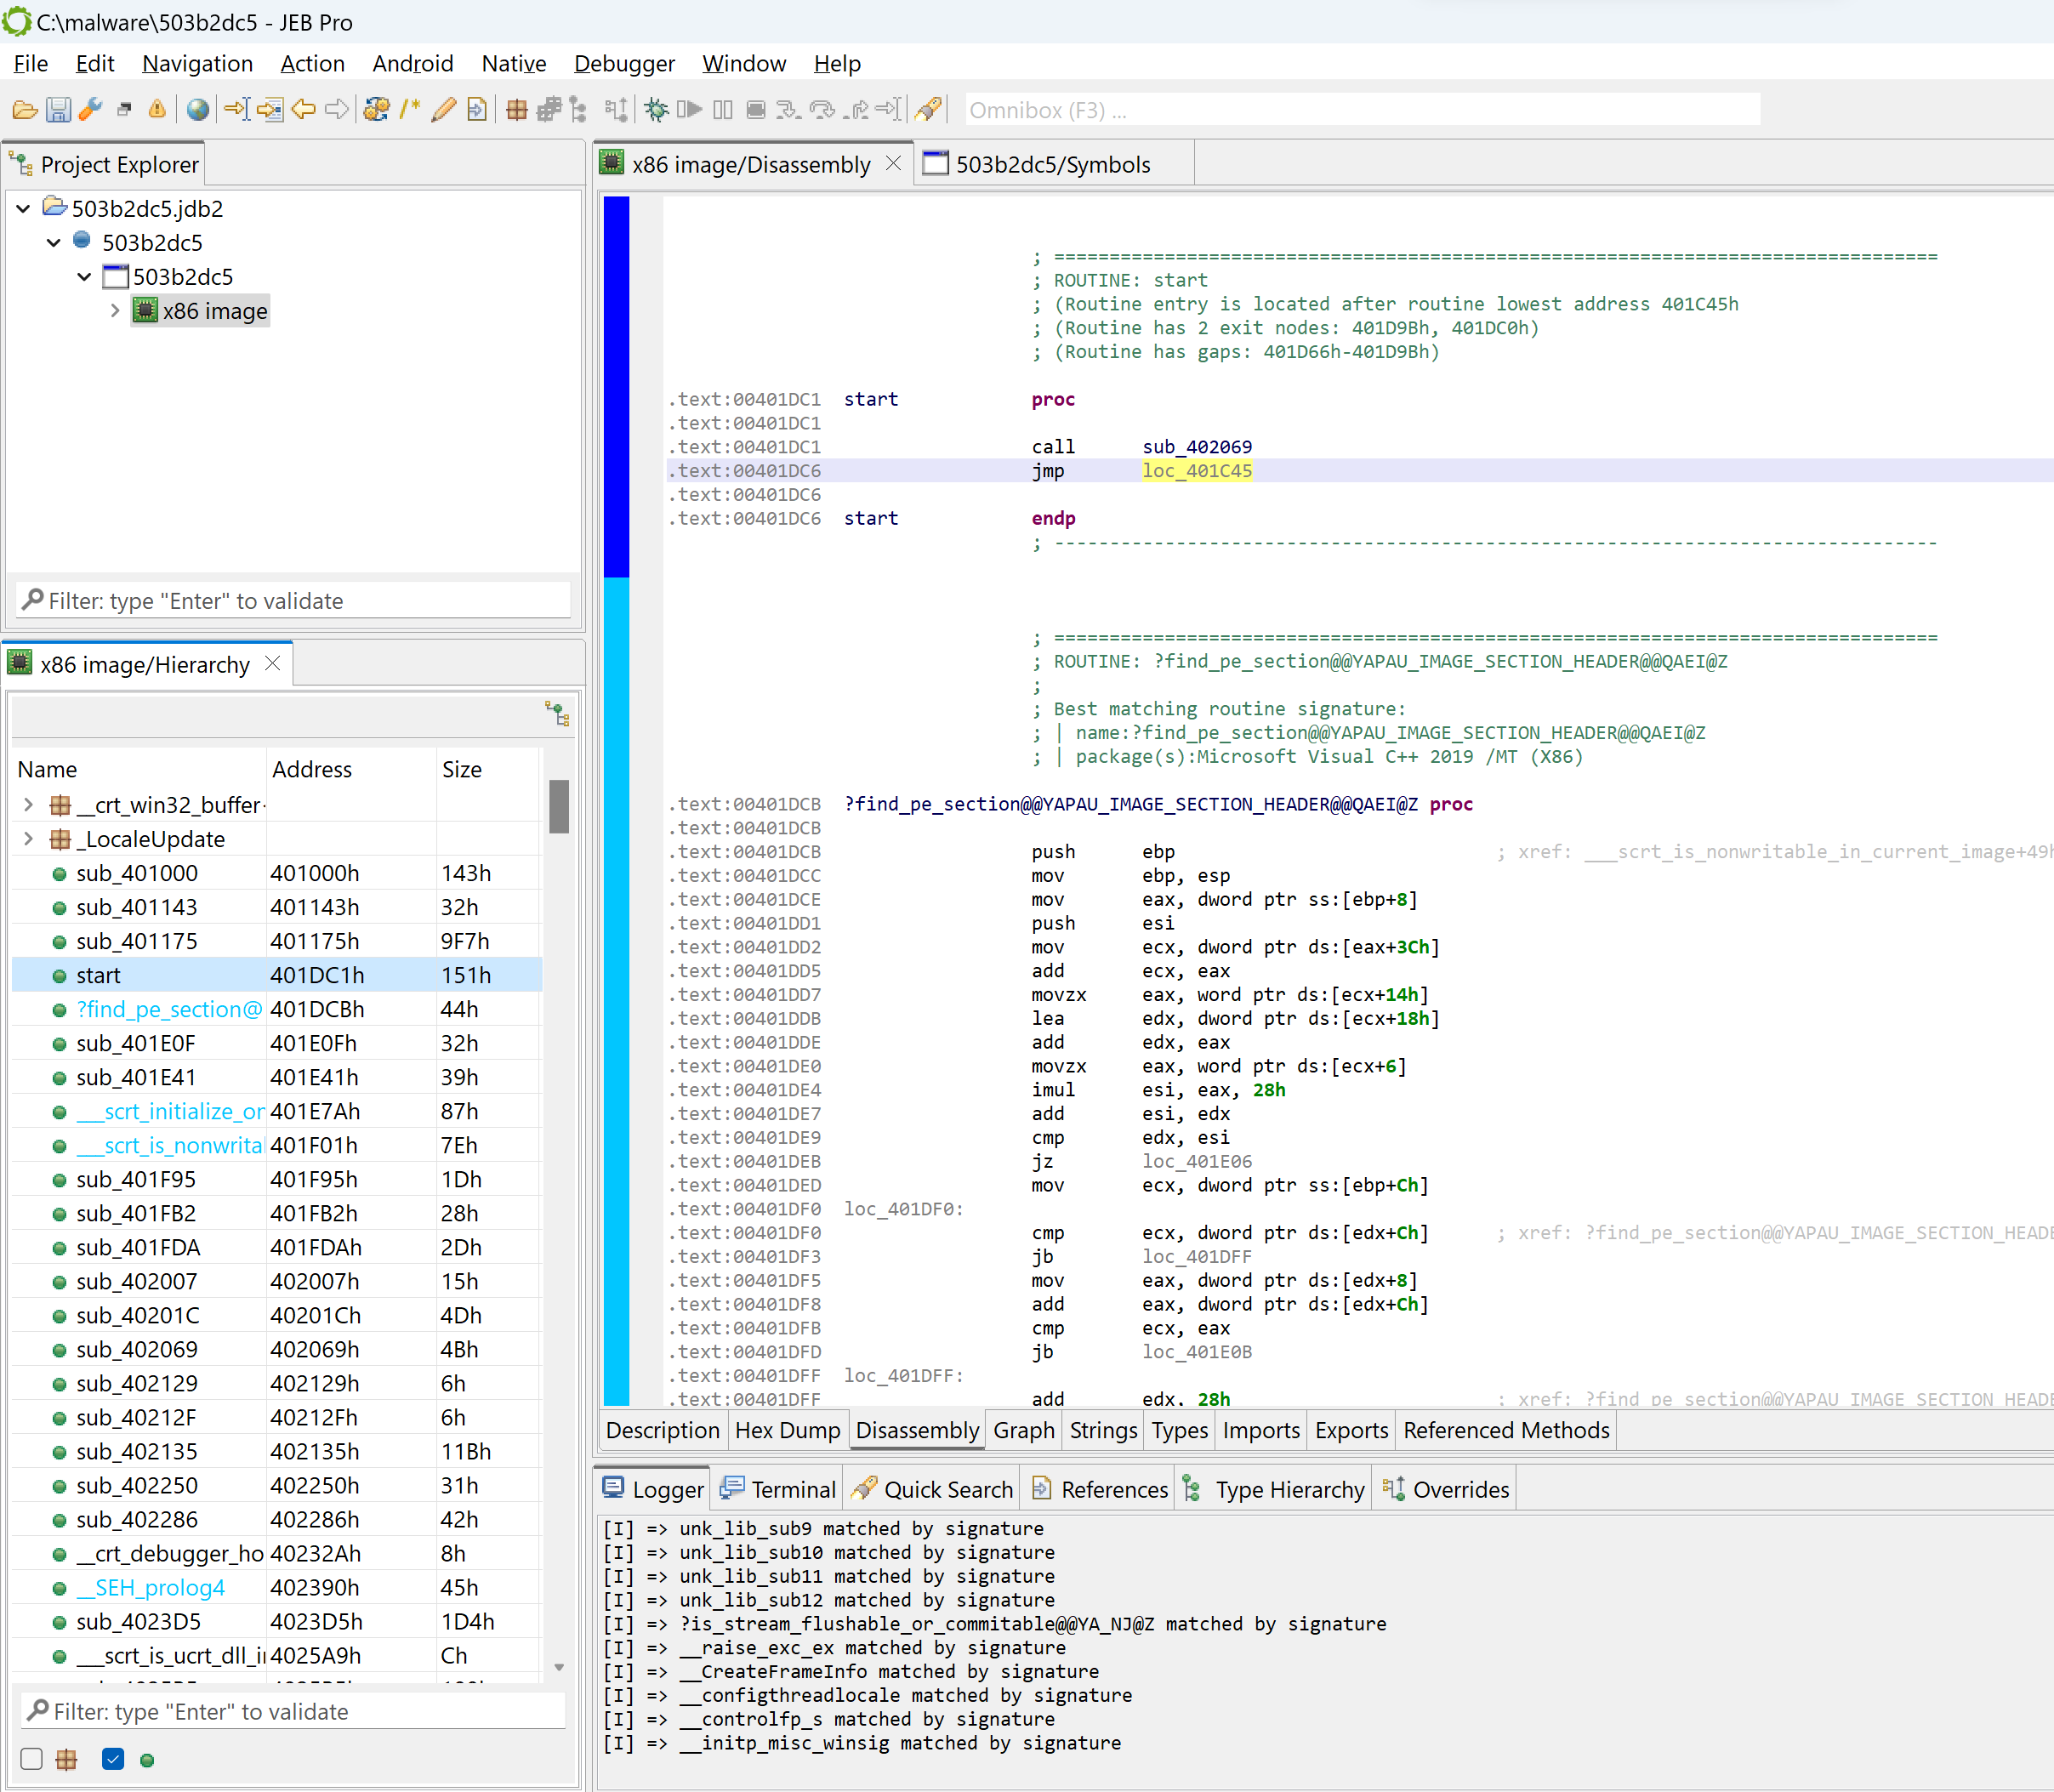
The top-left view shows the project, along with a single artifact (the input file) and the analysis units created by JEB:
- The artifact file has a blue-round icon
- The top-level unit is a
winpeunit - It has one child unit at the moment, named “x86 image”, of type
x86.
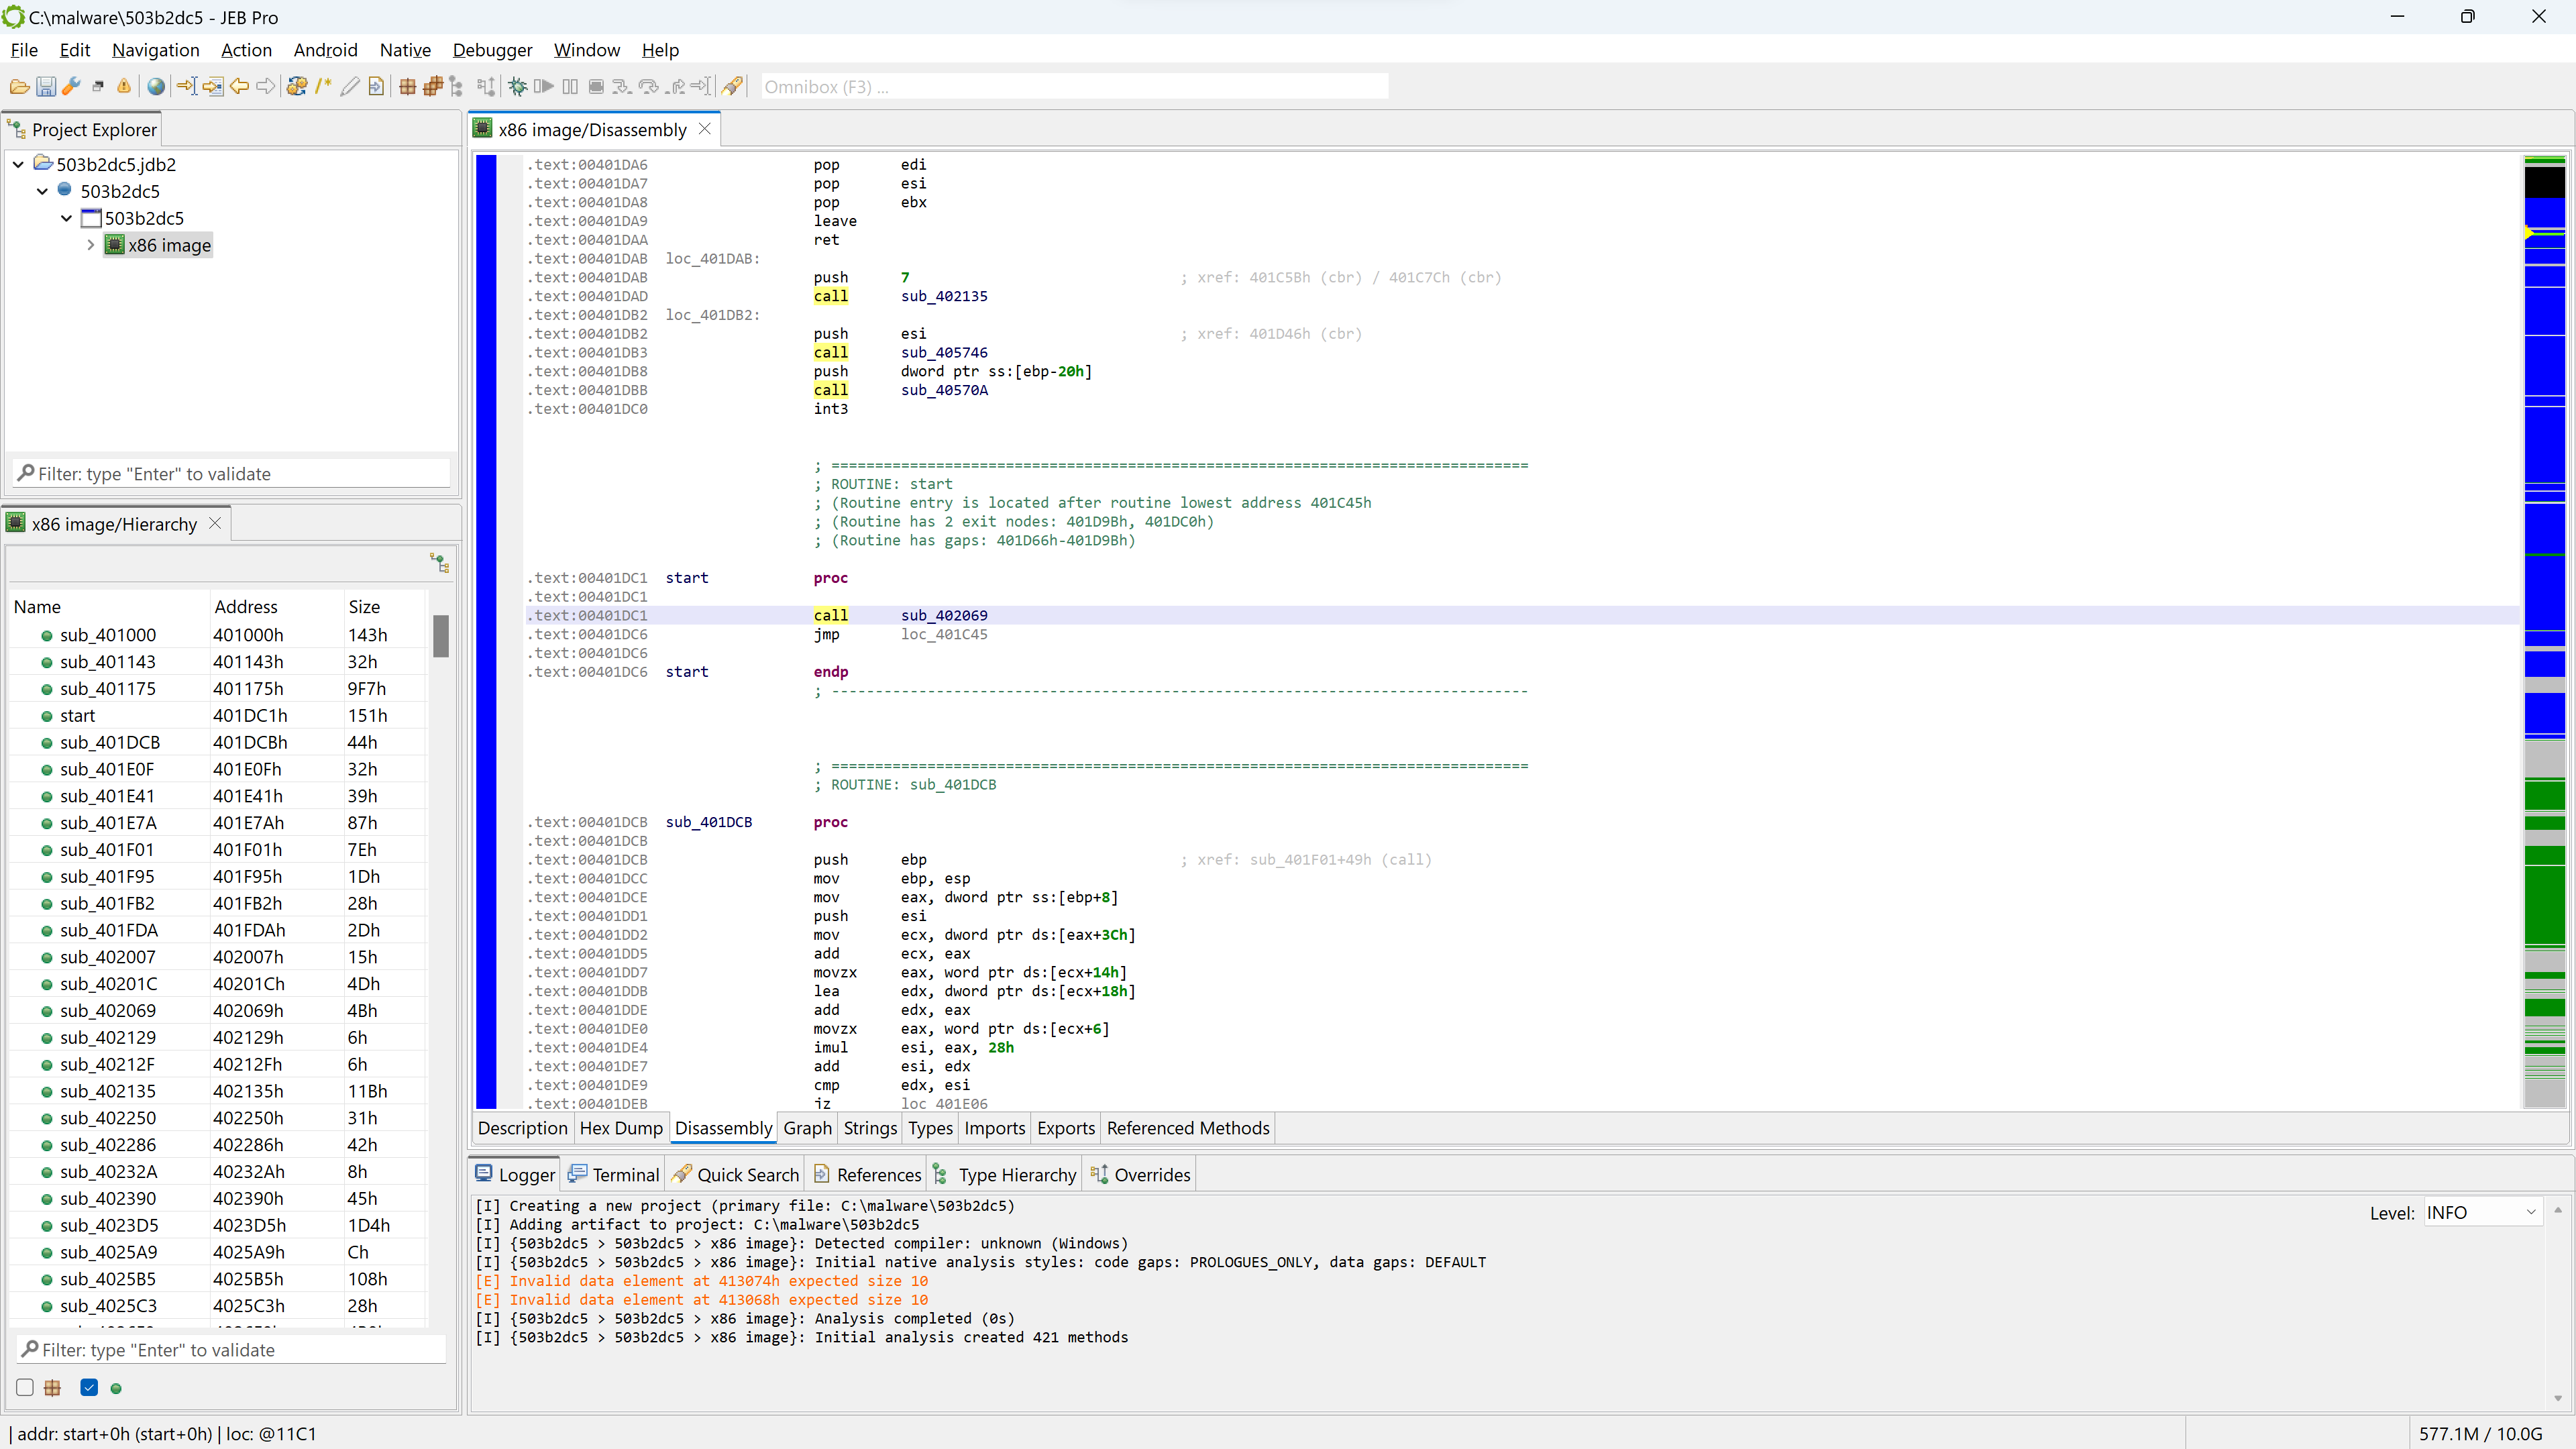
The bottom-left view shows a list of code routines resulting from the analysis of the file.
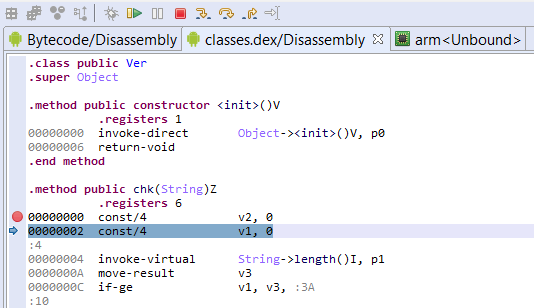
Disassembly
By default, the main panel shows the disassembly window.
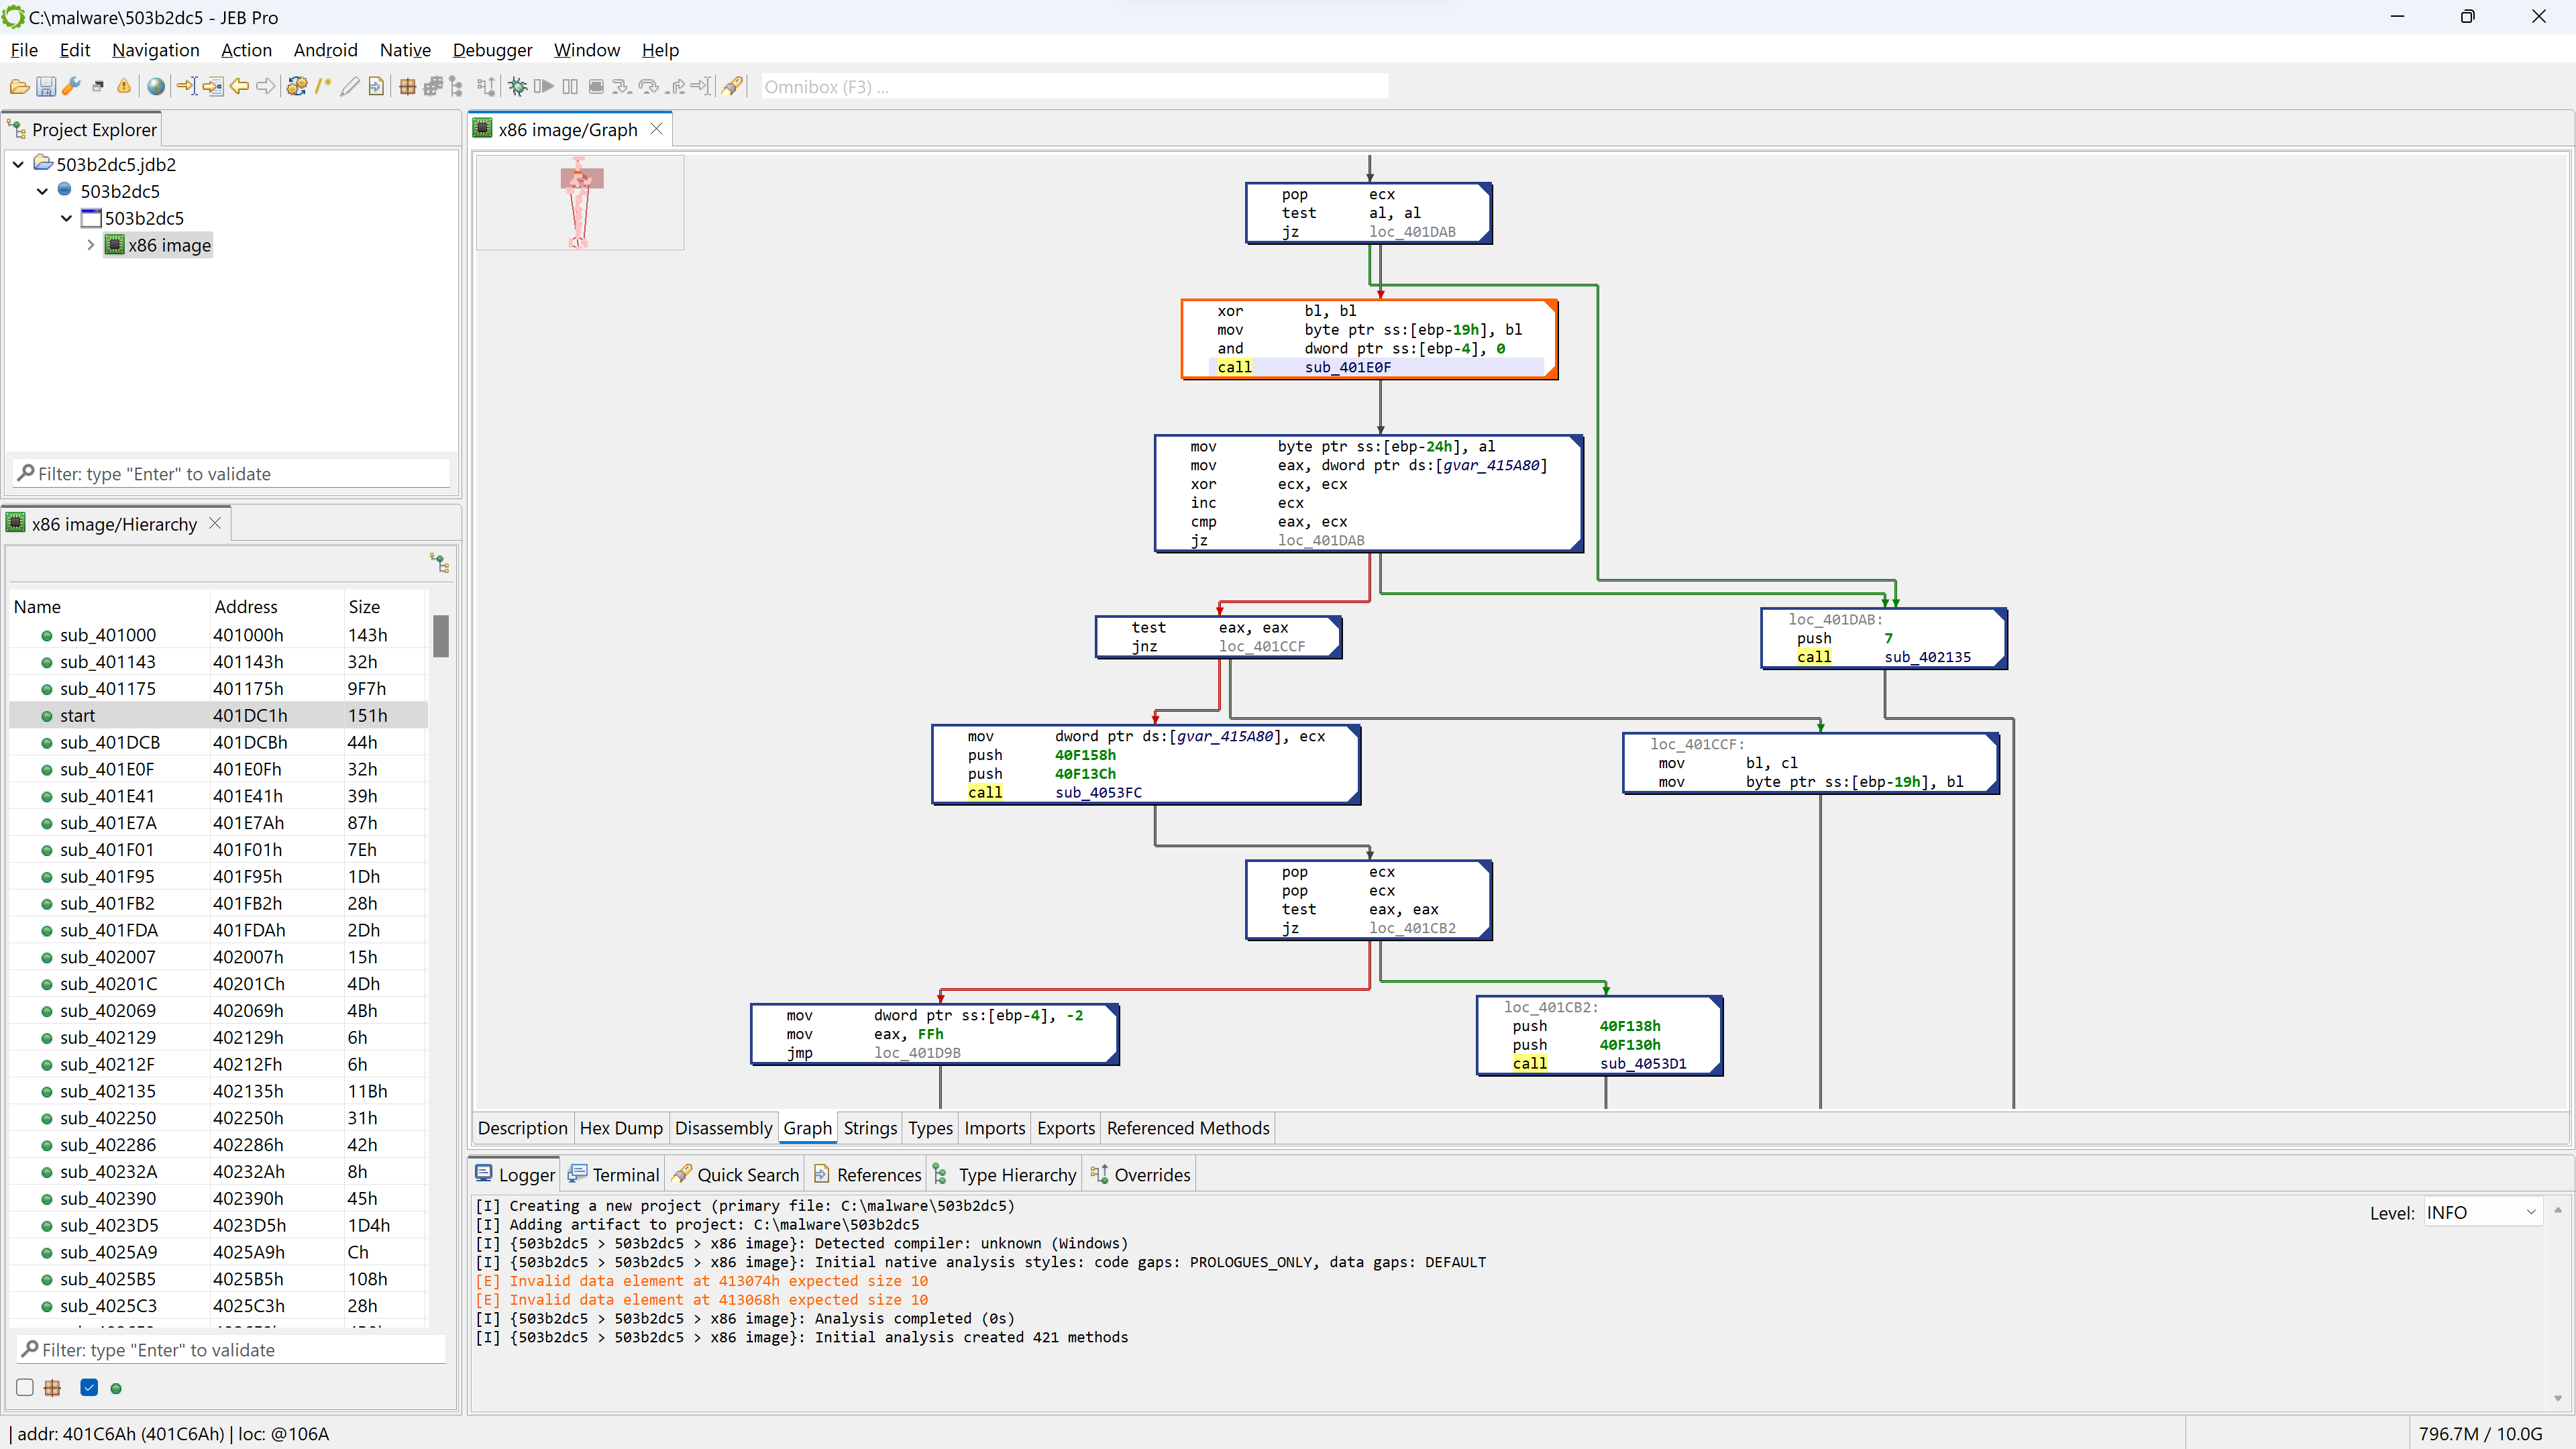
You may press the SPACE bar to switch to a graph view of the code (menu: Action, Graph…). In the graph view, only a single method is rendered at a time.
PE unit
If you wish to have a look at the PE file in more details, open the winpe unit. Double-click the corresponding node in the project hierarchy.
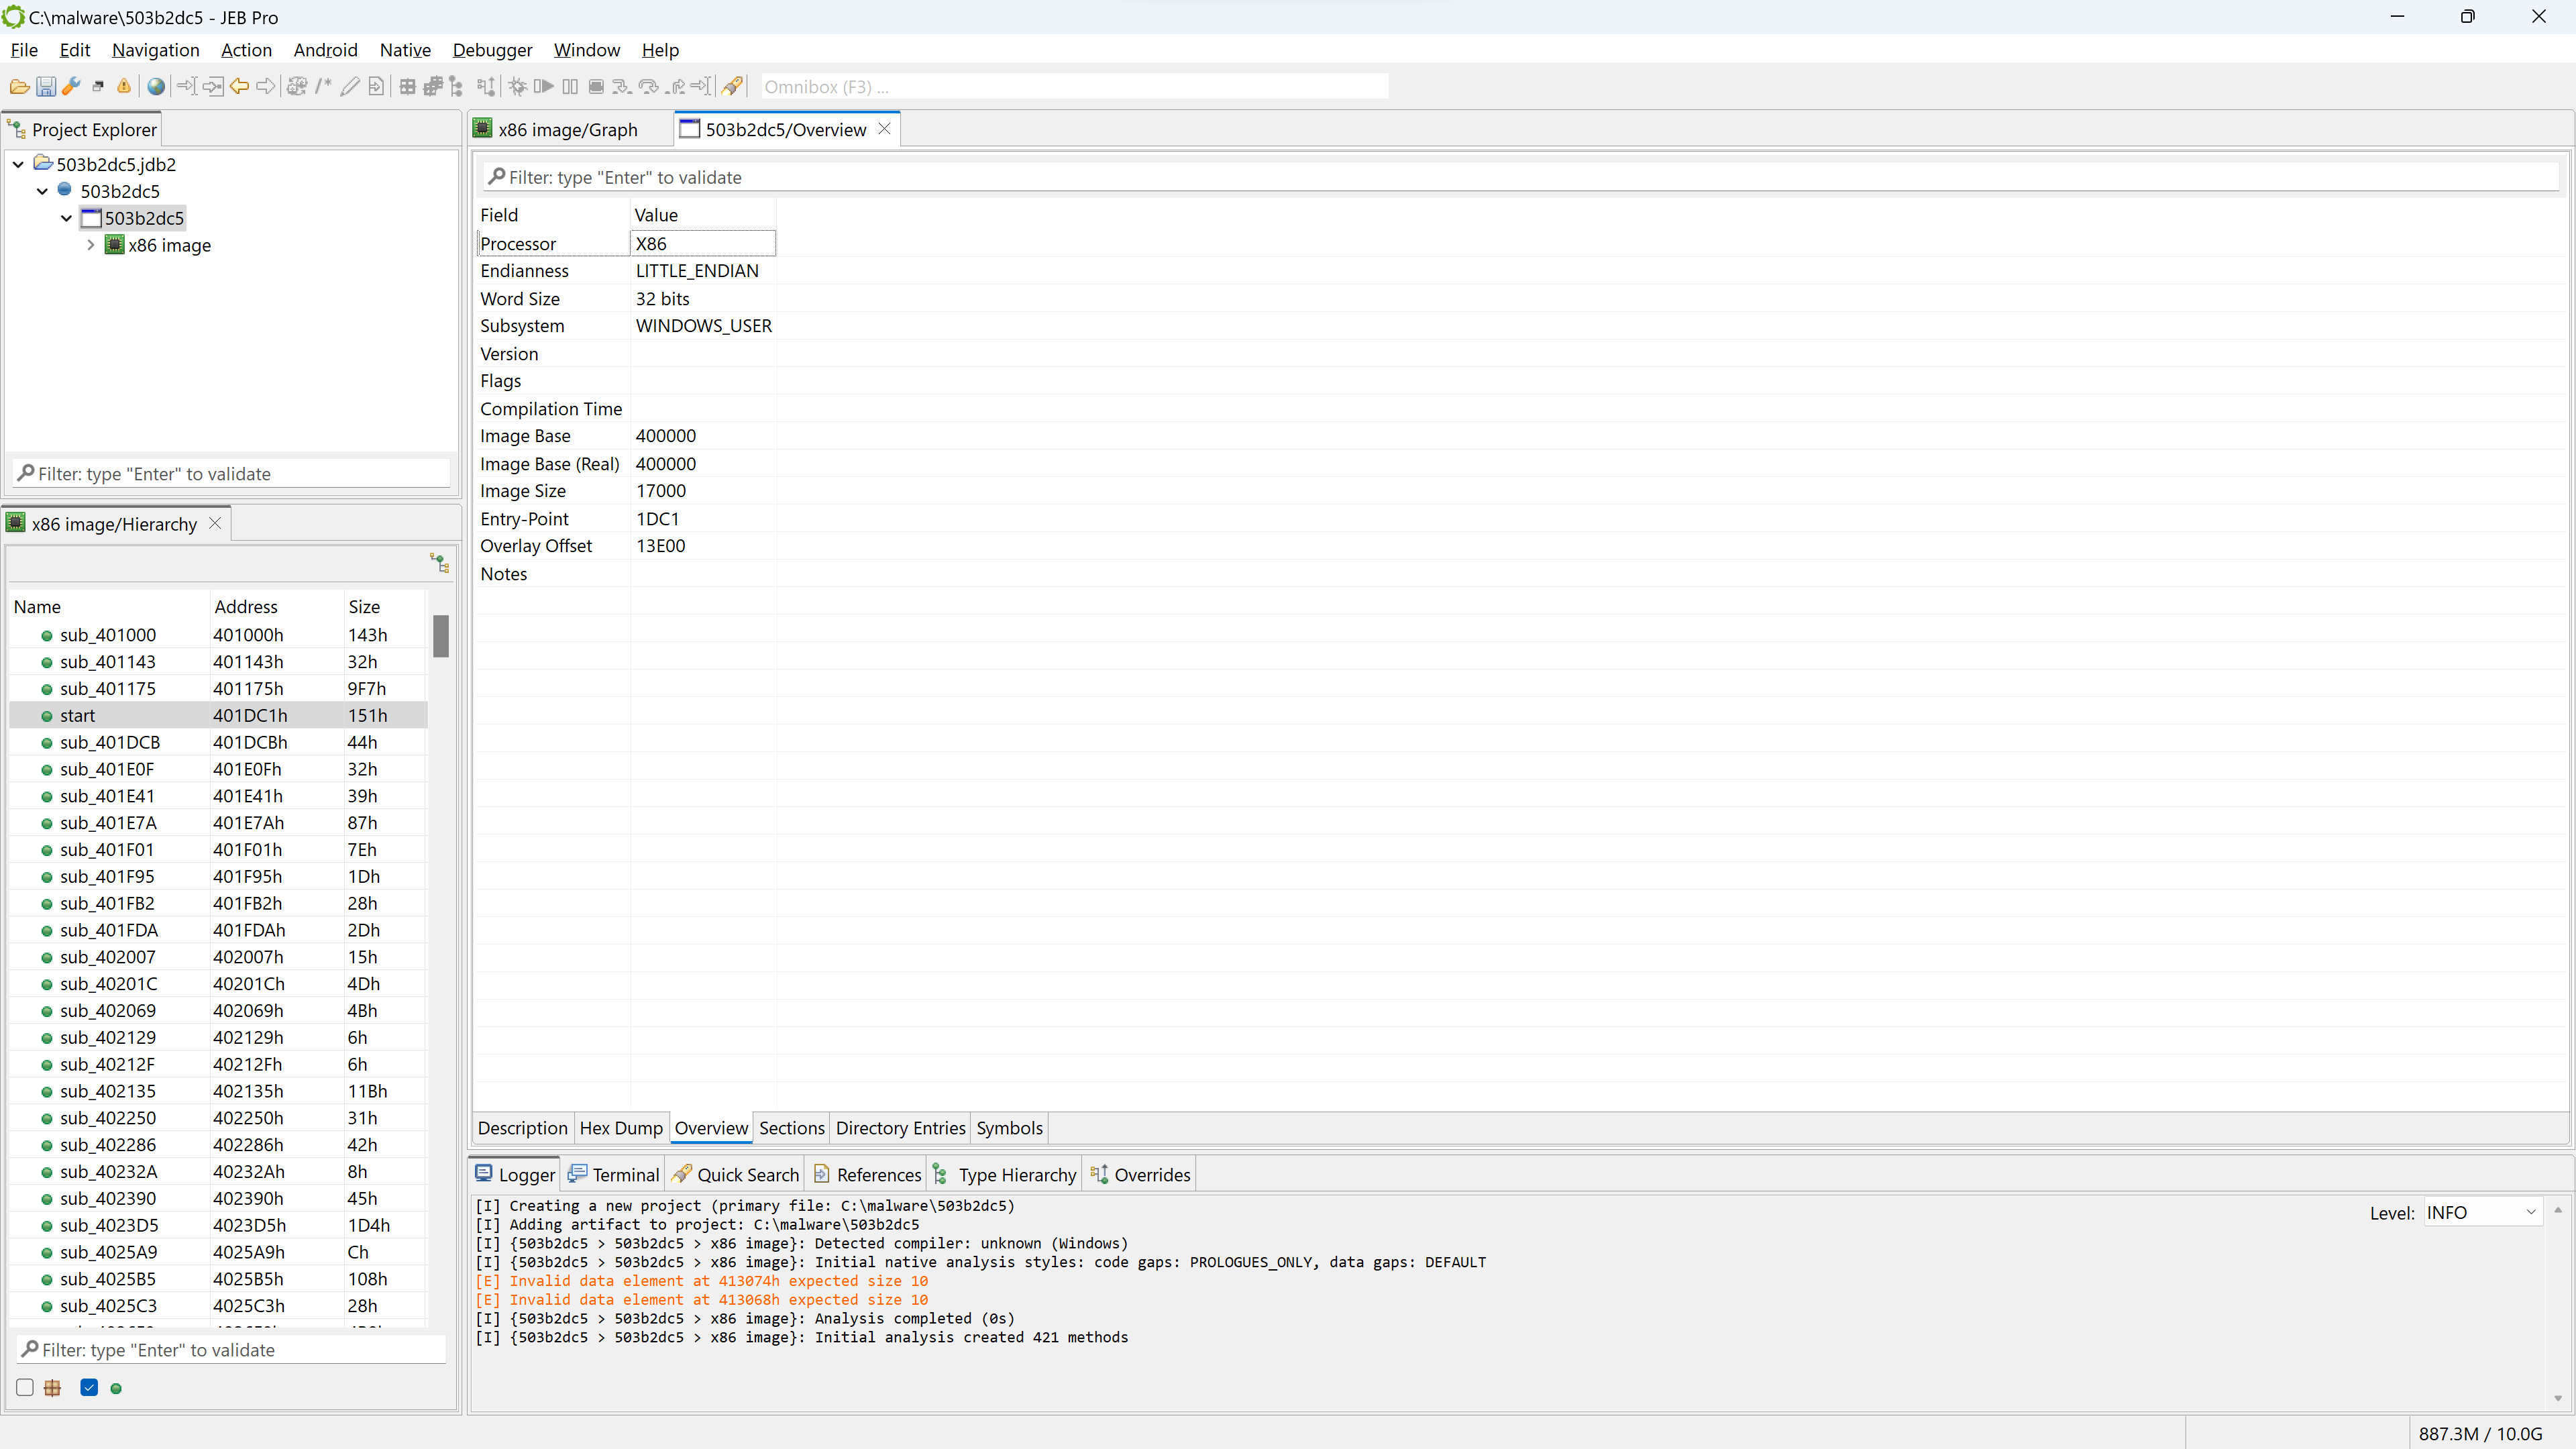
The winpe unit view provides several information, organized in fragments that can be seen below the unit view: Description, Hex Dump, Overview (the default fragment), Sections, Directory Entries, Symbols, etc.
Note that if the PE had not been stripped, we would probably see a compilation timestamp as well as additional sub-units detailing the Rich Header data. For Windows executables, that data is important to perform fine-grained compiler identification.
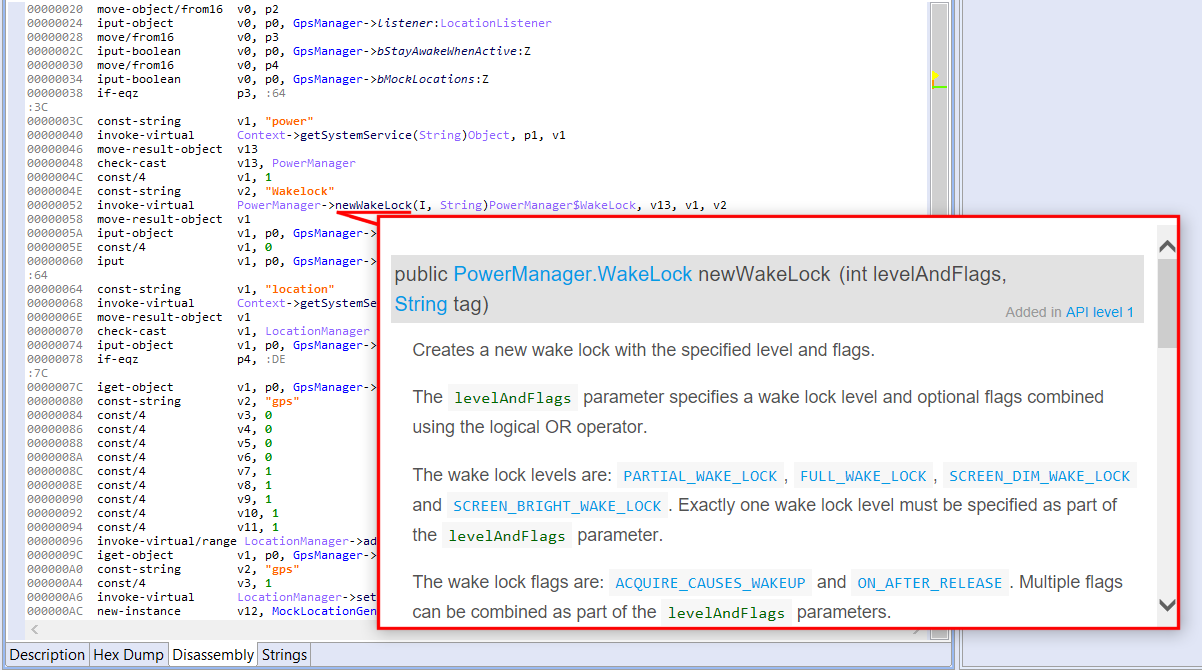
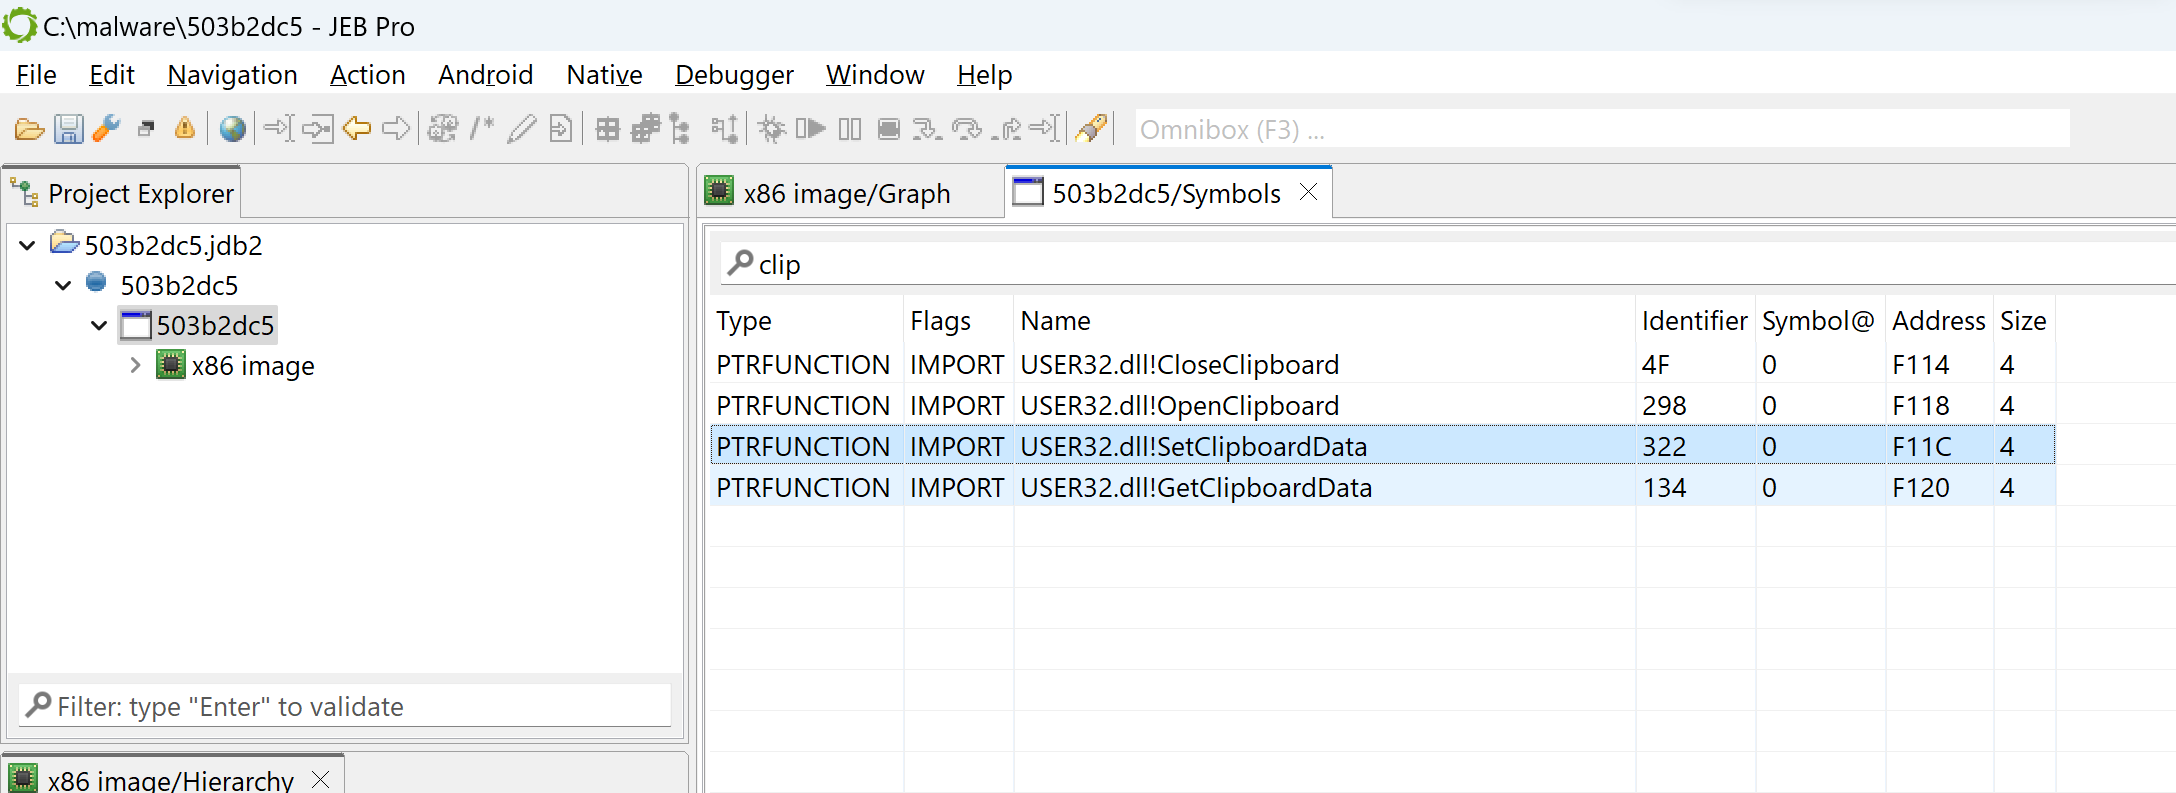
The Symbols tab lists all symbols advertised by the PE, including imported and exported routines. For example, if you filter on “clip”, you can see multiple win32 routines relating to clipboard access, such as OpenClipboard or SetClipboardData:
Examining the code
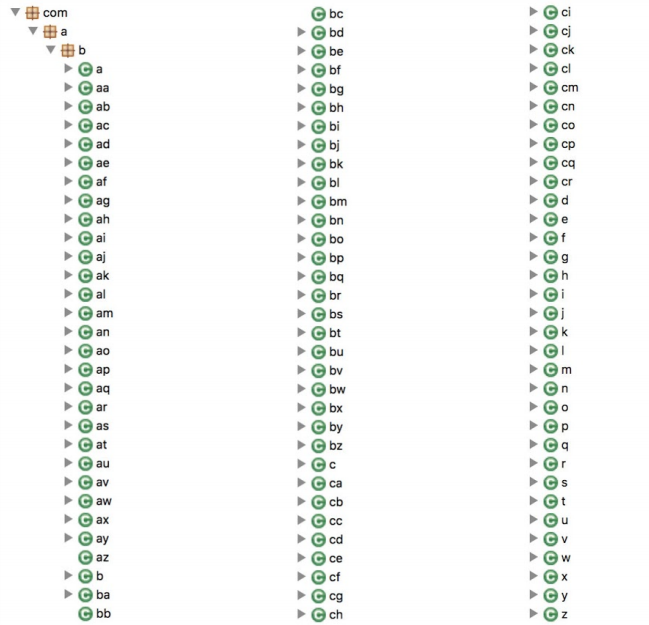
Let’s go back to the disassembly offered by the x86 unit. First, notice that the code hierarchy view does not seem to contain well-known methods (static code), typically standard library routines linked at compile-time.
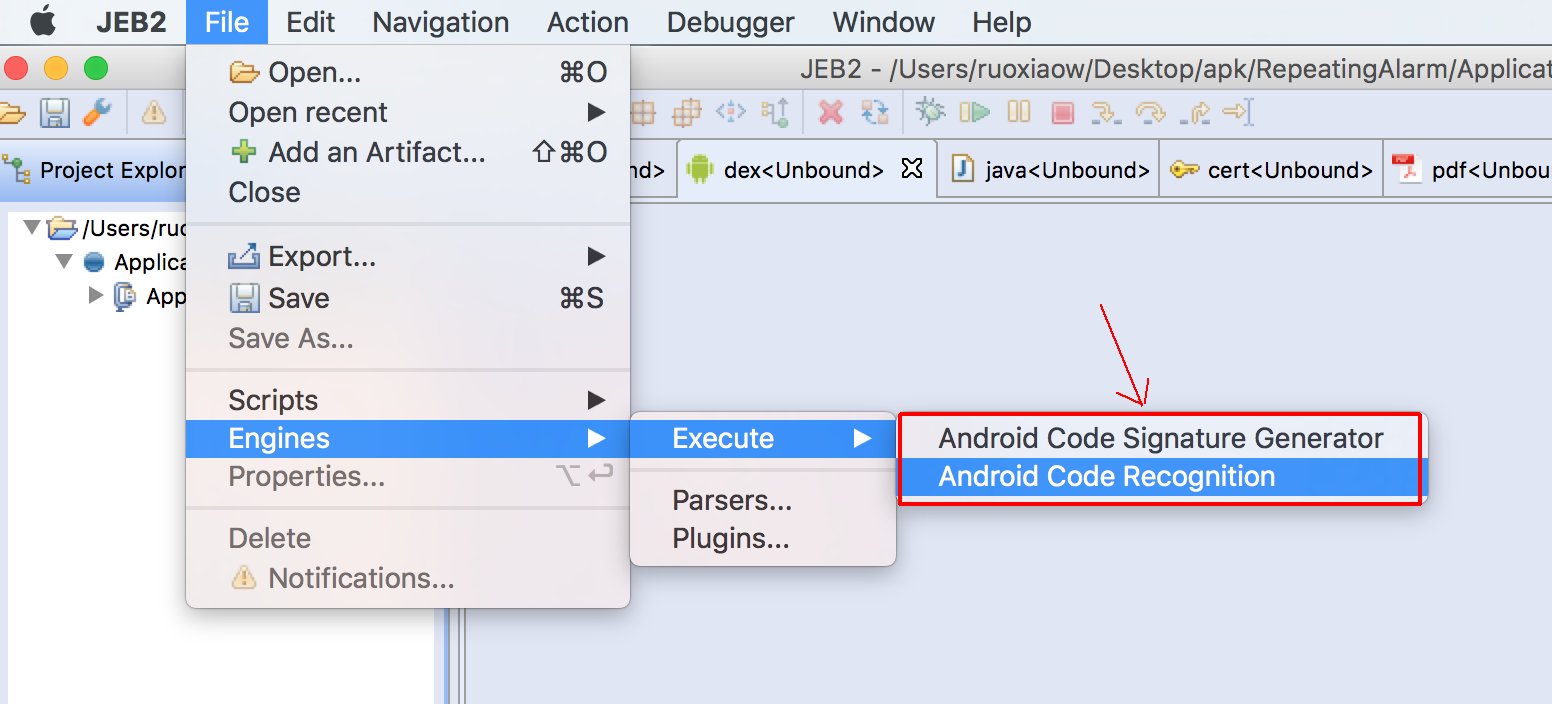
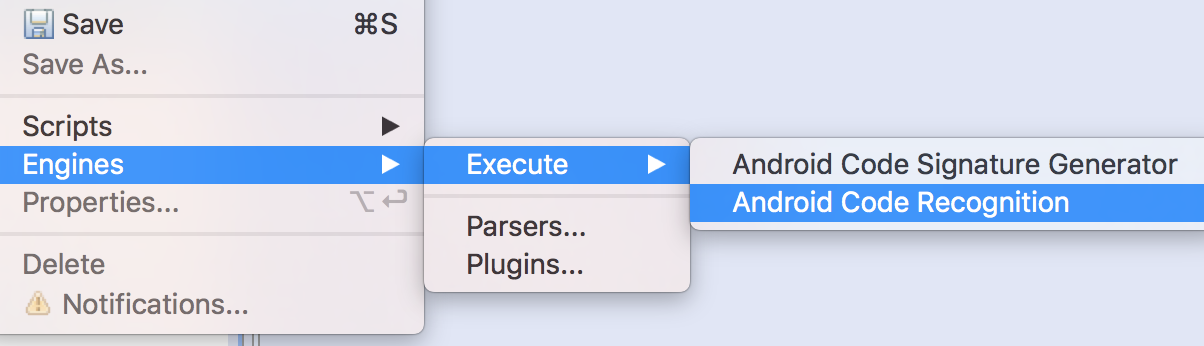
Let’s see why by looking at which siglibs (signature libraries) were applied during the initial analysis (menu: Native, Signature Libraries…). It looks like none were loaded:
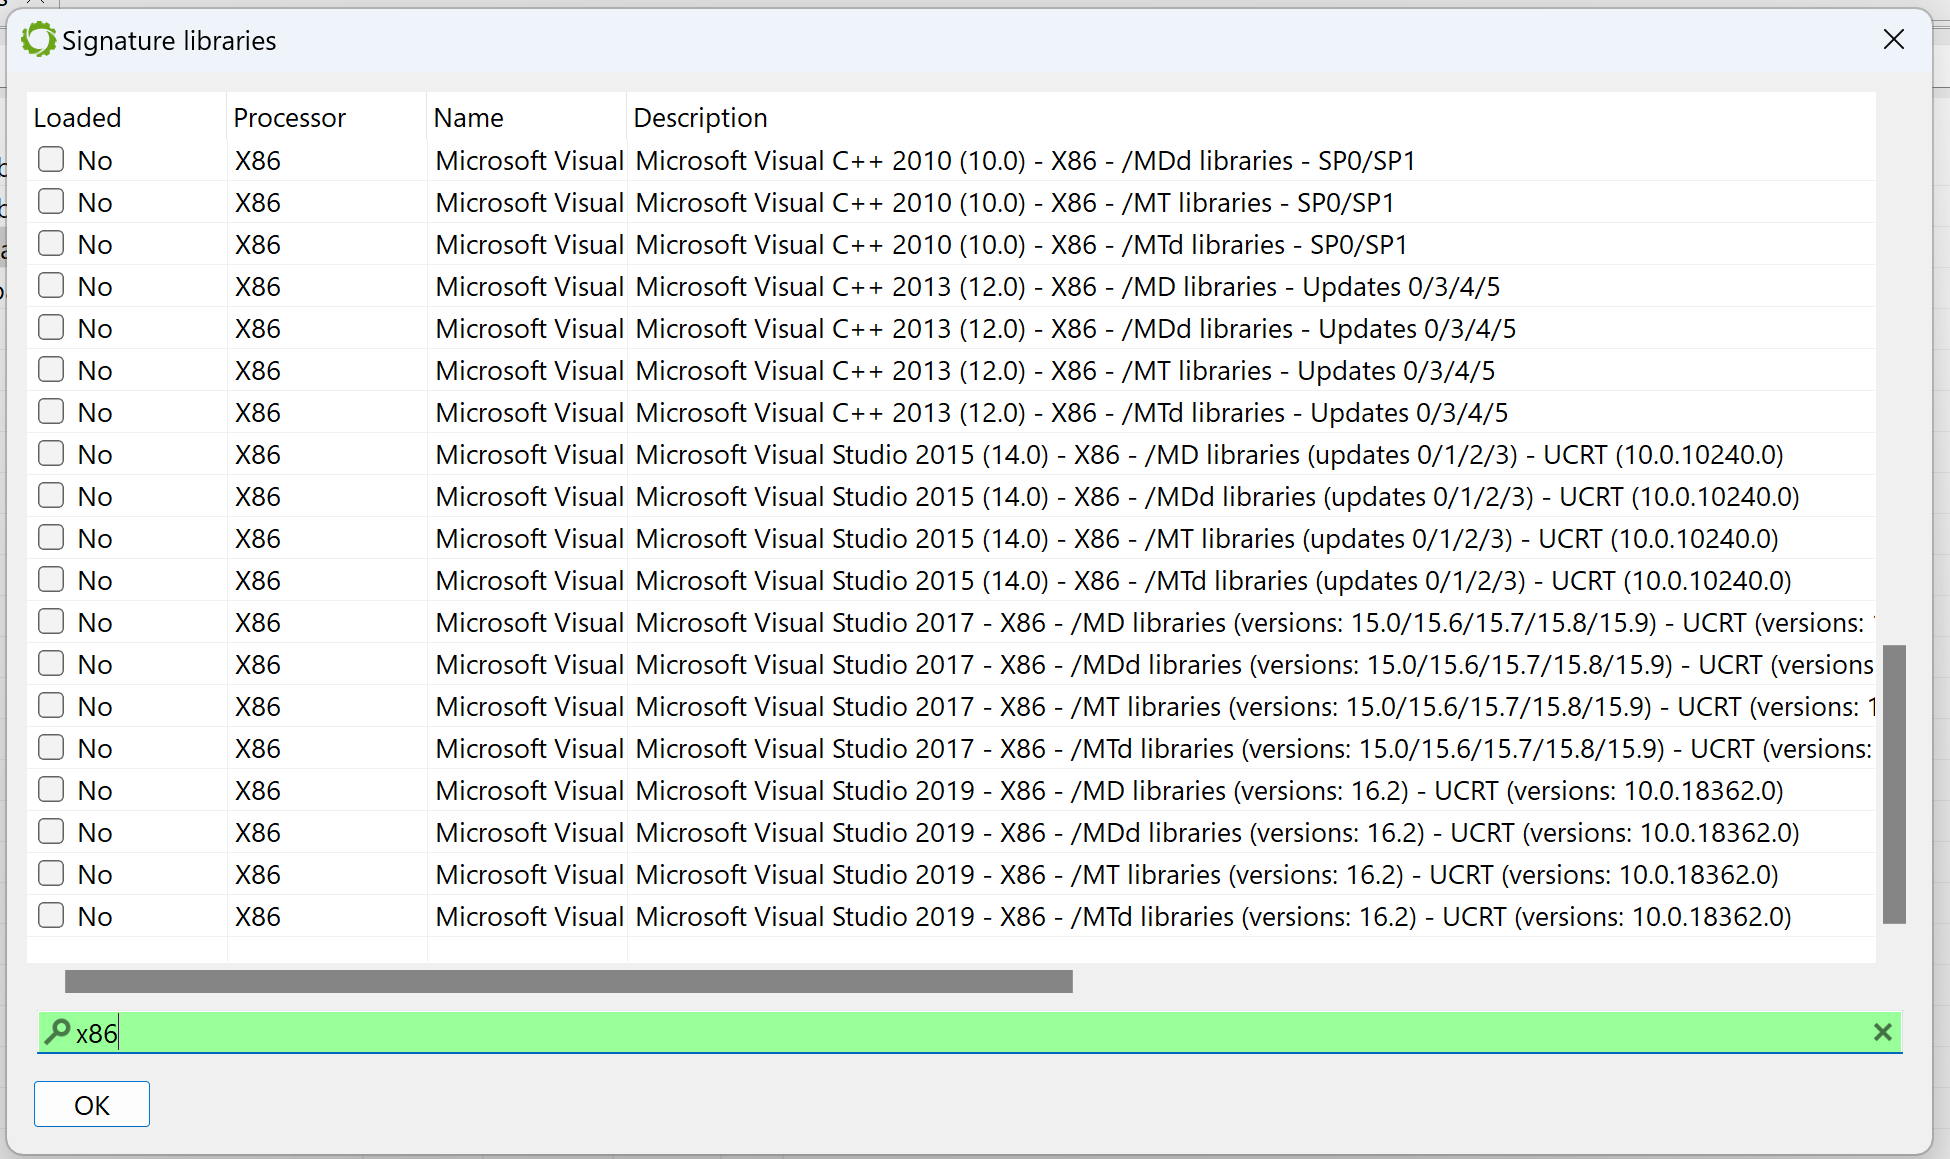
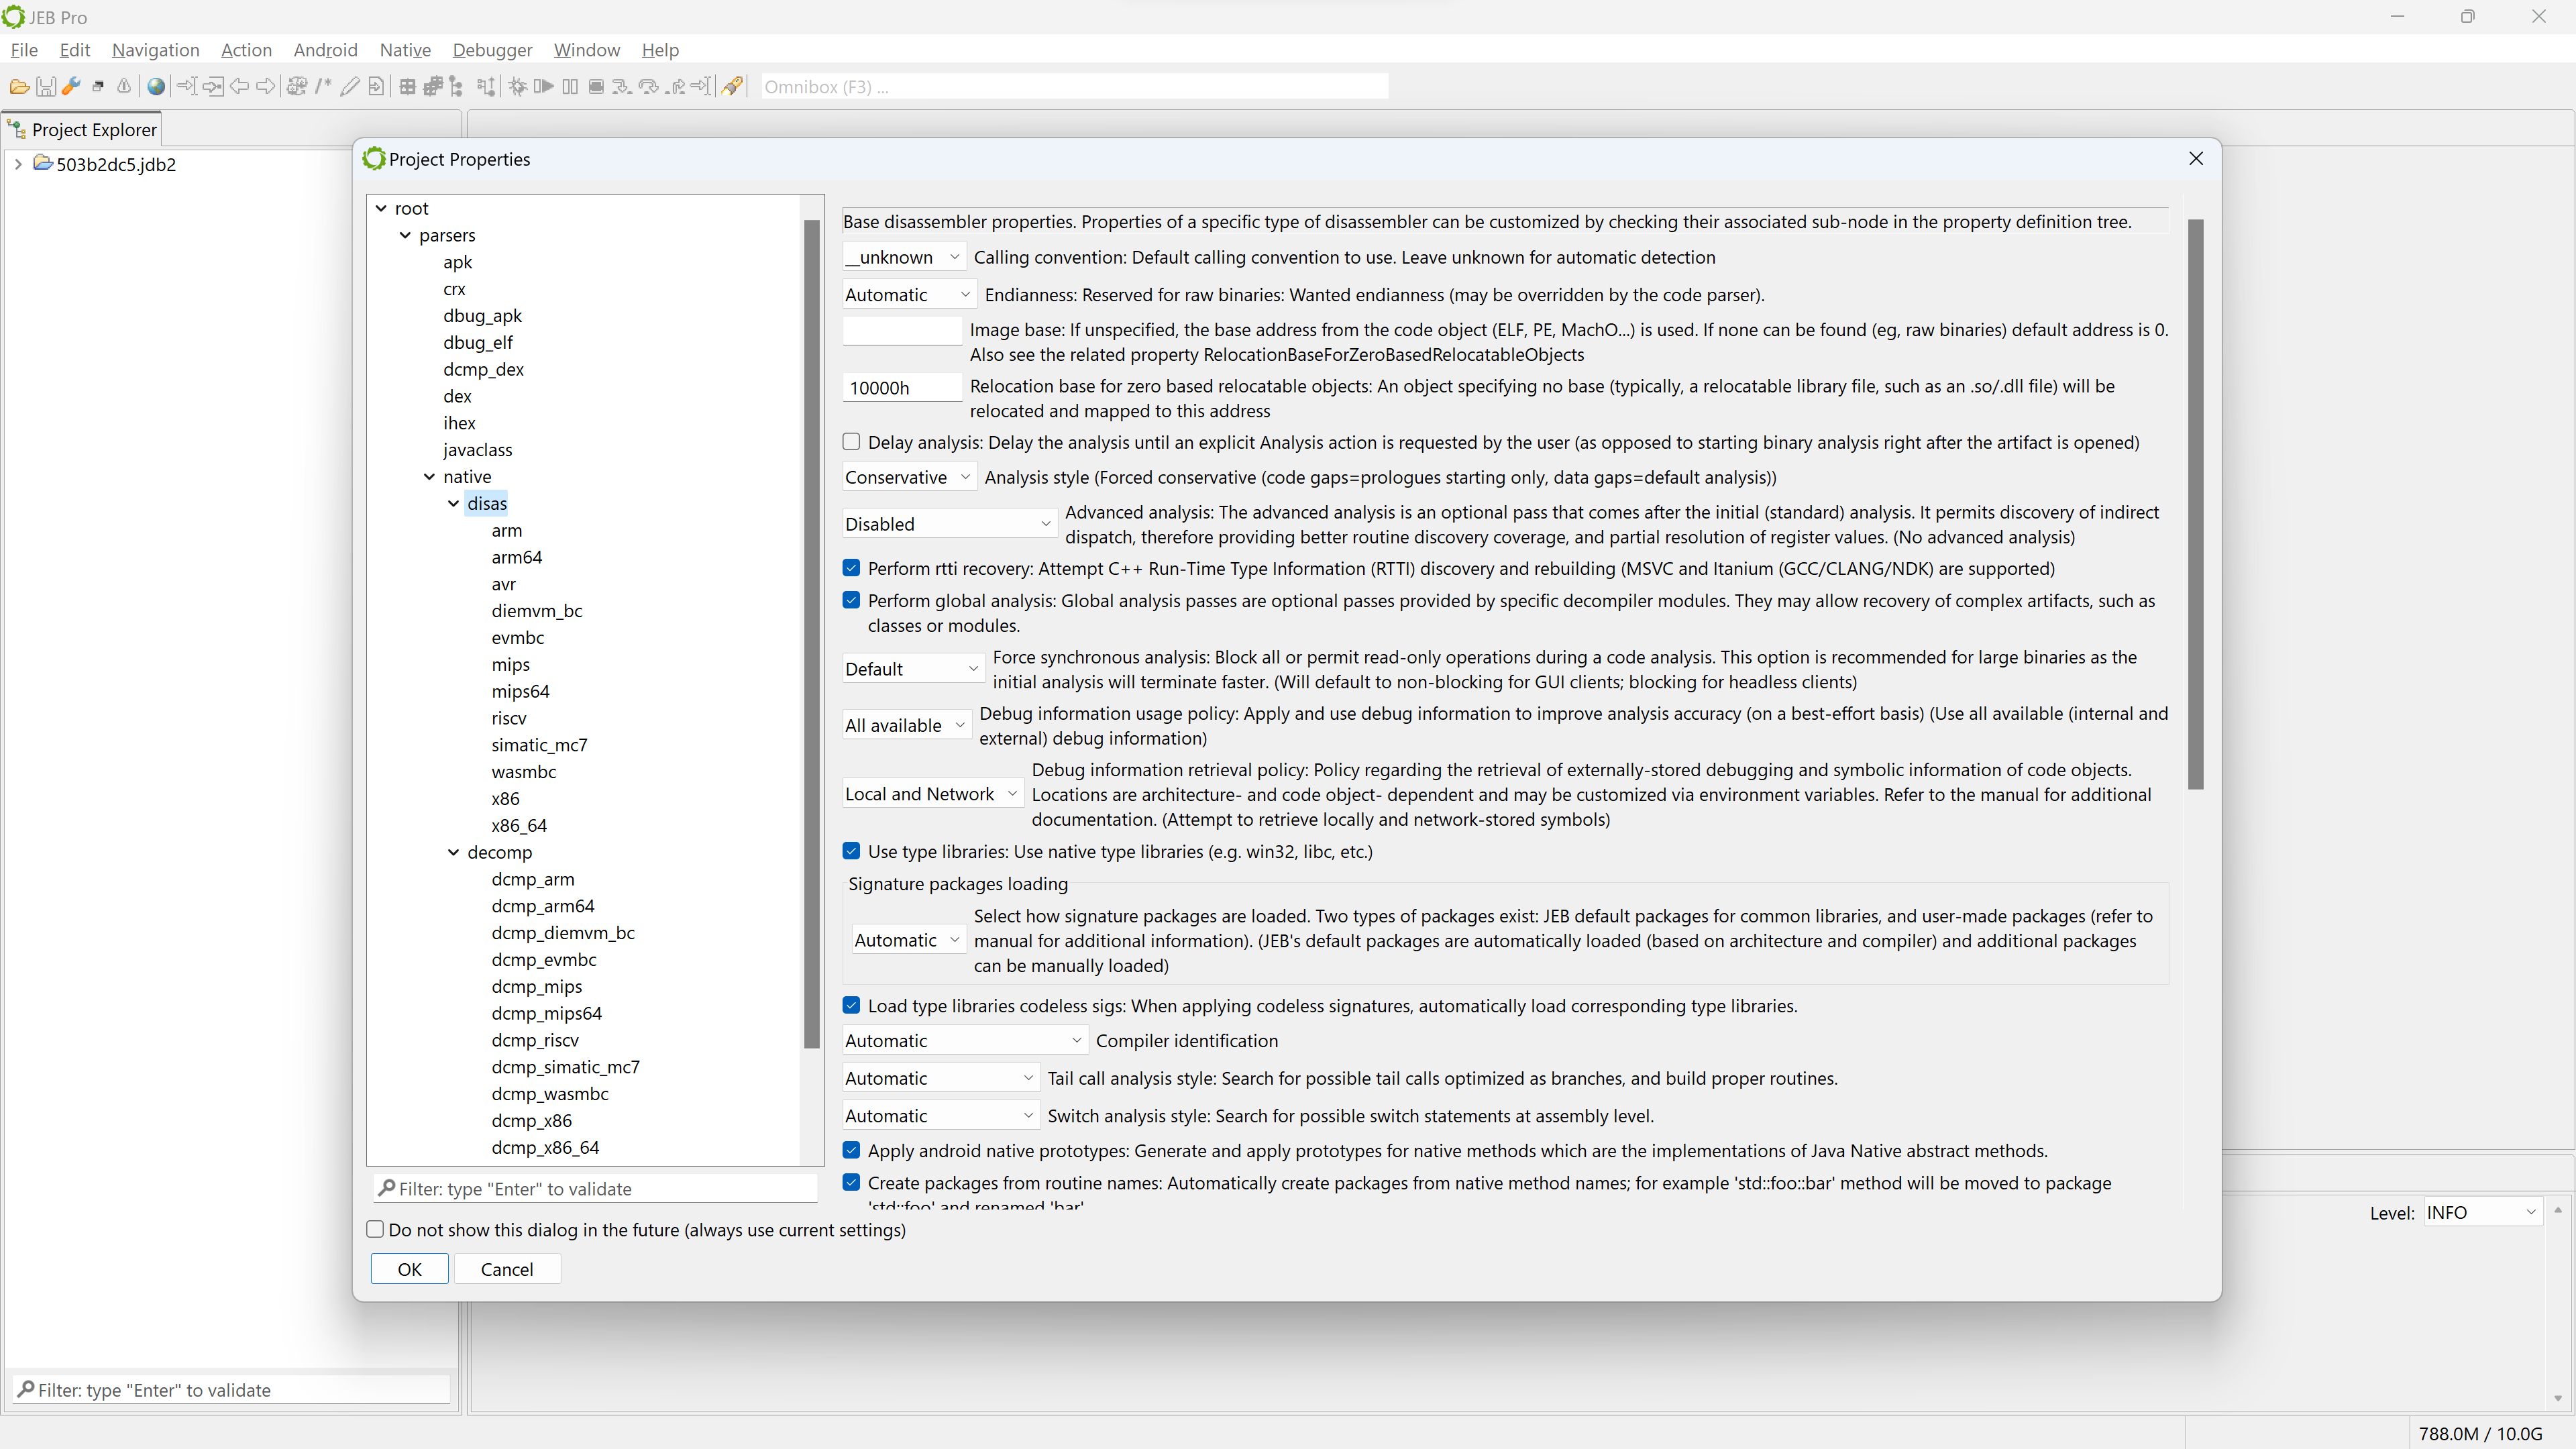
Library code identification
Normally, when JEB performs the initial auto-analysis of the code, compiler identification is used to determine whether well-known signature libraries of static code (siglibs) should be loaded and applied to the binary. In this case, compiler identification failed because all header data had been discarded. JEB decided to not load and apply signatures.
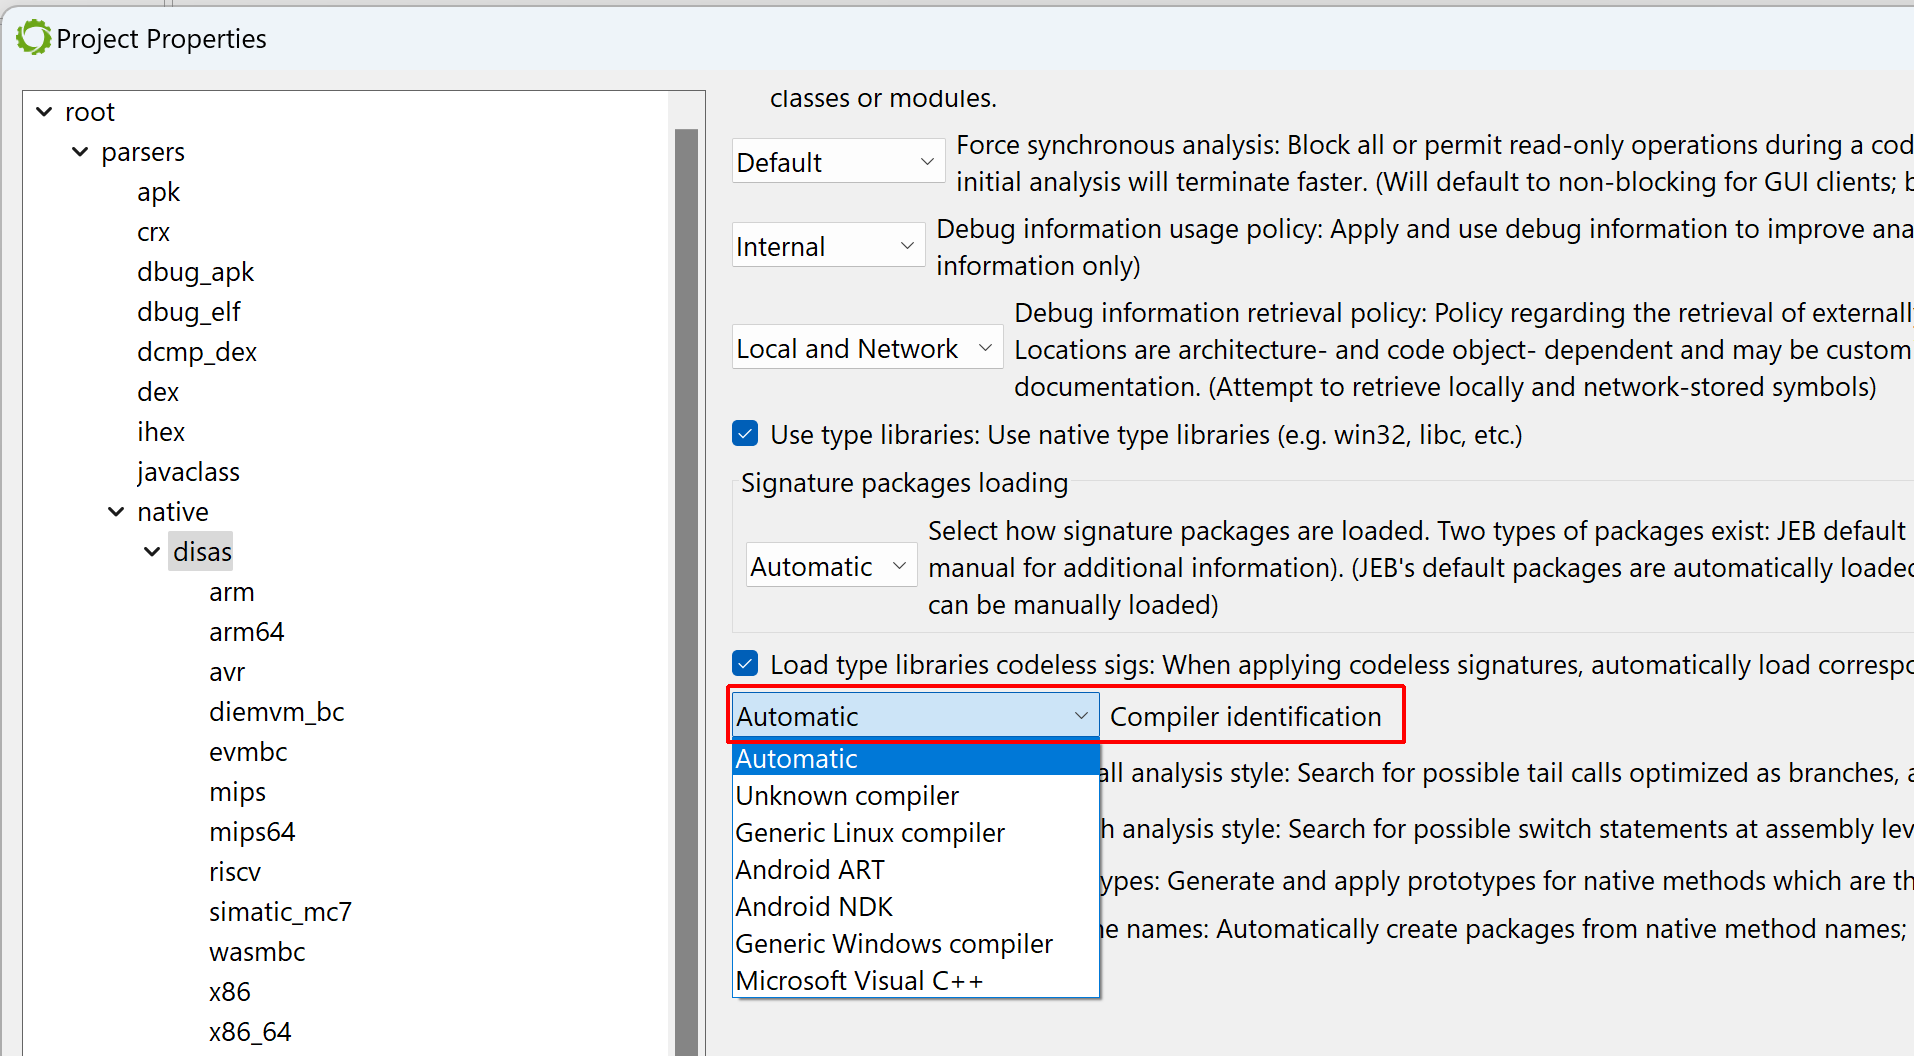
To apply them manually, tick the “MSVC x86” boxes. (An alternative is to let JEB know that the file was compiled with MSVC before the analysis starts: when opening the artifact, when the Options panel is displayed, the user may decide to force the compiler to a set-value.)
After doing either of the above ((a) file re-analysis with a compiler identification pre-set; or (b) manual siglibs application), several methods are identified as MSVC code:
Entry-point and WinMain
Navigate to the executable entry-point (menu: Native, Go to entry-point…).
In the general case, the entry-point of a Windows PE compiled with MSVC is not the high-level entry-point that will contain meaningful code. Although it is relatively easy to find WinMain with a bit of experience, there is a JEB script to help you as well, FindMain.py (available in the samples-script folder, also available on GitHub). Open up the script selector with F2 (menu: File, Scripts, Script selector…).
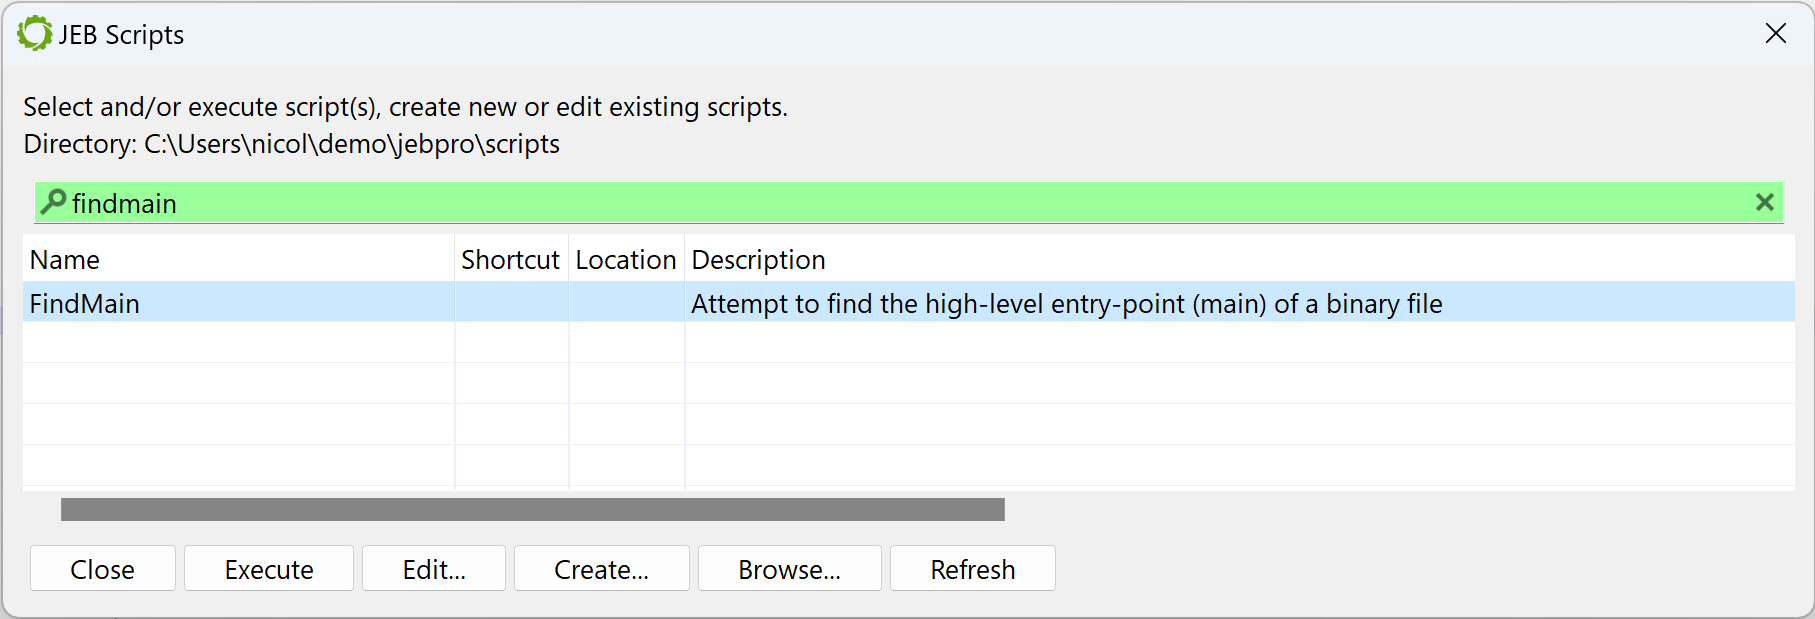
Select the desired script and execute it. The result is displayed in the console:
...
Found high-level entry-point at 0x401175 (branched from 0x401D38)
Renaming entry-point to 'winmain'
...
The code at 0x401175 was auto-renamed to winmain (menu: Action, Rename…).
Initial decompilation
Let’s decompile that method by pressing the TAB key (menu: Action, Decompile…).
Two items of interest to note at this point:
- There is lots of code that appears to be junk or garbage
- There is a note about some “deobfuscation score”
Junk code
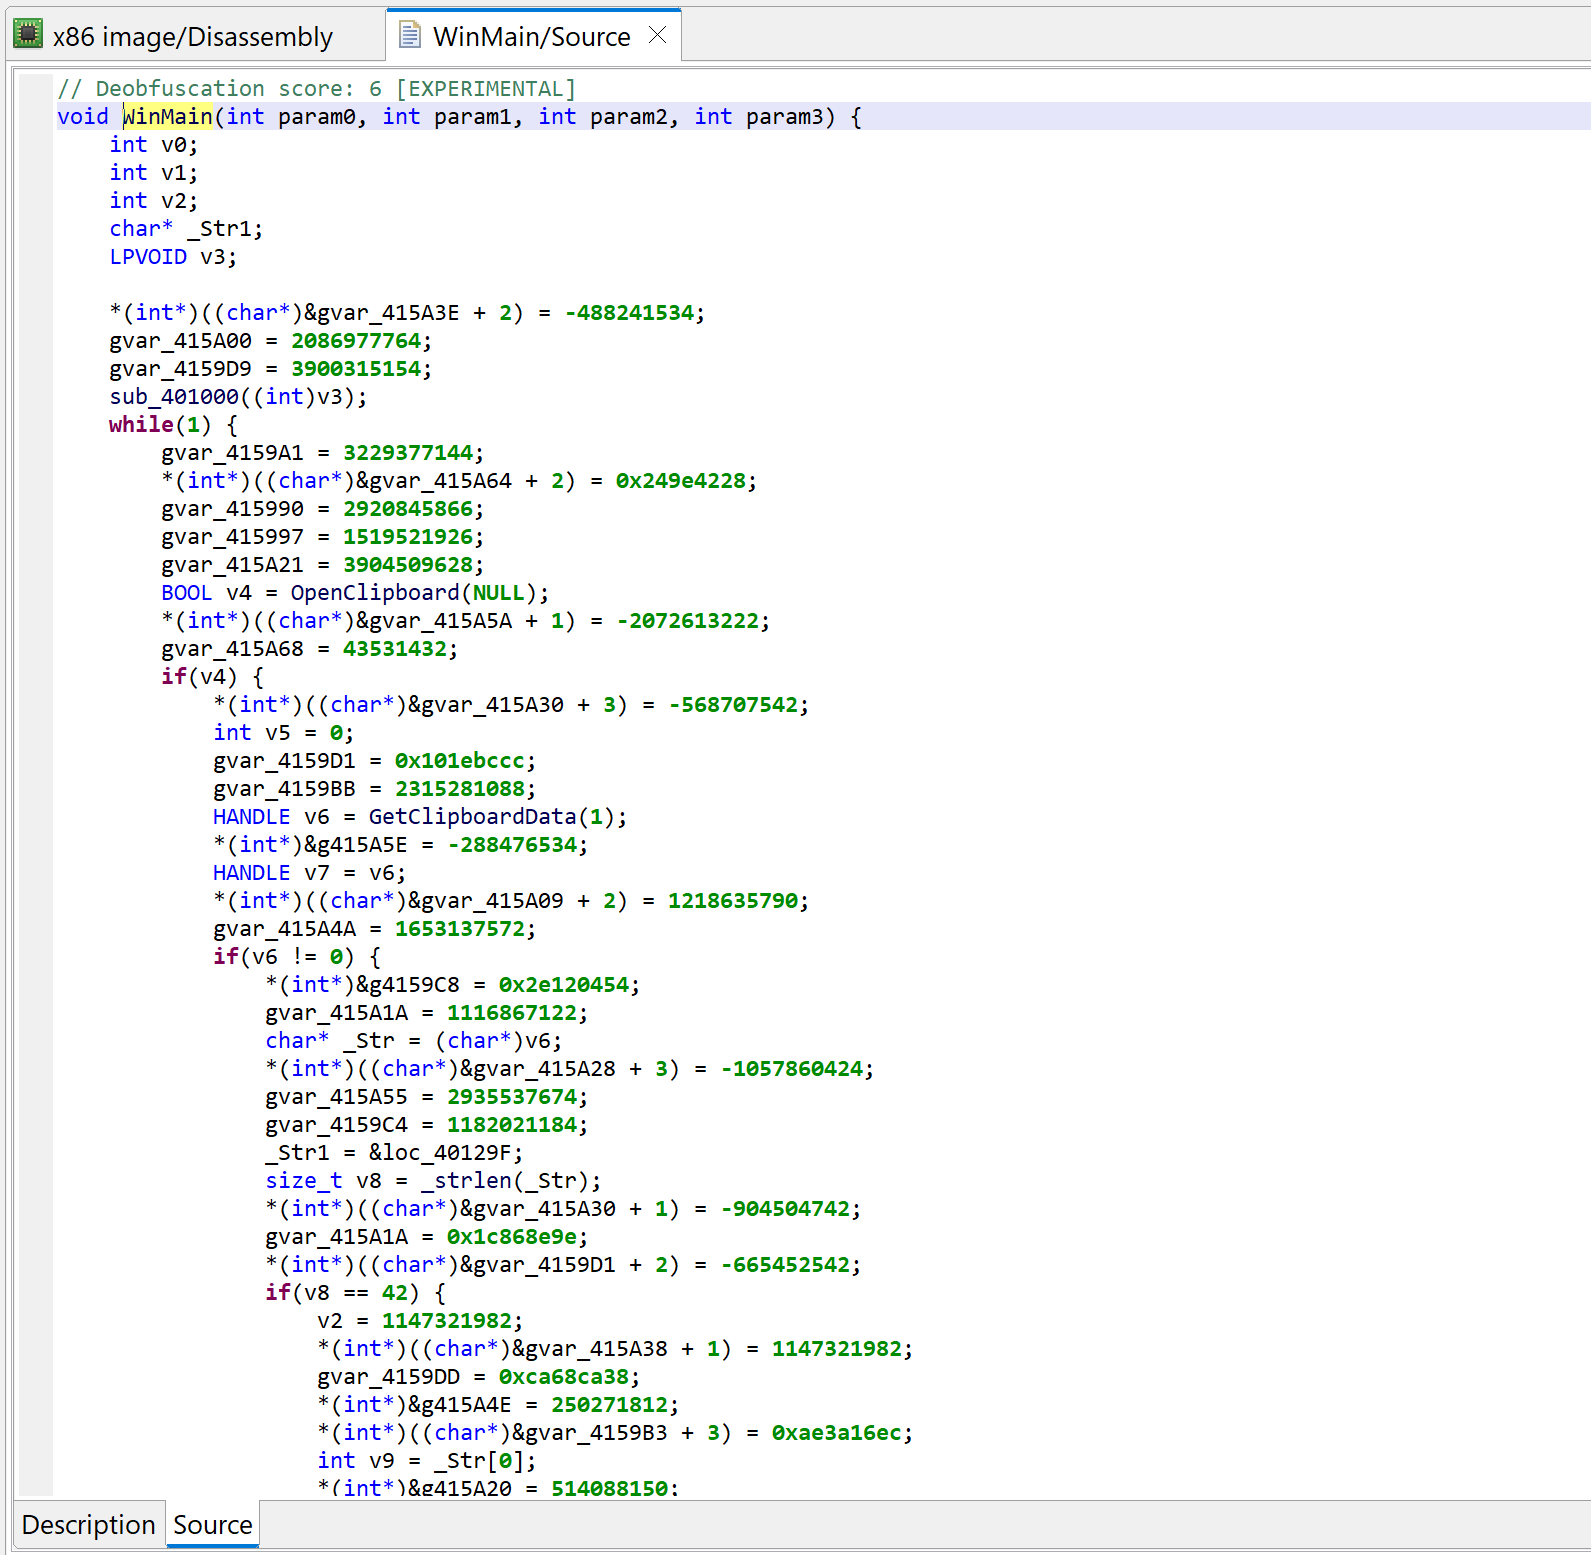
The decompiled WinMain method is about 300 lines of C code. A lot of it are assignments writing to program globals. At first glance, it looks like it could be some sort of obfuscation. Let’s look at the corresponding assembly code:
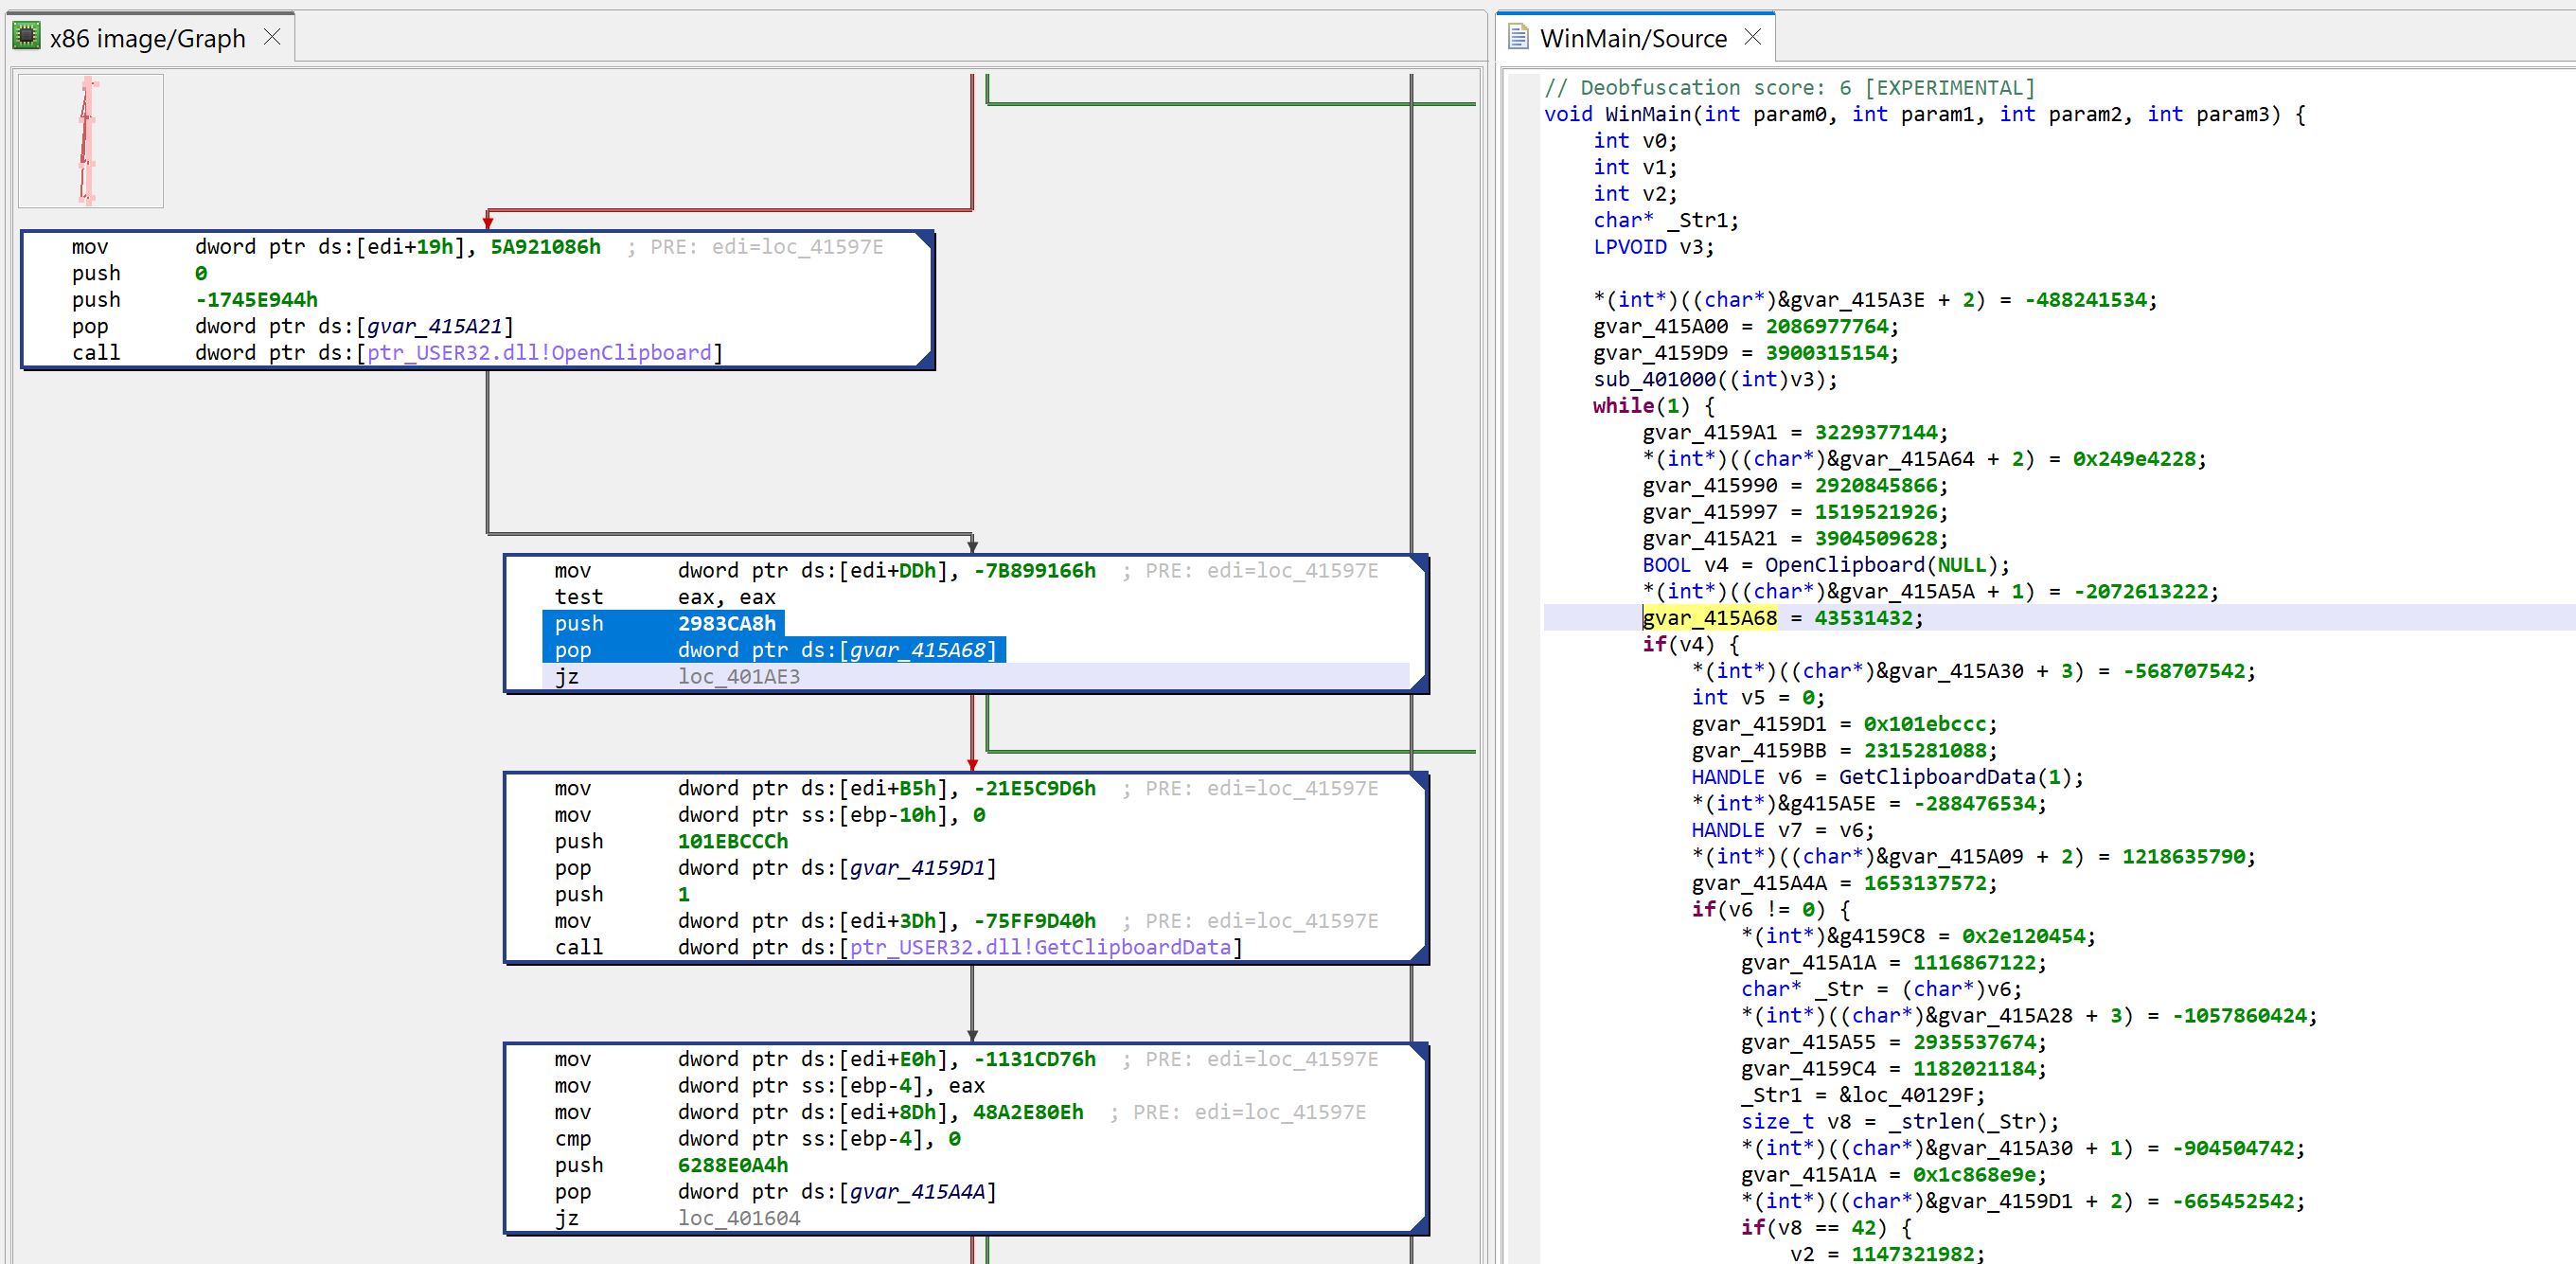
The snippets have the following structure:push GARBAGE / pop dword [gXXX]
Or that, assuming edi is callee-saved:mov edi, gXXX / ... / mov dword [edi+offset], GARBABE
Later on, we will see how to remove this clutter to make the analysis more pleasant.
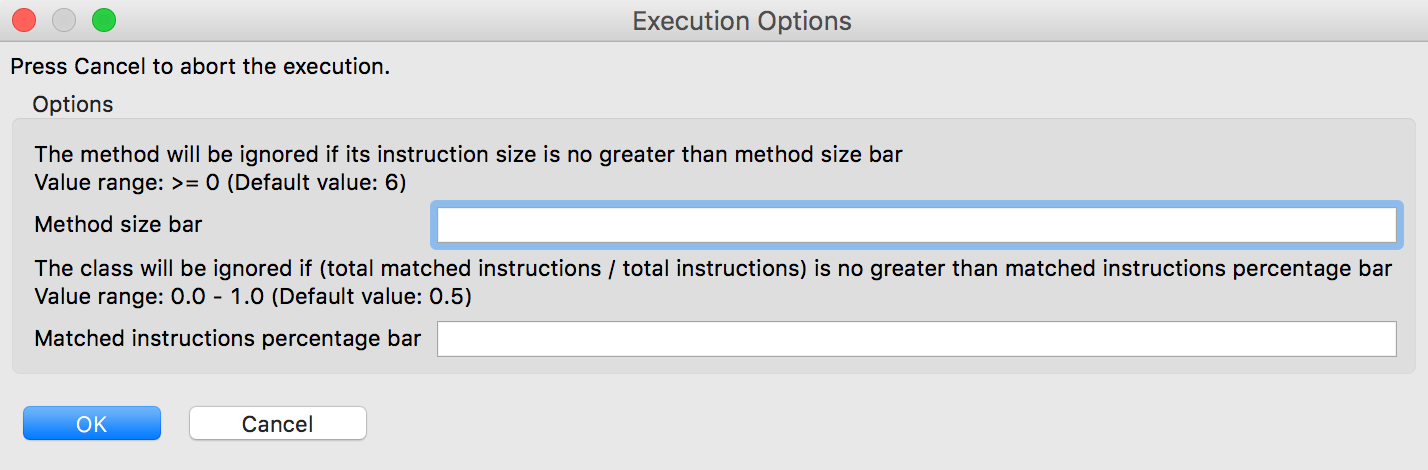
Deobfuscation score
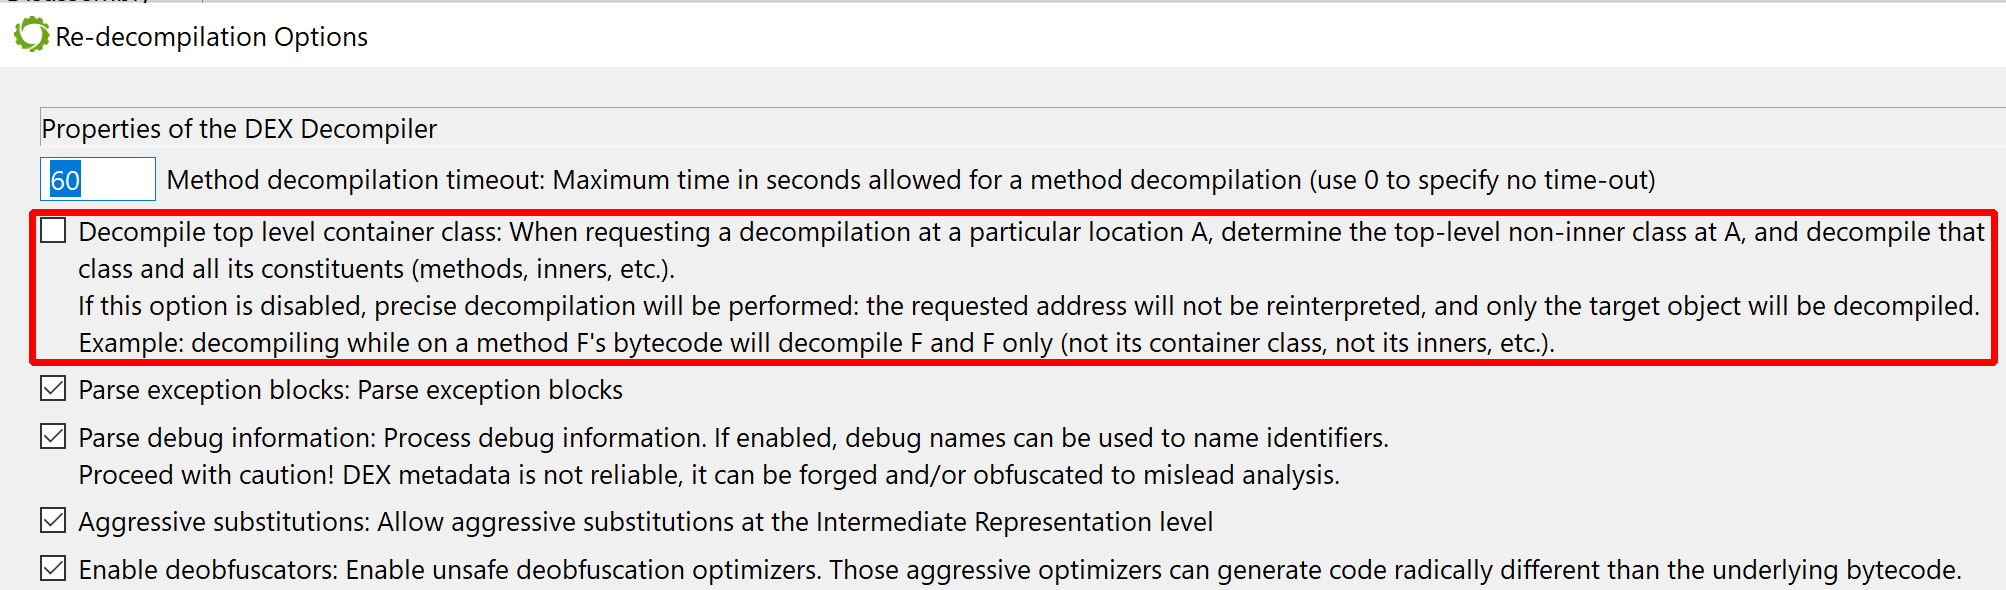
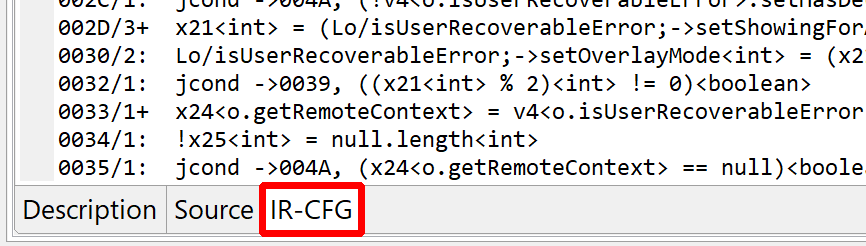
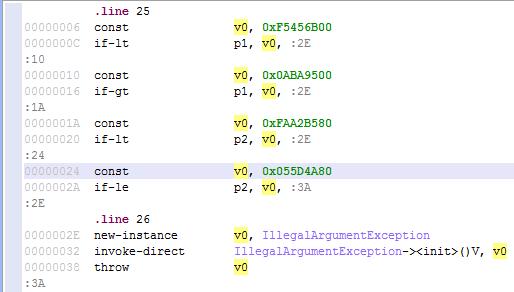
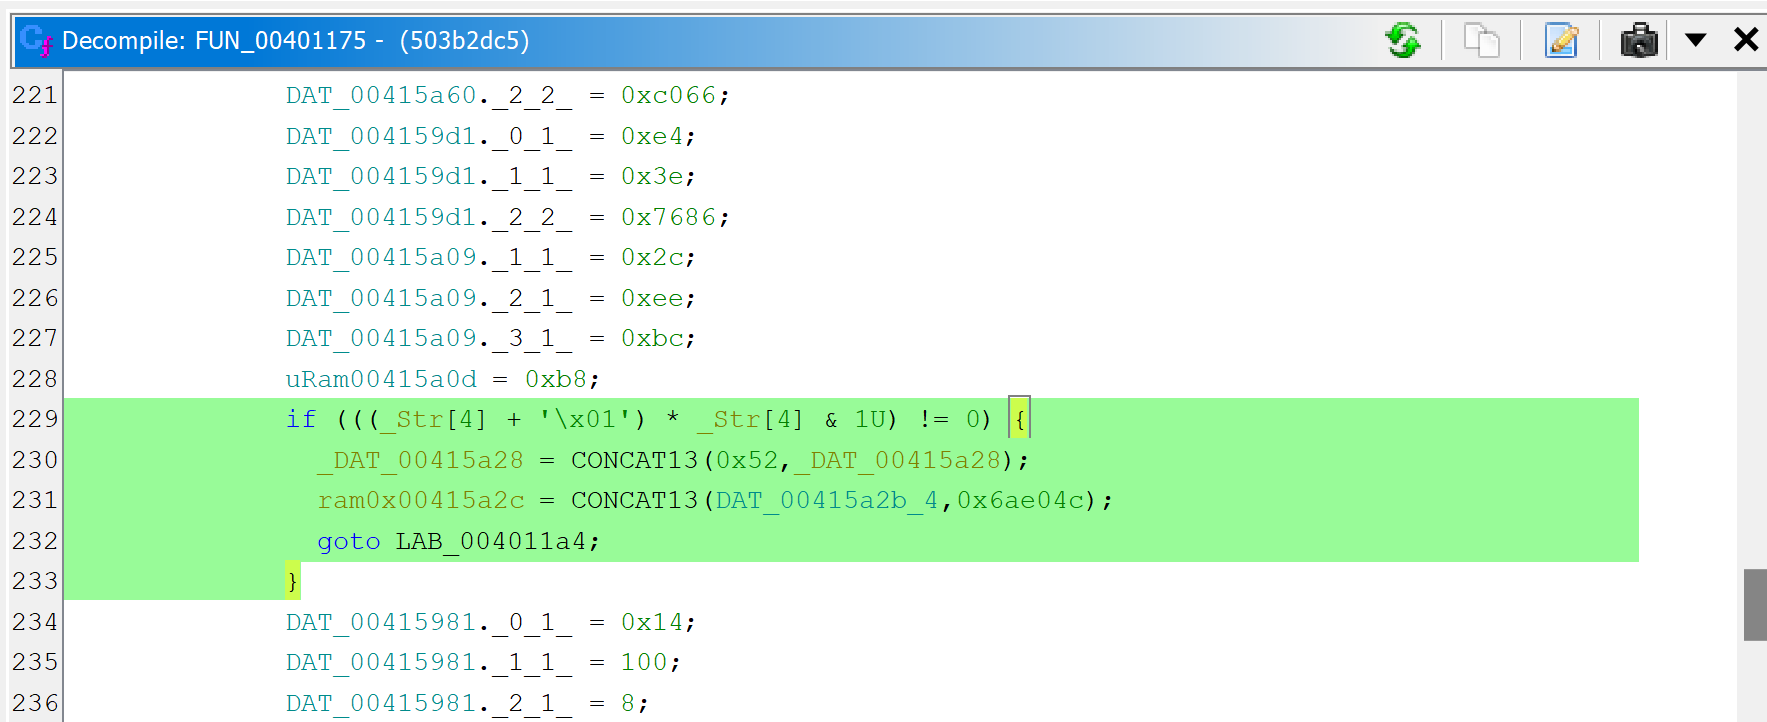
A note “deobfuscation score: 6” was inserted as a method comment. That score indicates that some “advanced” clean-up was performed. In this case, a careful examination (as well as a comparison against a decompilation with UNSAFE optimizers turned off, which you can do by redecompiling the method with CTRL+TAB (menu: Action, Decompile with Options…)) will point to this area of code:
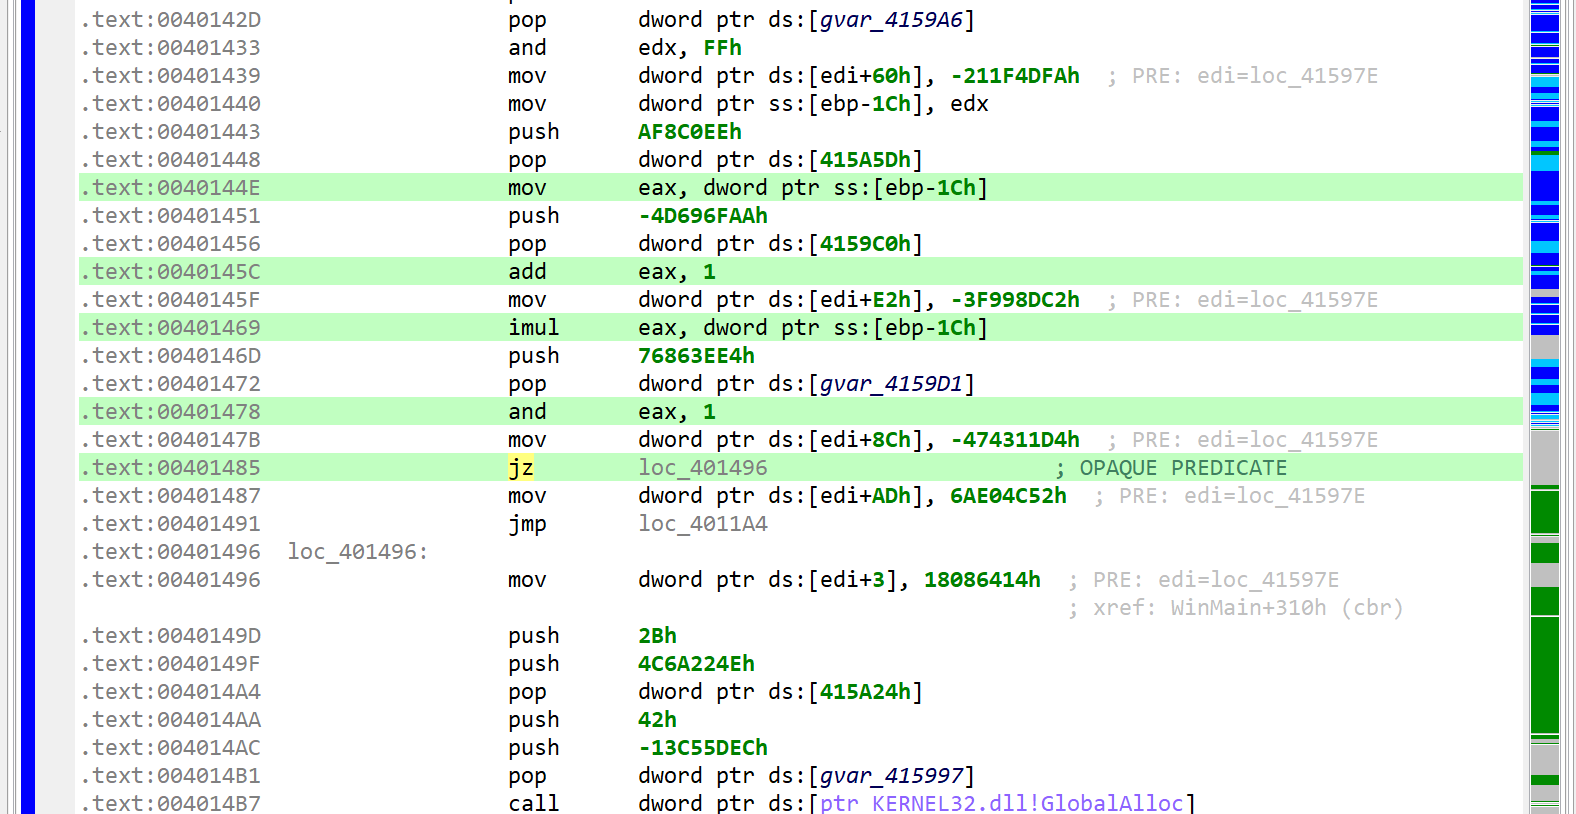
This predicate looks like the following: if(X*(X+1) % 2 == 0) goto LABEL.
With X being an integer, X*(X+1) is always even. Therefore, the predicate will always evaluate to true. JEB cleaned this up automatically. (While this particular predicate is trivial, truly opaque predicates will also be attempted to be broken up by JEB, using the Z3 SMT solver.)
Comparison with GHIDRA
For a point of comparison, you may have a look at the same method decompiled by GHIDRA 10.4 here (default settings were used, just like we did with JEB). The predicate is not cleaned-up adequately, extra control-flow edges are left over, leading to AST structuring confusion.
Cleaning up the code
Let’s start with decluttering this code. First of all, why couldn’t the decompiler clean it up on its own? If the globals written to are never read with meaningful intent, then they could be discarded.
The issue is that this is very hard to ensure in the general case. However, in specific cases, sometimes involving manual review, some global written-to memory range may be deemed useless, as it is the case here. How do we provide this information to the decompiler? Well, as of version 5.7, we cannot! 1 What we can do though is write a decompiler plugin to clean-up the offending IR, and in the process, generate clean(er) code.
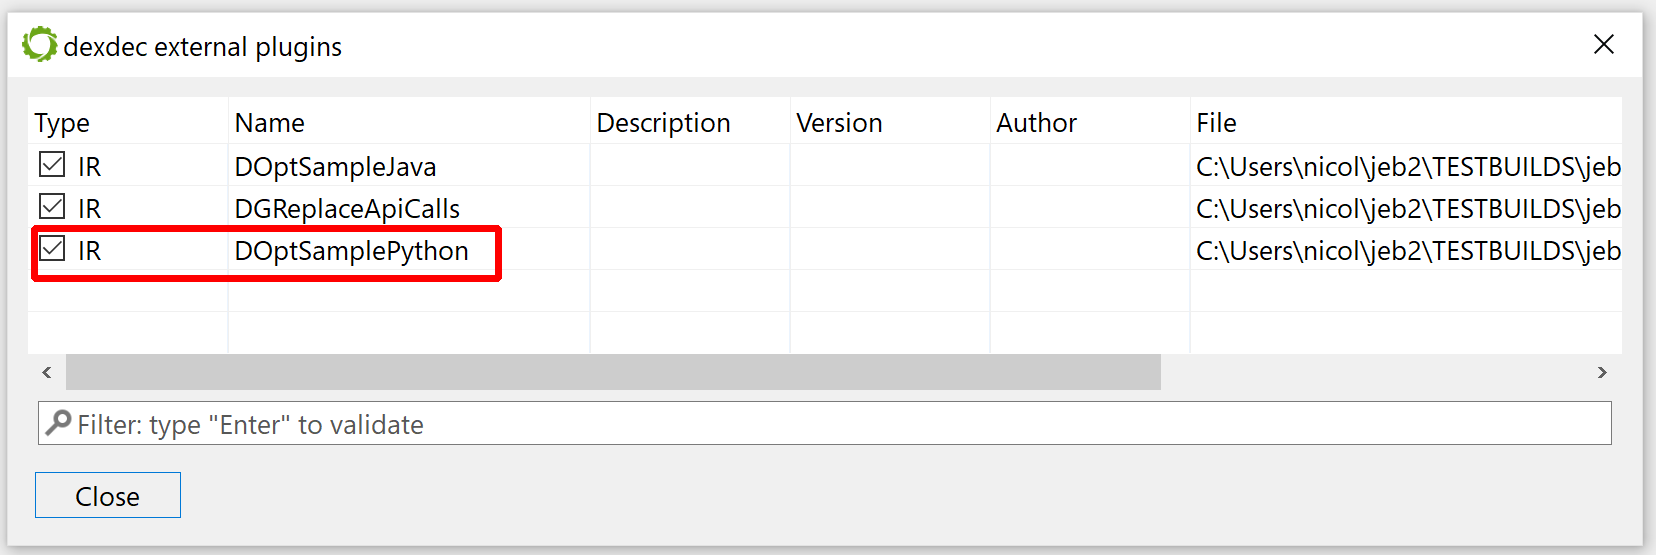
IR cleaner plugin
The decompiler accept several types of plugins, including IR Optimizers (they work on the Intermediate Representation of a routine, as it moves up the decompilation pipeline), and AST optimizers (to clean-up or reformat the generated abstract syntax tree of the pseudo-code). In most cases, IR optimizers are well-suited to perform code clean-up or deobfuscation tasks (refer to this blog post for a detailed comparison).
We will write the plugin in Java (we could also write it in Python). It will do the following:
- Examine each IR statement of a CFG
- Check if the statement is writing an immediate to some global array:
*(array + offset) = value - If so, check the array name. If it starts with the prefix “garbage”, consider the statement useless and replace it by a Nop statement
Writing IR plugins is out-of-scope in this post; we will go over that in details in a future entry. In the meantime, you can download the plugin code here. Dump the Java file in your JEB’s coreplugins/scripts/ folder. There is no need to close and re-open JEB; it will be picked up at the next decompilation.
public class GarbageCleaner extends AbstractEOptimizer {

	@Override
	public int perform() {
		int cnt = 0;

		for (BasicBlock<IEStatement> b : cfg) {
			for (int i = 0; i < b.size(); i++) {
				IEStatement stm = b.get(i);
				if (stm instanceof IEAssign && stm.asAssign().getDstOperand() instanceof IEMem
						&& stm.asAssign().getSrcOperand() instanceof IEImm) {
					IEMem dst = stm.asAssign().getDstOperand().asMem();
					IEGeneric e = dst.getReference();
					// [xxx + offset] = immediate
					if (e.isOperation(OperationType.ADD)) {
						IEOperation op = e.asOperation();
						if (op.getOperand1().isVar() && op.getOperand2().isImm()) {
							IEVar v = op.getOperand1().asVar();
							IEImm off = op.getOperand2().asImm();
							if (v.isGlobalReference()) {
								long addr = v.getAddress();
								INativeContinuousItem item = ectx.getNativeContext().getNativeItemAt(addr);
								// logger.info("FOUND ITEM %s", item.getName());
								if (item != null && item.getName().startsWith("garbage")) {
									long itemsize = item.getMemorySize();
									if (off.canReadAsLong() && off.getValueAsLong() + dst.getBitsize() / 8 < itemsize) {
										logger.info("FOUND GARBAGE CODE");
										b.set(i, ectx.createNop(stm));
										cnt++;
									}
								}
							}
						}
					}
				}
			}
		}

		if (cnt > 0) {
			cfg.invalidateDataFlowAnalysis();
		}
		return cnt;
	}
}
Note that by design, the plugin is not specific to this malware. We will be able to re-use it in future analyses: all global arrays prefixed with “garbage” will be treated by the decompiler as junk recipients, and cleaned-up accordingly!
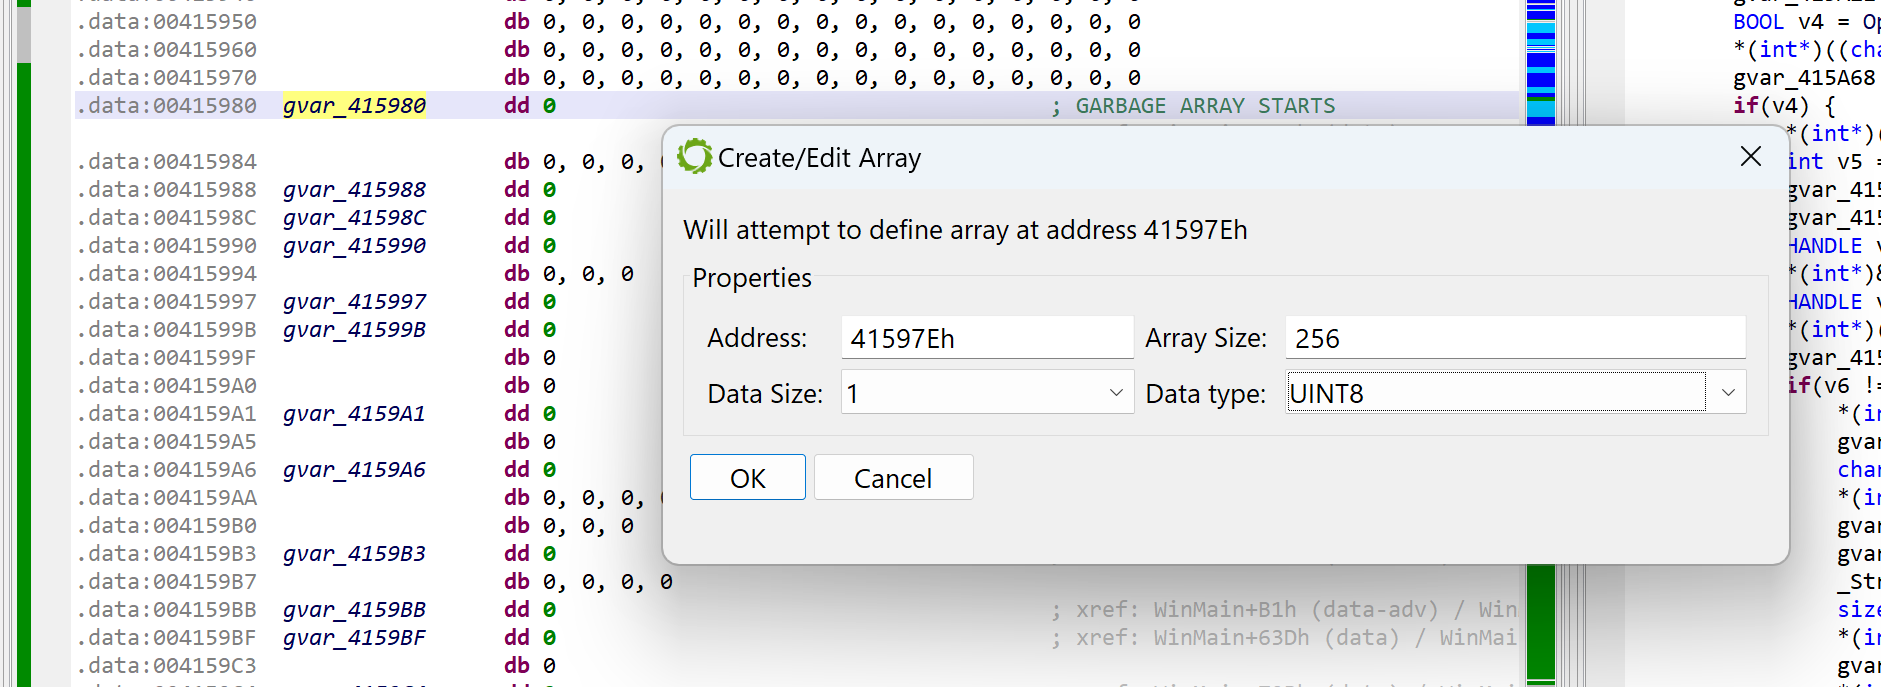
Defining the garbage array
At this point, we need to determine where that array is. Some examination of the code leads to the following boundaries (roughly): start at 0x41597E, spans over 0x100 bytes. Navigate to the disassembly; create an array using the STAR key (menu: Native, Create/Edit Array…); specify its characteristics.
As soon as the array is created, the disassembly will change to what can be seen below. At the same time, the decompilations using that array will be invalidated; that is the case for WinMain. You may see that another extra-comment was added by the decompiler: “Stale decompilation – Refresh this view to re-decompile this code”. Such decompilations are read-only until a new one is generated.
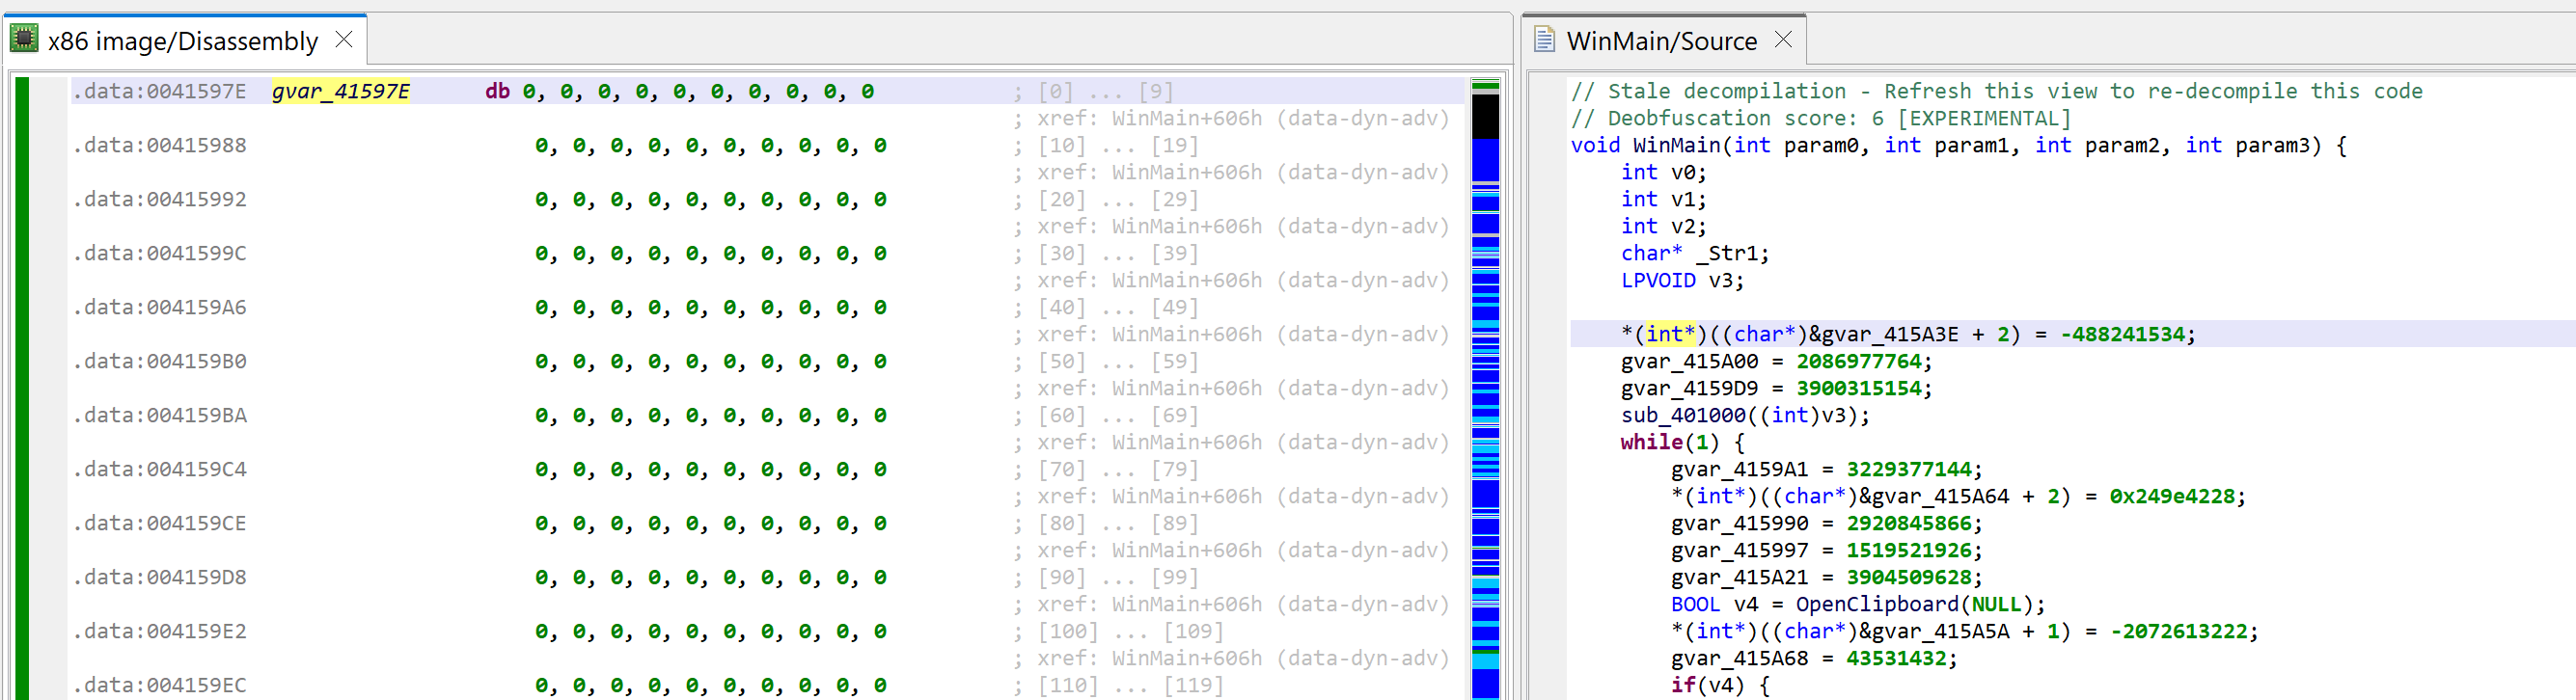
Before redecompiling, remember we need to rename our array with a label starting with “garbage”. Set the caret on the array, hit the key N (menu: Actions, Rename…) and set your new name, e.g., garbageArray1.
Now you may go back to the decompilation view of WinMain and hit F5 (menu: Windows, Refresh…) to regenerate a decompilation.
The code above is much nicer to look at – and much easier to work on!
Quick analysis
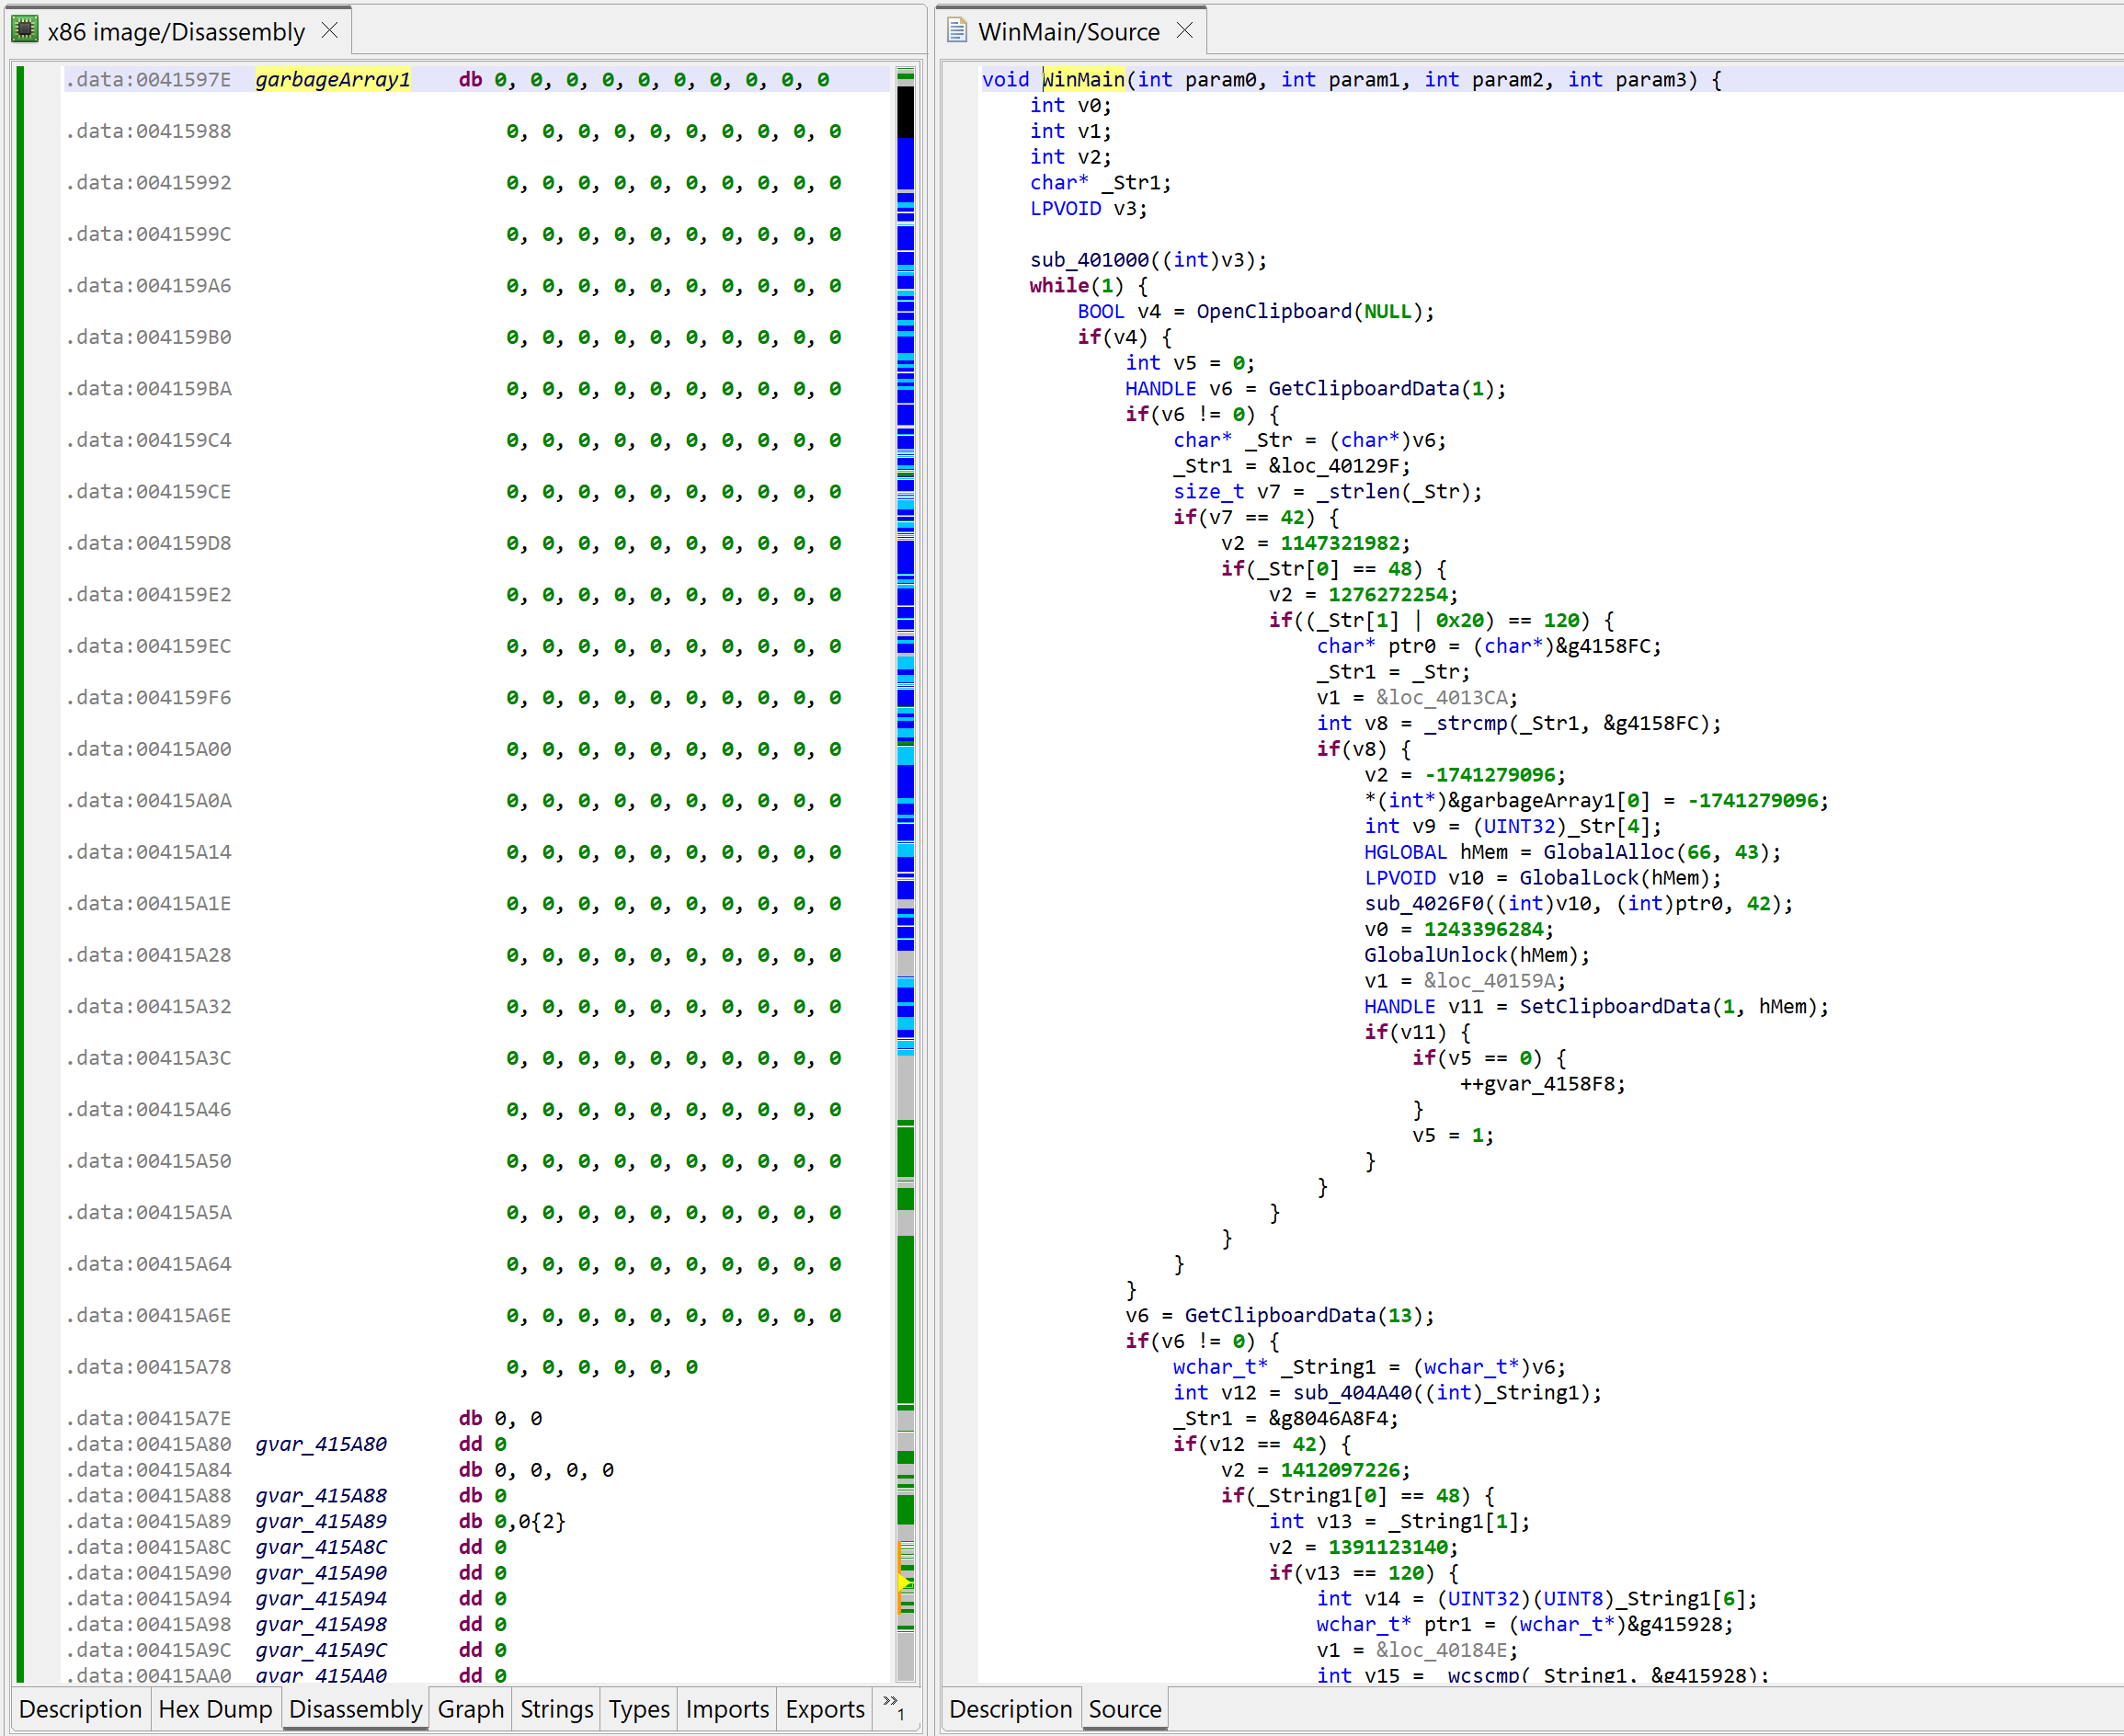
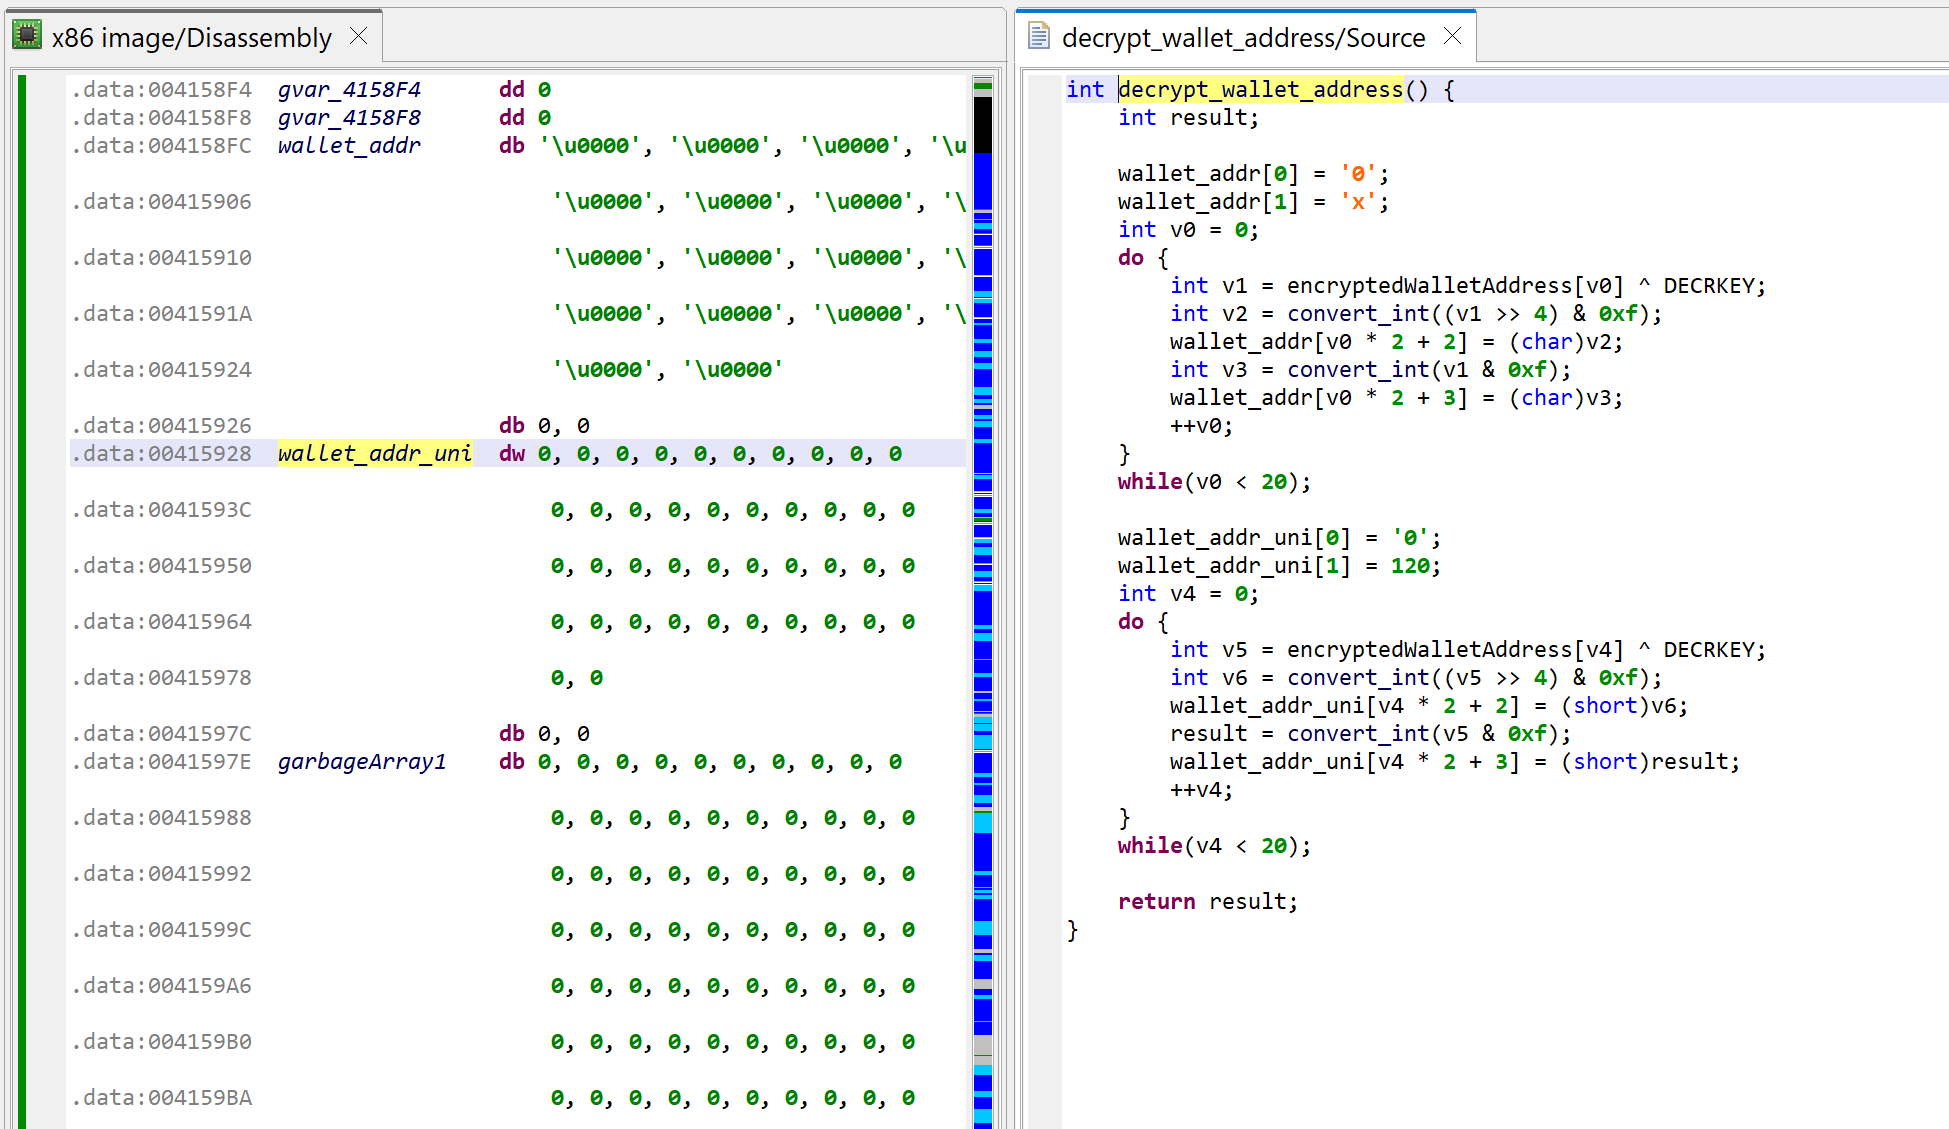
The method at 0x401000, called by WinMain, is decrypting the thief’s wallet address, and generating two hexstring versions of it (ascii and unicode).
The loop in WinMain is doing the following:
- Every second, it queries the Windows clipboard with
OpenClipboard - It checks if it contains text strings or unicode strings
- If the string is 42 characters in length and starts with “0x”, it proceeds (an Ethereum wallet address is 20 bytes, therefore its hexadecimal representation would be 40 characters)
- It checks if the string is not the attacker’s wallet address
- If not, it replaces the contents of the clipboard data by the attacker’s wallet address using
SetClipboardData - Finally, the other contents found in the clipboard is discarded
Well-known literals
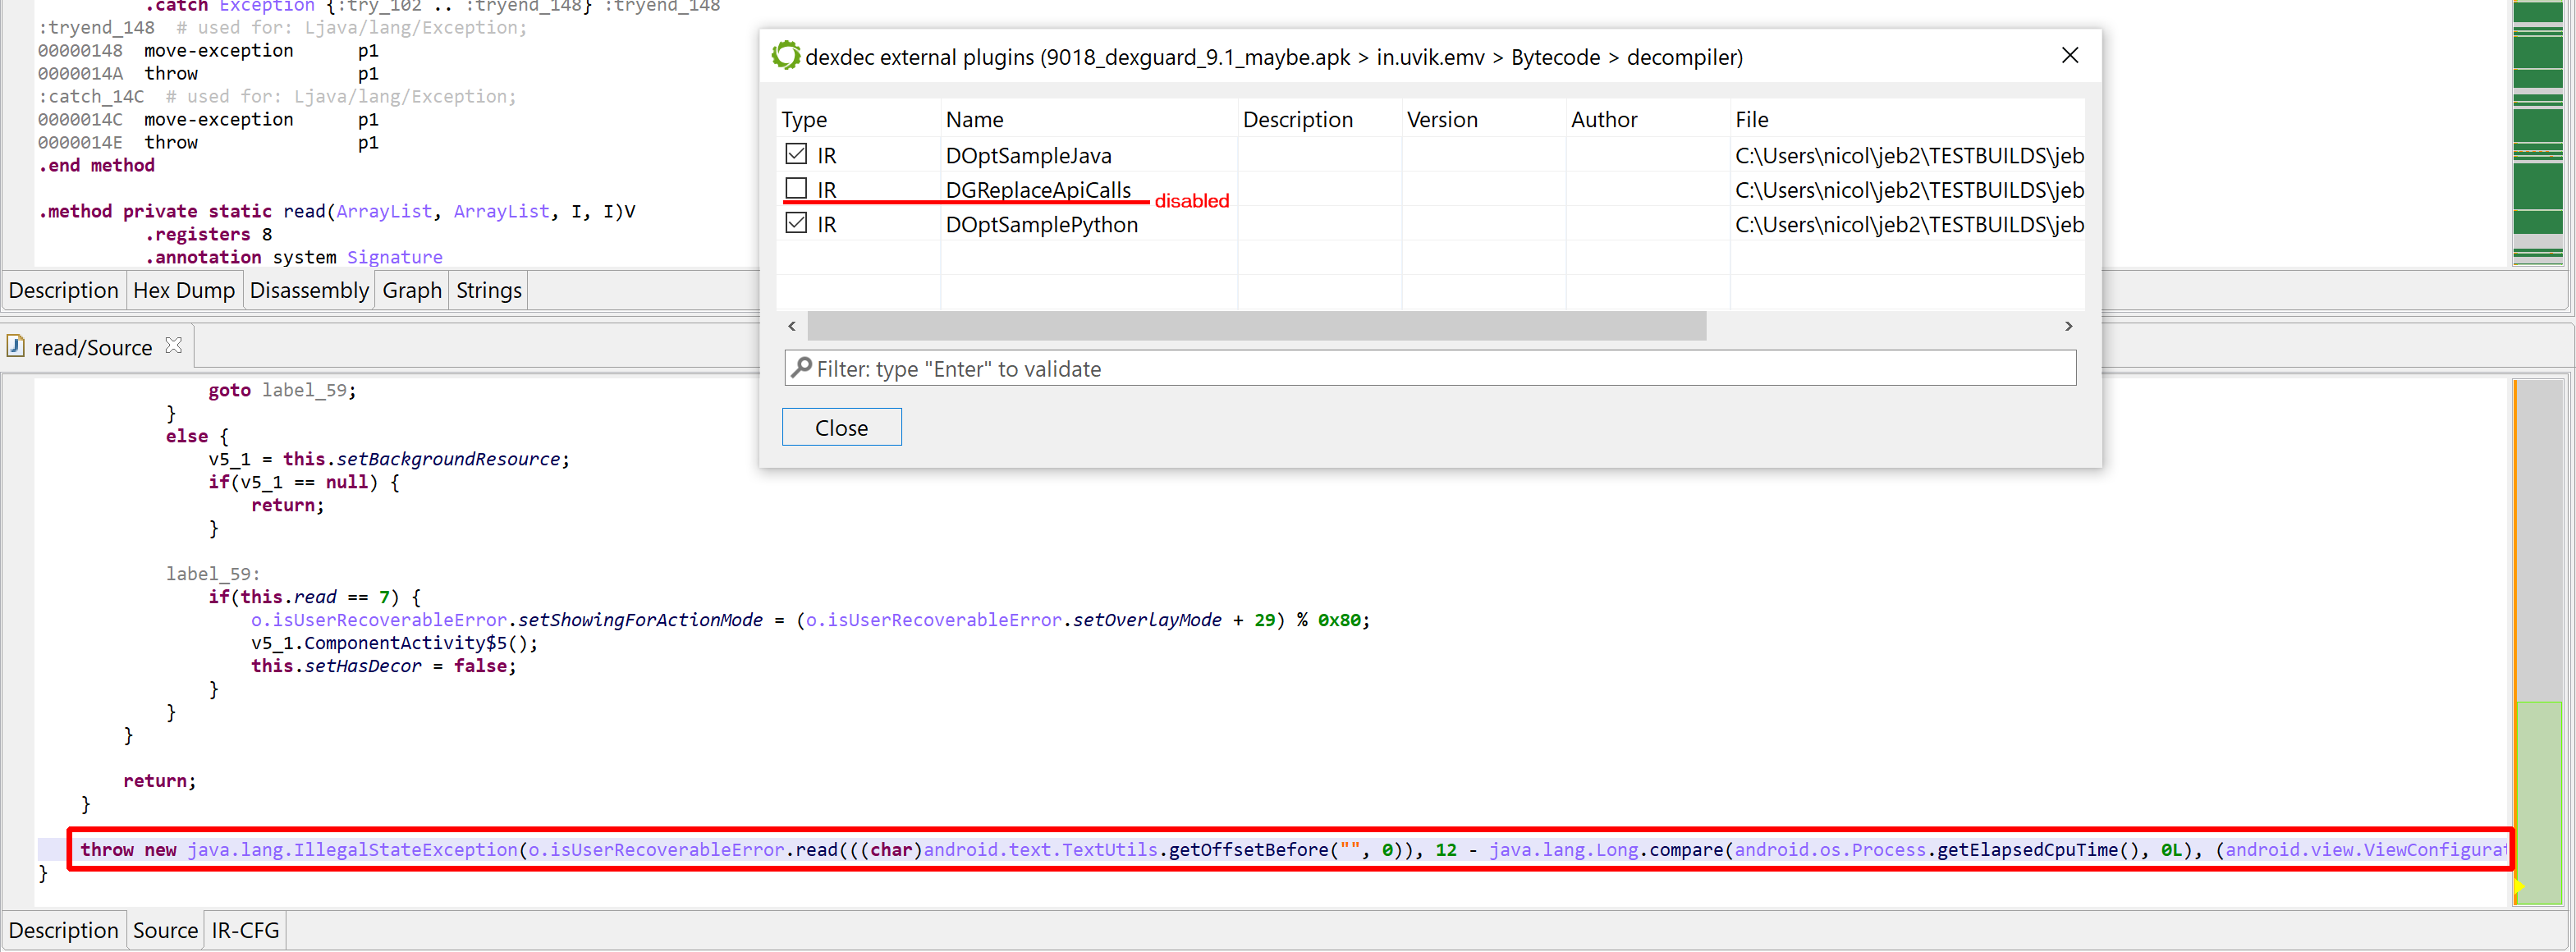
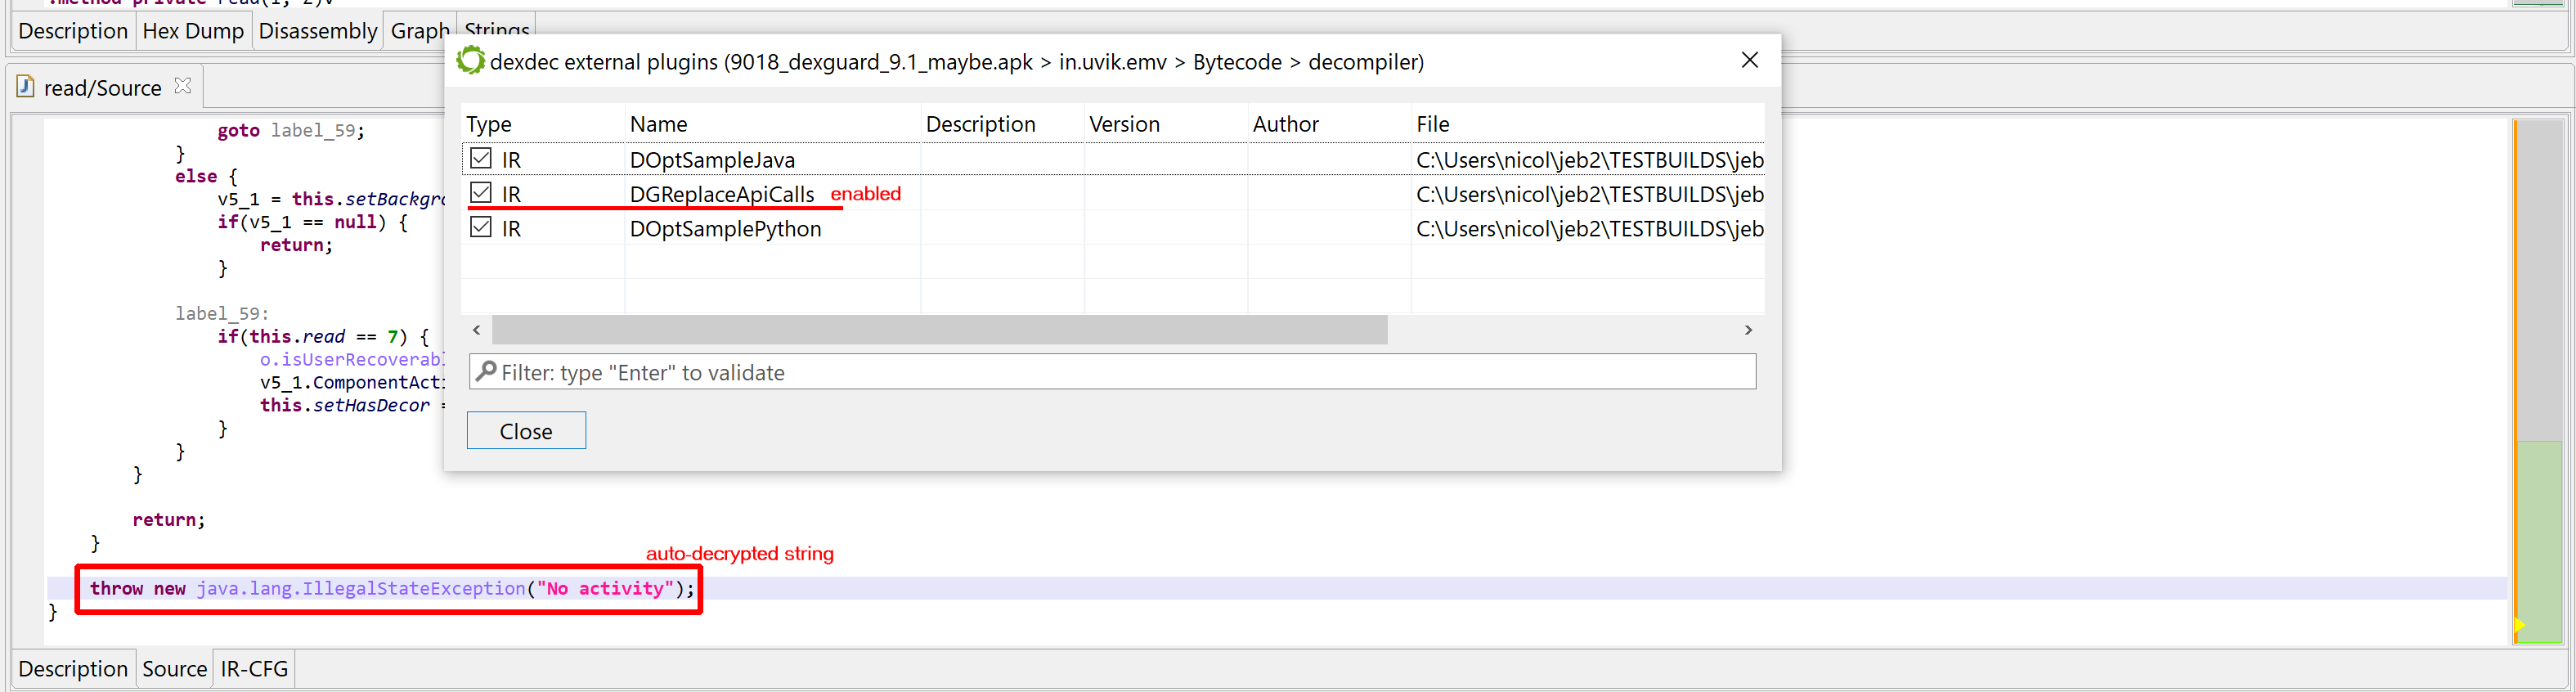
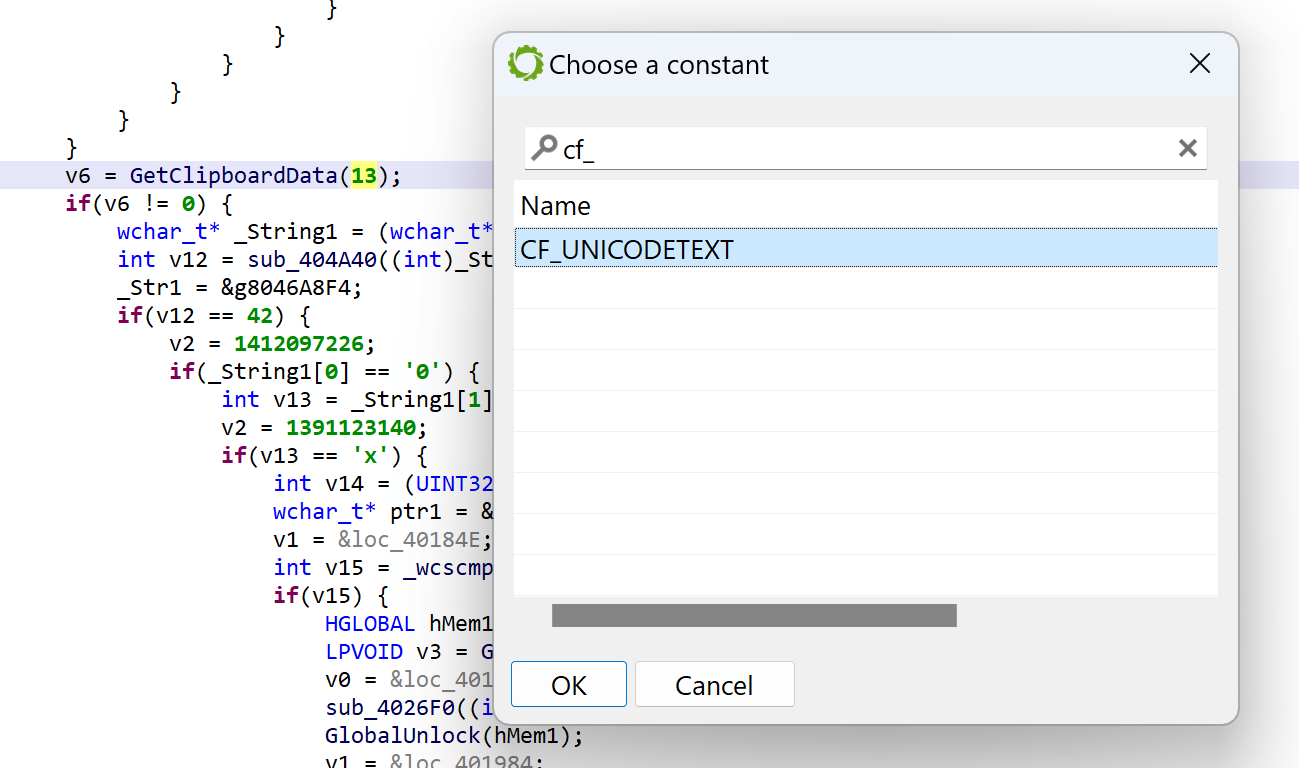
In JEB, you may replace immediates by well-known literals found in type libraries (aka typelibs, such as the win32 typelibs, which were automatically loaded when the analysis of the PE file started). To do that, select the immediate, then hit CTRL+N (menu: Action, Replace…), and select the desired literal 2
For example, per the MSDN, GetClipboardData uses CF_xxx constants to indicate the type of data. We can ask JEB to replace GetClipboardData(13) by GetClipboardData(CF_UNICODETEXT) using the Action/Replace handler:
Conclusion
That concludes the first blog in this “How to use JEB” series. In the next episodes, we will look at other features, dig deeper into writing IR plugins, look into types and types creation, and reverse other architectures, including exotic code.
To learn more, we encourage you to:
- Explore this blog, as it contains many technical entries and how-to’s.
- Look at the sample code (scripts and plugins) shipping with JEB, it will get you started on using the API to write your own extensions.
- Join our Slack channel to engage with other users in the community and ask questions if you’re stuck on anything.
Thank you very much & Stay tuned 🙂 Happy Holiday to All 🎄
–