=> Updated July 10, 2019
=> Other blog posts in the series:
– Debugging Android apps on Android Pie and above
– Crypto Monitoring with the Android Debuggers API
– Debugging Dynamically Loaded DEX Bytecode Files
– Advanced Debugger Usage via the Interpreter
Dalvik and native code debugging has been supported in JEB since version 2.2:
- Linux ELF and Windows PE code object support (32-bit and 64-bit)
- Disassemblers for Intel x86 and x86-64, ARM 32-bit (including floating point support), ARM 64-bit (Aarch64) and MIPS.
- Debuggers for Android Dalvik virtual machines and native Android processes
This post presents the details and caveats pertaining to the Android debuggers, shows how to debug APK’s Dalvik and native code, and explains the debuggers limitations.
Introduction
Debugging closed-source Android apps has historically been challenging at best, close to impossible at worst. JEB took a stab at solving this problem by abstracting away a wealth of low-level details and caveats related to debugging so that analysts can focus on the Dalvik code and associated decompiled Java source, as well as native code.
The Android debuggers make the task of reverse-engineering complex apps, e.g. those using a mix and bytecode and machine code, finally possible in practice. With the rise of app protectors and obfuscators, support for full-scale debugging has become more and more pressing. Earlier in February, we published a video highlighting one major feature of these debuggers: the ability to seamlessly debug to-and-from Dalvik and native code. We will explain in details how to use the features highlighted in the video.
Another area we will explore is the debugging API. The debuggers abide to the JEB IDebuggerUnit family set of interface. They can be used to automate debugging tasks, and allow for easy integration in analysis pipelines.
Requirements
The JEB Android debuggers run on all JEB-supported platforms (Windows, Linux, macOS). Please verify the following before attempting to start a debugging session:
- Make sure to have the Android SDK installed. Ideally, you also want to have either ANDROID_SDK_ROOT or ANDROID_SDK environment variable pointing to the SDK folder.
- Enable Developer options and allow USB debugging on the intended physical target device. (Debugging is enabled by default on the emulators.) On physical devices running Android 4.2 and above, one way to make sure of that is to run the adb devices command. If the device is shown as unauthorized, a pop-up on your phone will appear to request authorization.
Debugging non-debuggable apps
Normally, only apps whose Android Manifest explicitly has a debuggable flag set to true are debuggable. However, this is rarely the case when analyzing in-the-wild applications, malicious or otherwise. In such cases, you have several options.
- Run the app in an emulator. Emulators have the ro.debuggable property set to 1. This means they will debug all apps, regardless of the debuggable flag in the Manifest.
- Use a rooted phone. A rooted phone will allow you to modify the ro.debuggable property, and change it from 0 (standard on production devices) to 1. The rooting process is out-of-scope for this document: it is device specific and rooting instructions can easily be found online. As for ro.debuggable, we will explain how to change this system property in a separate blog entry.
- Unpack/modify/repack your app. (Update: JEB can do this for you) Depending on whether the Manifest is obfuscated or not, this may be the simplest option. If the Manifest is obfuscated, the repacking process may not work. Another caveat applies: signing. You will have to sign the repacked app using your own key; be aware of the implications if you choose that option. 1
Caveat: Native code in non-debuggable apps
When it comes to debugging native code of non-debuggable apps on a rooted phone or emulator, other limitations apply. 2 JEB tries its best at abstracting them away. However, things might be unstable depending on which phone and OS is being used. Do not hesitate to let us know if you encounter issues.
Note that most of our tests are done on Nexus devices running vanilla Android 5.1 and 6.0. Using similar devices for debugging will likely reduce the chances of running into corner-case problematic situations.
Starting a debugging session
Currently, JEB can start Android debugging sessions only when analyzing APK files. If your main artifact in JEB is an orphan DEX file, the UI client will refuse to start a debugging session.
First, retrieve your target APK and get the app ready for debugging:
- Make sure the APK matches the one that will be executed on the target phone. You can download the APK using adb 3:
- adb shell pm list packages -f to retrieve a list of packages and the associated path to APK
- adb pull <pathToAPK> to download the APK
- Start the app on the phone
- Via the App Launcher for instance, if attaching to an already running app is an acceptable scenario
- If you want the app to wait for the debuggers to attach to it before it starts executing any code, you can run something like: adb shell am start -D -S -n <packageName>/<activityName>
- A popup will be displayed on the phone, indicating it is waiting for a debugger to attach to the VM
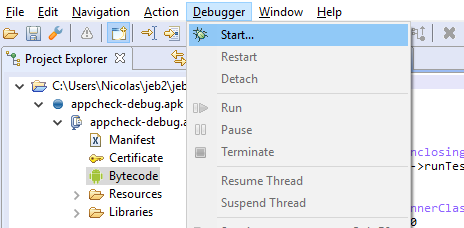
Second, in the RCP desktop client:
- Start an analysis of the APK file
- Open a view of a main DEX file
- Once the focus is on the DEX view, open the Debugger menu, and click on Start…
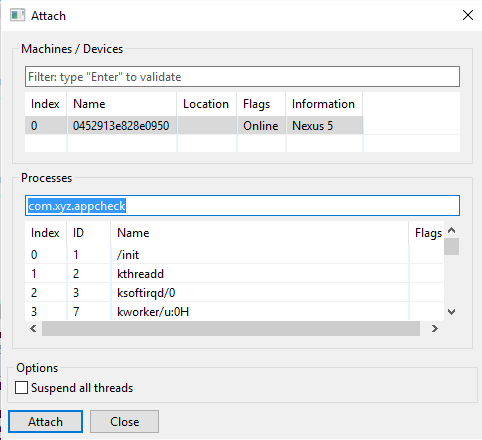
In the Attach dialog window:
- Select the target phone and the target process that matches your app, and click Attach.
- Unless you tick the “Suspend all threads”, The app will be immediately be run/resumed after attaching.
- The process filter is normally filled out with the APK package name. Simply press enter to filter out entries.
- (No longer the case)
Your entry must have a D flag. This flag indicates that the target device will accept incoming debugger-attach requests to the target process. If you are trying to attach to an entry that does not have this flag, the operation will fail.
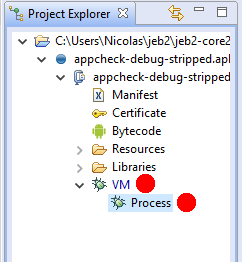
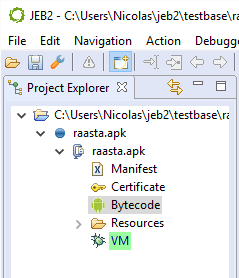
- After attaching, the app, you should see one or two additional nodes in the Project tree view.
- If the app does not contain native code: there will be one node, representing the Dalvik VM debugger
- If the app contains native libraries (*.so files in lib/ folders): there will be an additional node to represent the native code debugger
- When a debugger is successfully attached, the corresponding node has a light green background.
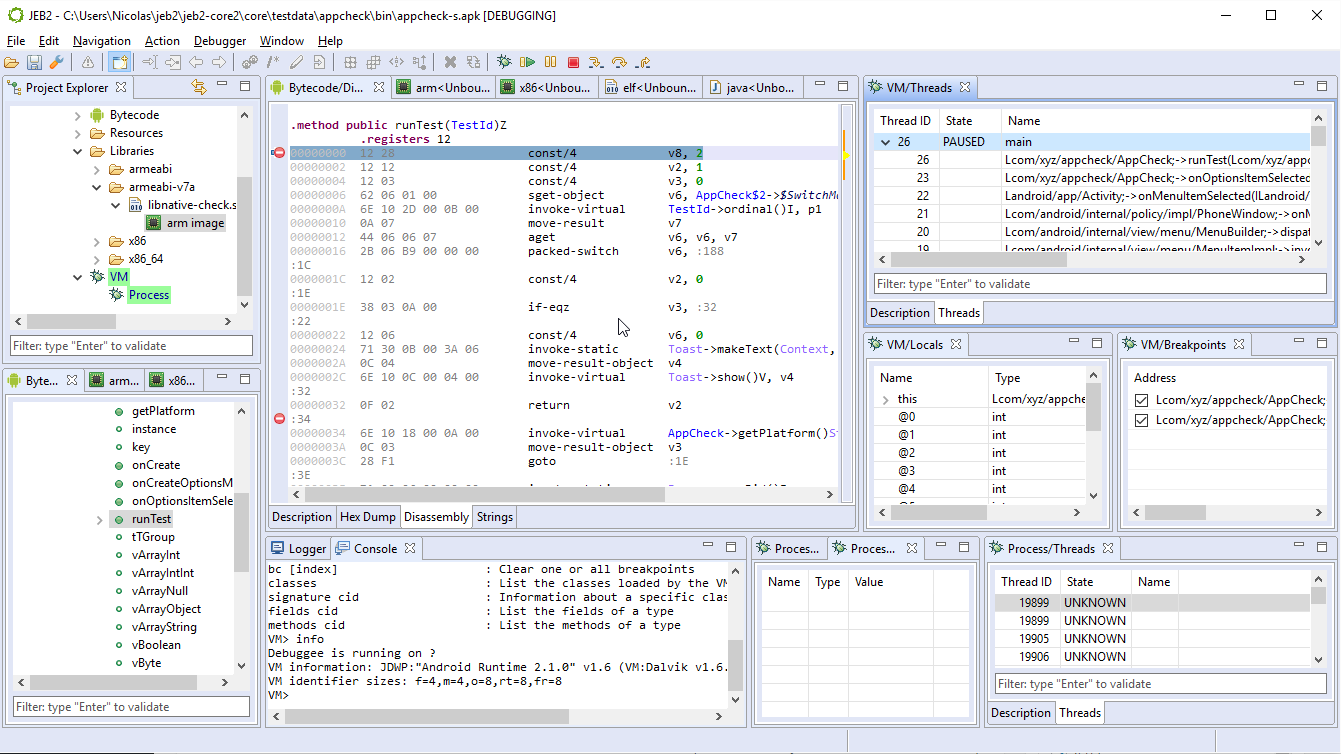
Views and layout
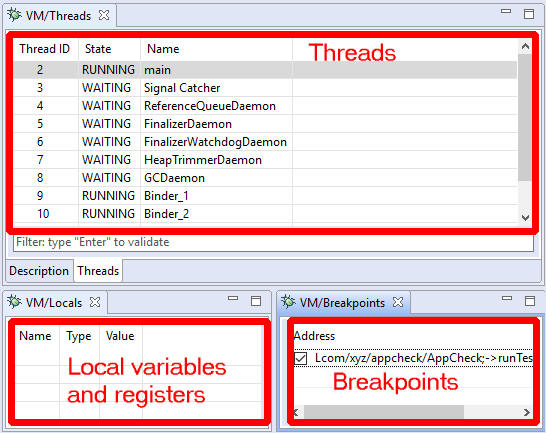
- Open the VM debugger views by double-clicking the VM unit node. At this point, you will want to customize your layout: debugger views can seriously clutter the workspace area. See an example of customized layout below:
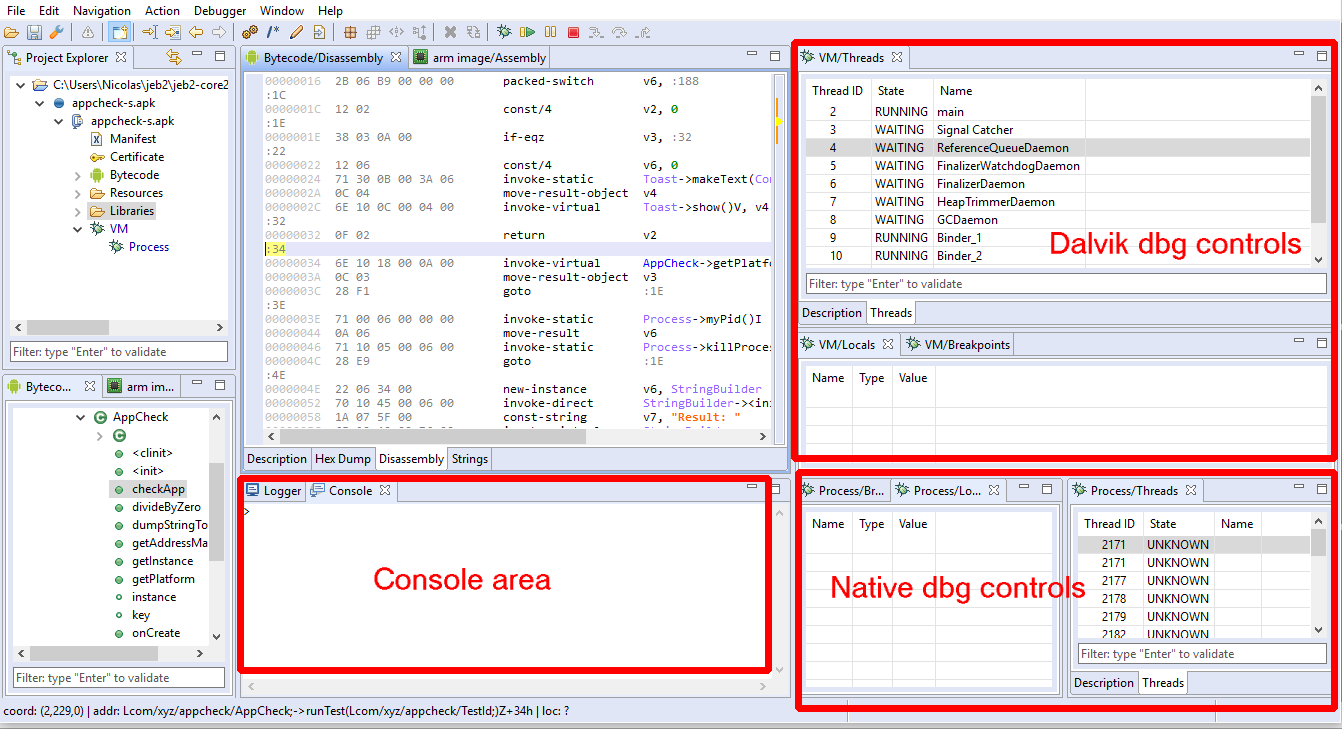
Layouts can be customized via the Window menu; more details can be found in a previous blog entry.
The debuggers should now be attached.
- The Process debugger is never paused after attaching
- The VM debugger is paused if and only if the “suspend threads” option box was ticked
Keep in mind that pausing the Process debugger (ie, suspending the native threads) will obviously freeze the higher-level Dalvik VM!
Next up, let’s review the debugger controls and controls.
Basic debugger controls via the UI
Active debugger
The most important thing to remember about debugger controls is that the UI controls affect the debugger related to the view currently focused.
Unlike most tools, JEB allows multiple debuggers and debugging sessions to take place at once. Therefore, be mindful of which debugger is being controlled when pressing menu entries or toolbar buttons: If the focus is within the DEX view or any VM debugger view, the controls are connected to the VM debugger; if the focus is within a code view connected to the Process debugger, the controls are connected to the Process debugger.
Controls
Basic debugger controls can be accessed via the Debugger menu or the toolbar area. They allow:
- Attaching, detaching, terminating the process
- Pausing and resuming the process and, possibly, its individual threads
- Stepping (into, over, out of)
- Toggling execution breakpoints 4
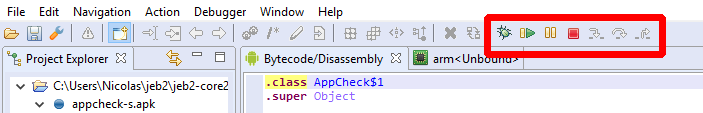
Not all controls can or are implemented for all debuggers. Currently for instance, pausing individual threads of the Process debugger is not possible. When a control is not available, depending on which control it is and the severity of the failed operation, the user may be unable to activate it (eg, grayed button), receive an error in the logger, or receive a pop-up error in the client.
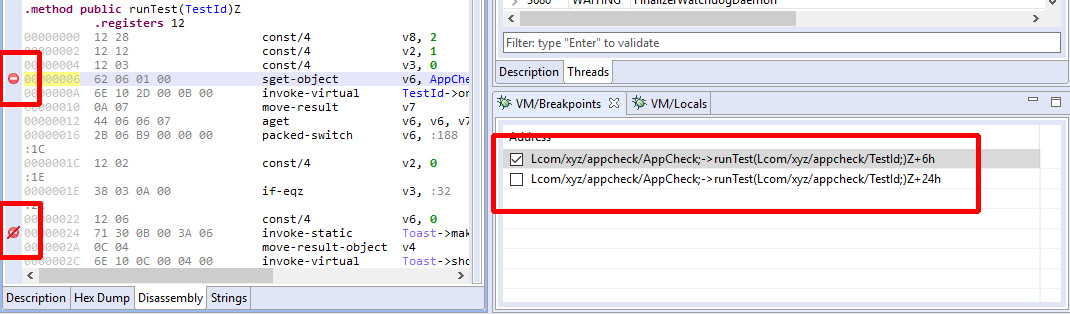
Breakpoints can be set/unset using the handy Control+B (or Command+B) shortcut. An icon is displayed in the left vertical bar of a code view to represent enabled/disabled breakpoints .
Debugger views
Here are some of the views rendered by the UI client when visualizing a debugger unit. (Other views were added over time.)
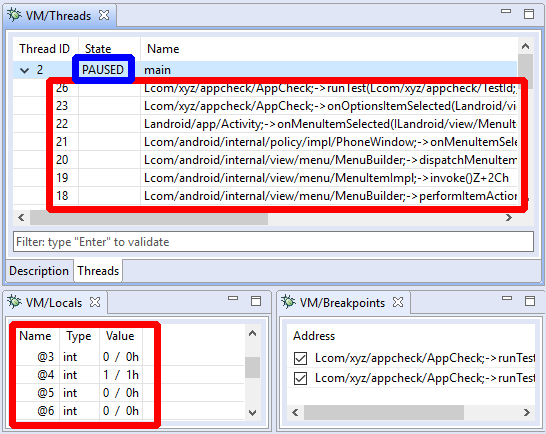
- The Threads view displays thread identifiers, status (running, suspended, waiting, etc.) as well as the stackframes when a thread is paused. Depending on the target processor, there may be one or more stackframes, showing the location (program counter register or address) of the current thread.
- The Breakpoints view displays active and inactive code breakpoints. (More on breakpoints and breakpoint types later.)
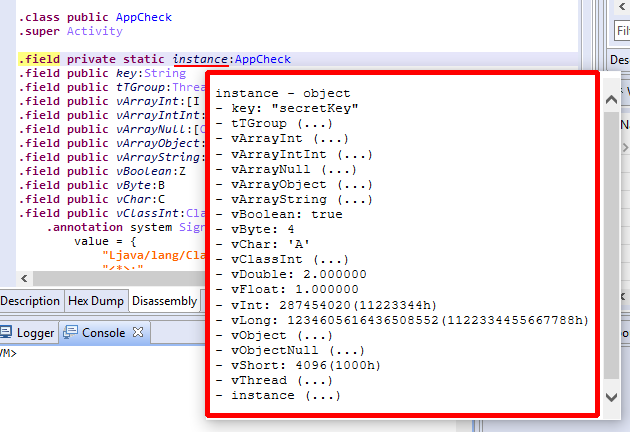
- The Locals view shows the generic variables registers. They can be virtual slots of a VM, registers of a native process, complex variables inferred by the decompiler, etc.
Every debugger has specifics that are relevant to the target being debugged. While the JEB API and front-end are trying to abstract the nitty-gritty details away, there are times when generic controls are not enough. In the next section, we discuss how users can issue such commands via the debugger console.
In the case of the Dalvik VM, the Locals view can be used to display complex objects or arrays, as is shown below:
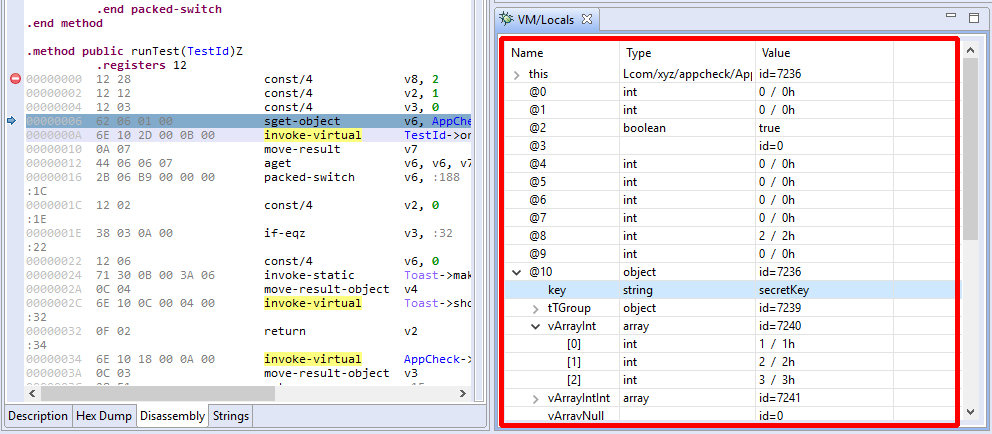
In the case of local variables, the type of a Dalvik slot (v0, v1, etc. ) is usually inferred thanks to the Dalvik decompiler. A JEB build that does not ship with the decompiler will not be able to display most frame variables accurately.
Live variables overlays
When a thread is paused, the debuggers (native as well as Dalvik’s) provide overlay information when the mouse cursor hovers over registers, variables, class fields, or any other visual element that holds data.
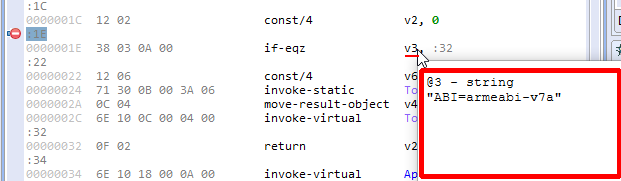
In the case of the Dalvik debugger, overlays also work in Java decompiled views.
Advanced controls via the console
The debugger units make use of the IUnit.getCommandInterpreter method to provide clients with command interpreters to execute advanced debugger commands, that may not be readily made available by graphical clients.
In the UI client, command interpreters offered by units are accessible via the Console tab. Once the Android debuggers are attached, switch over to the Console view, and type list. This command will list all command interpreters currently attached to the console:
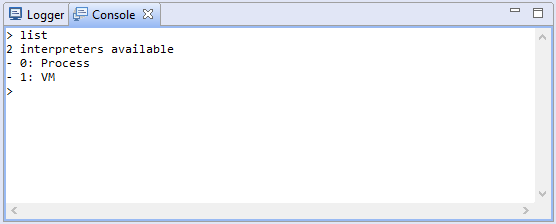
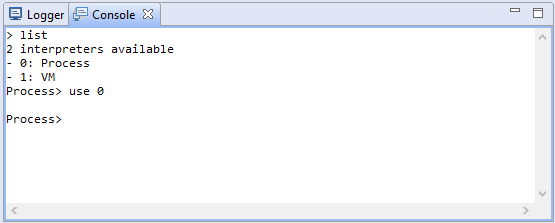
An interpreter has a numeric id as well as the name of the unit that created it. Switch to an interpreter with the use <id|name> command.
The special command help, available in all interpreter contexts, lists all commands made available by the interpreter currently in use.
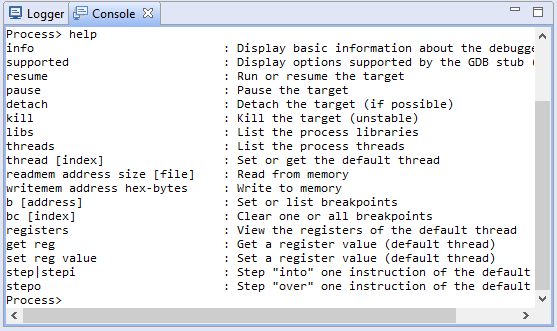
In this example, we can see that the Process debugger offers ways to read and write to memory, set registers, and also issue low-level GDB commands (use this option carefully).
Settings
The Android debuggers offer options to control low-level debugger parameters, such as ports and timeouts.
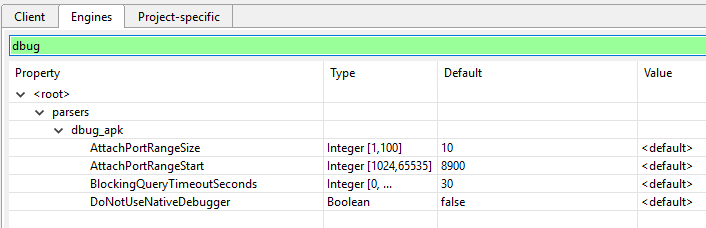
If you wish to disable native debuggers entirely, set the DoNotUseNativeDebugger to true.
API for Scripting and Automation
Debugger modules in JEB implement the set of interfaces contained in the com.pnfsoftware.jeb.core.units.code.debug public package. The principal interface in this package is IDebuggerUnit. Plugins, scripts, or third-party clients wishing to automate the usage of debuggers can us these well-defined interfaces. The official UI client uses this public API. Anything that the UI client does (and more) can be done and/or automated by third-party code.
Check out our post on Android crypto primitives hooking to see how the API can be used to retrieve pre-encryption or post-decryption data on the fly.
Within the next couple of weeks, we will upload sample code on our GitHub repository demonstrating how to use the JEB Debugger API.
More on scripting: https://www.pnfsoftware.com/blog/crypto-monitoring-android-debuggers-api/
-nicolas
- A technical implication is that apps performing health checks such as signature verification can easily detect that they have been signed by an unauthorized key. But then again, running an app on a rooted phone or an emulator is also something easily detectable. Each method has its advantages and shortcomings, be aware of them. ↩
- They mostly have to do with the run-as Android utility. JEB ships with a modified version of the utility to allow debugging the native code part of non-debuggable apps. ↩
- We strongly recommend our users to get familiar with the Android system tools and debugging tools ecosystem, in particular adb, am, and pm. ↩
- Toggling breakpoints on and off is currently not available in decompiled views. ↩