Let your agent know about the location of that documentation: update your AGENTS.md file or CLAUDE.md file
You should also point the agent to the sample scripts and sample plugins folder (scripts/samples/, coreplugins/scripts/), as agents work better with example code.
Join us on Slack if you have any technical questions!
Our March 2026 release (JEB 5.38) ships with a transparent, flexible and fast code matching facility:
Transparent: as you reverse engineer your project, library code may be detected and reported.
Flexible: matching is designed to resist recompilation, obfuscation, and method inlining to some degree.
Fast: matching is almost instantaneous.
This initial implementation is enabled for dex only. It will be made available for native code in a future release. The initial database is relatively compact. Mostly, it contains signatures for the latest JAR and AAR libraries commonly used in APKs, such as Androidx.
Keep in mind code matching cannot guarantee accurate results in all cases! To ensure a low false-positive rate, the code matching module reports top-score matches only. Thresholds can be changed in the options.
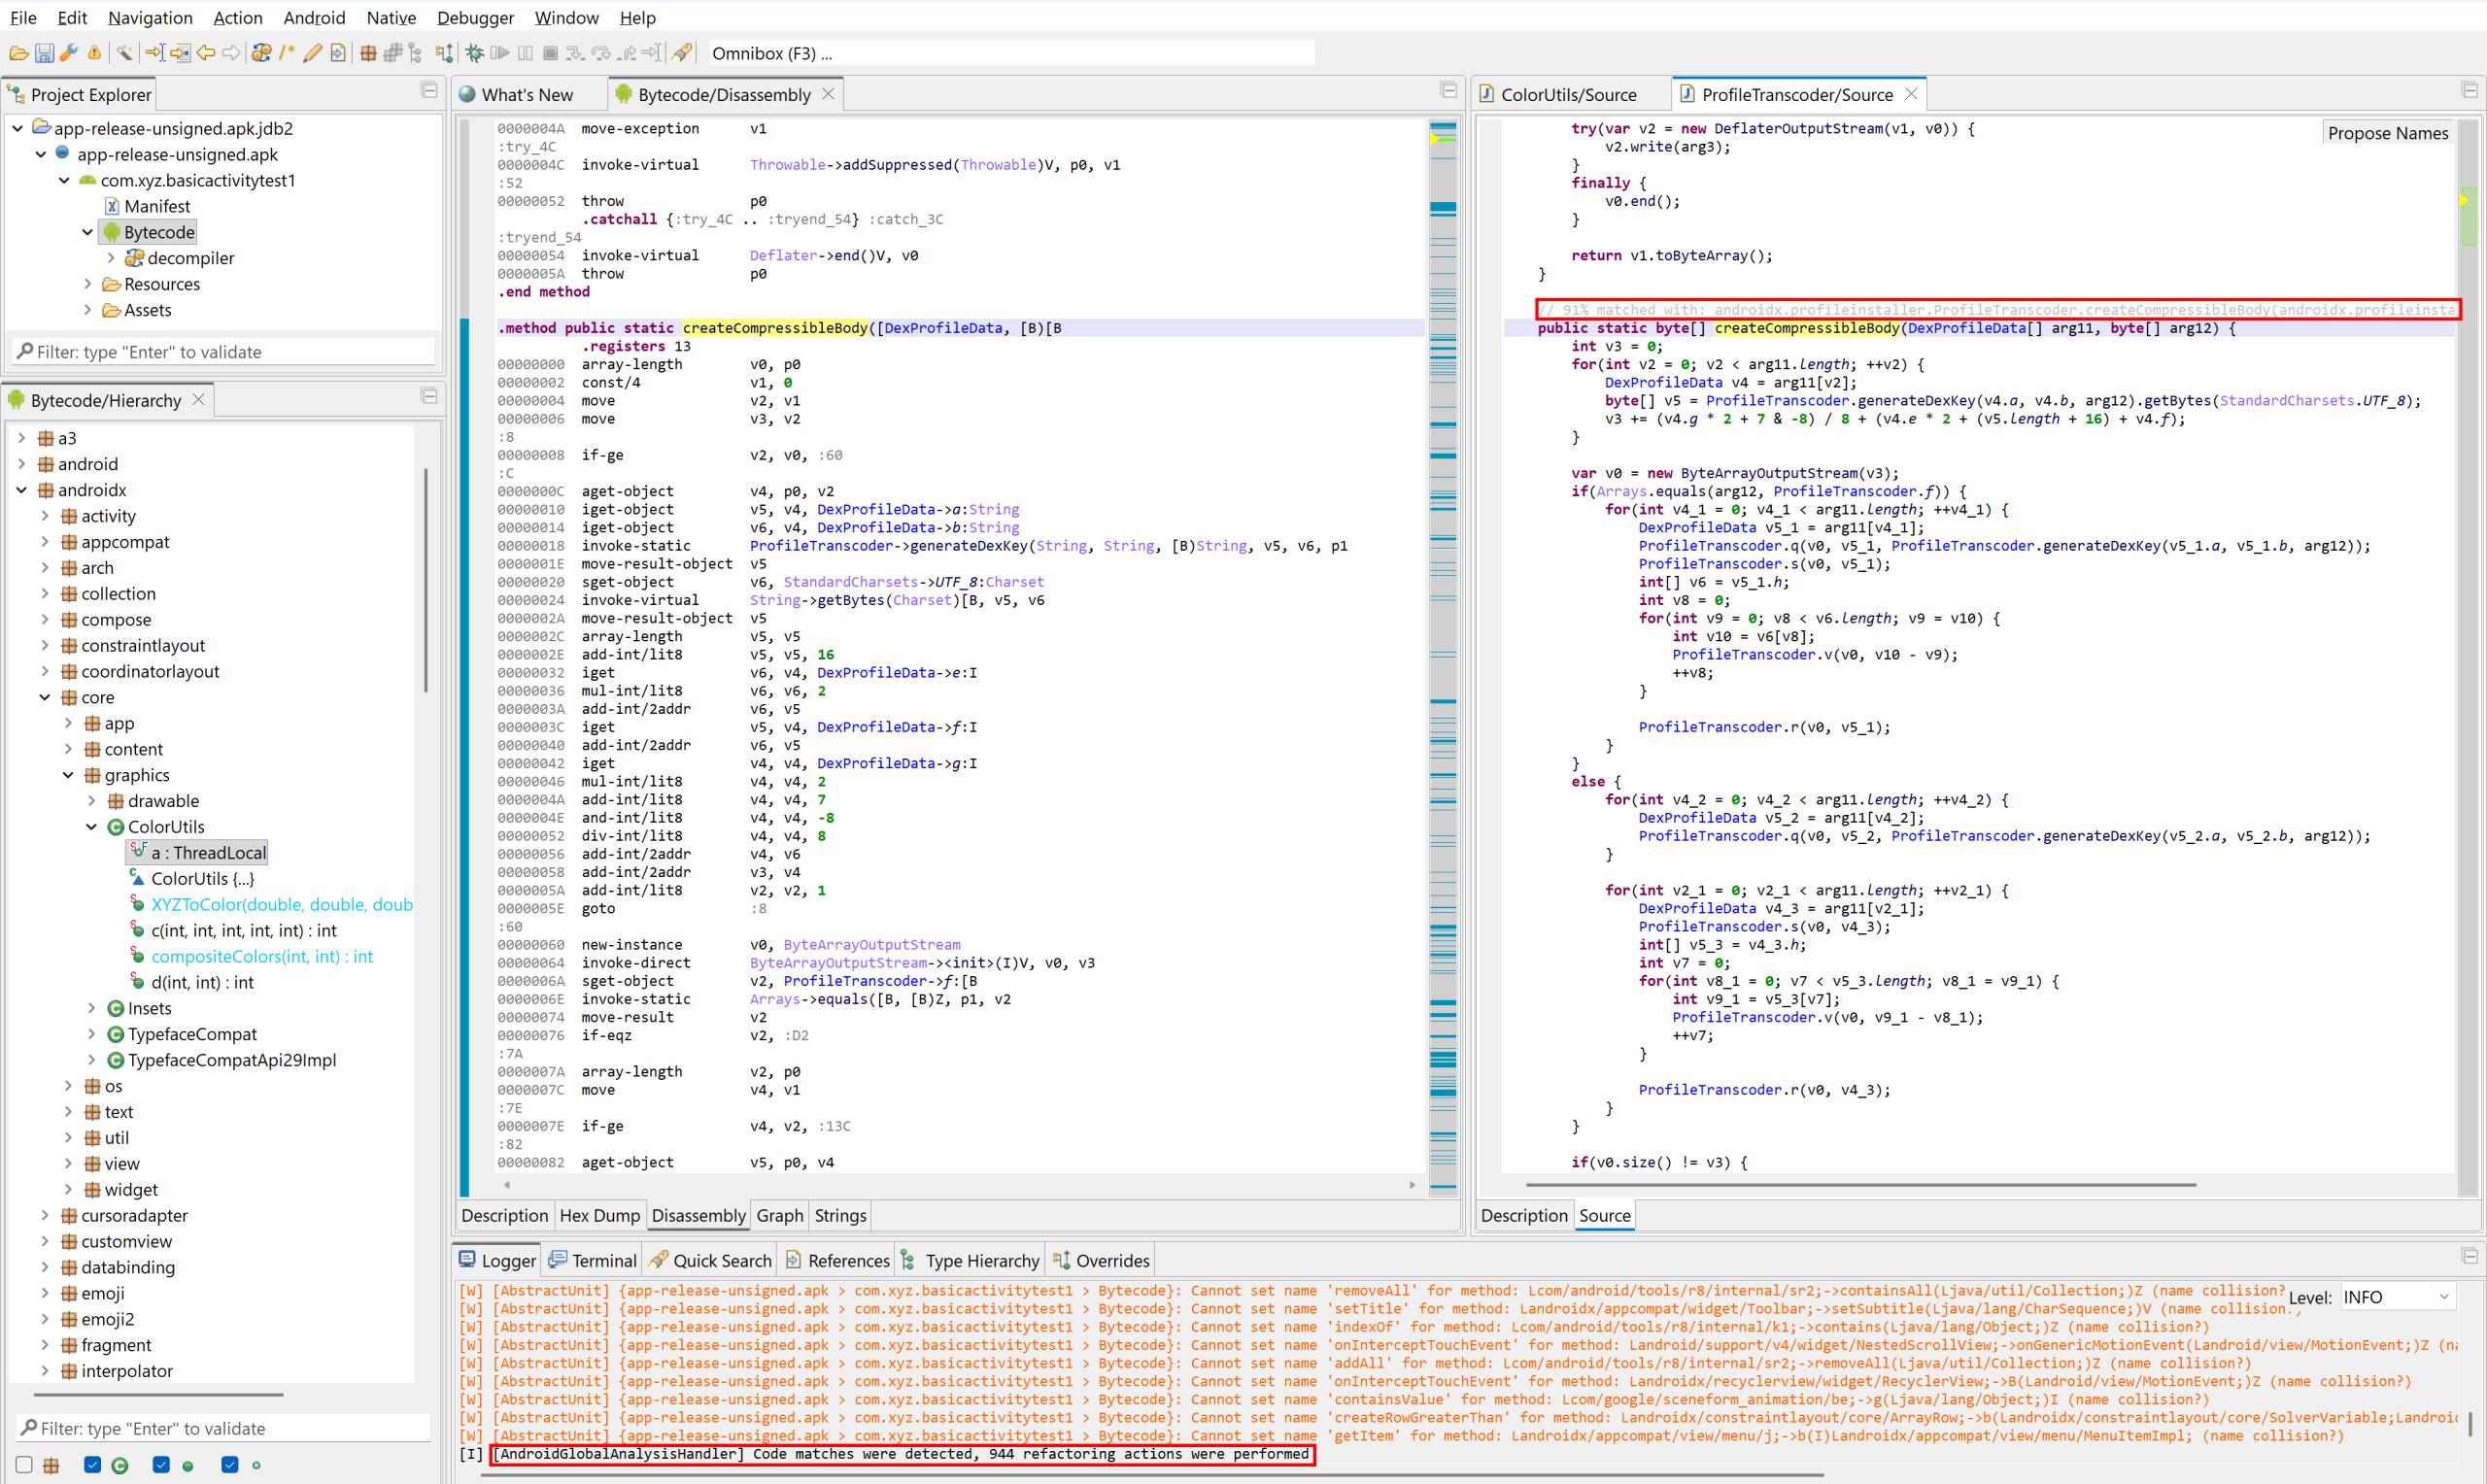
In this example screenshot, you may see an obfuscated version of androidx’s ProfileTranscoder.createCompressibleBody method (which inlines additional sub-routine calls) detected with a high score.
So, how to best-use this feature in your workflow?
Project-wide global analysis
When you start a new project, we recommend running a Global Analysis, with the code matching option enabled.
When this toggle is enabled, after the analysis completes, high-score matches will be applied:
Methods will be renamed.
Classes and types will be renamed and refactored (moved to newly-created packages).
A special color is used in disassembly listing and code hierarchies to indicate library code.
Auto-matching when decompiling
By default, code matching also happens transparently when you decompile code via the GUI.
This option can be set at the engines level or on-demand, when decompiling (Ctrl+TAB, or Cmd+TAB)
Detected matches will be placed as method comments in the decompiled Java code.
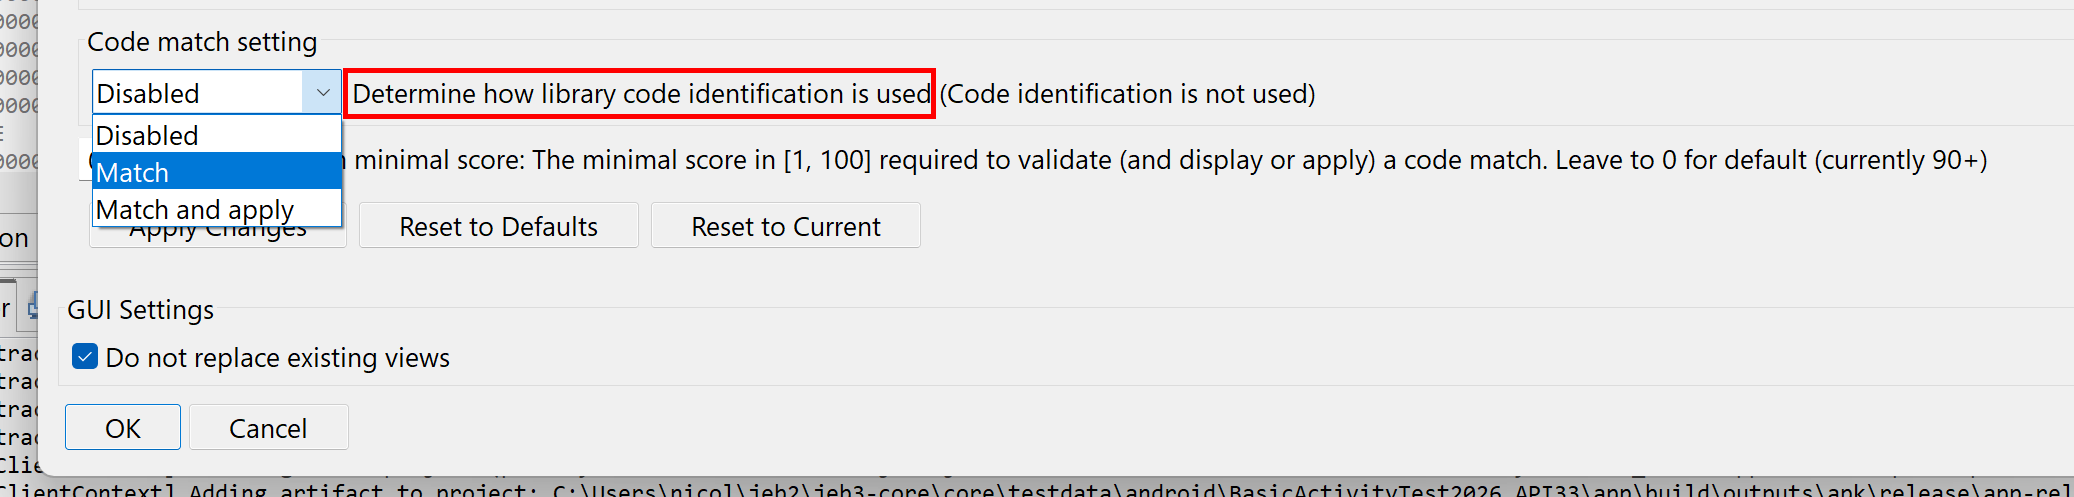
To disable that behavior, set the .parsers.dcmp_dex.CodeMatchSetting option to Disabled (0).
To apply detected matches (rename and refactor code), set that option to Match and Apply (2).
API for scripting
In scripts and plugins, the code matching facility can be accessed via methods of IDexDecompilerUnit:
setCodeMatchingOverride
getCodeMatchingOverride
applyCodeMatches
getUnappliedCodeMatches
clearCodeMatches etc.
Match objects may also be set and retrieved through IDexUnit:
setMethodMatch
getMethodMatch etc.
Future updates
We intend to tweak the code matching system over the next few releases, to ensure a low rate of false positives while maintaining a decent amount of true positive detections.
The code signing process may also evolve and require adjustments. 1 Once it has stabilized, likely in the next couple of releases, we will consider the inclusion of transparent auto-signing for all code being analyzed. It will allow users to better leverage their reverse-engineering efforts across different projects, e.g. receive hints about code they’ve already worked on, at what time, etc.
The code matching system will also be made available to the native code analysis pipeline via gendec shortly. We will keep you posted. Consider following us on X or join our Slack channel if you haven’t done so.
—
Until next time & thanks again for your support – Nicolas 🙂
We currently use low-dimensionality vector embeddings to represent code routines. The embeddings may be tweaked, however they will remain compact to ensure a low-disk footprint, low-memory and fast matching. ↩
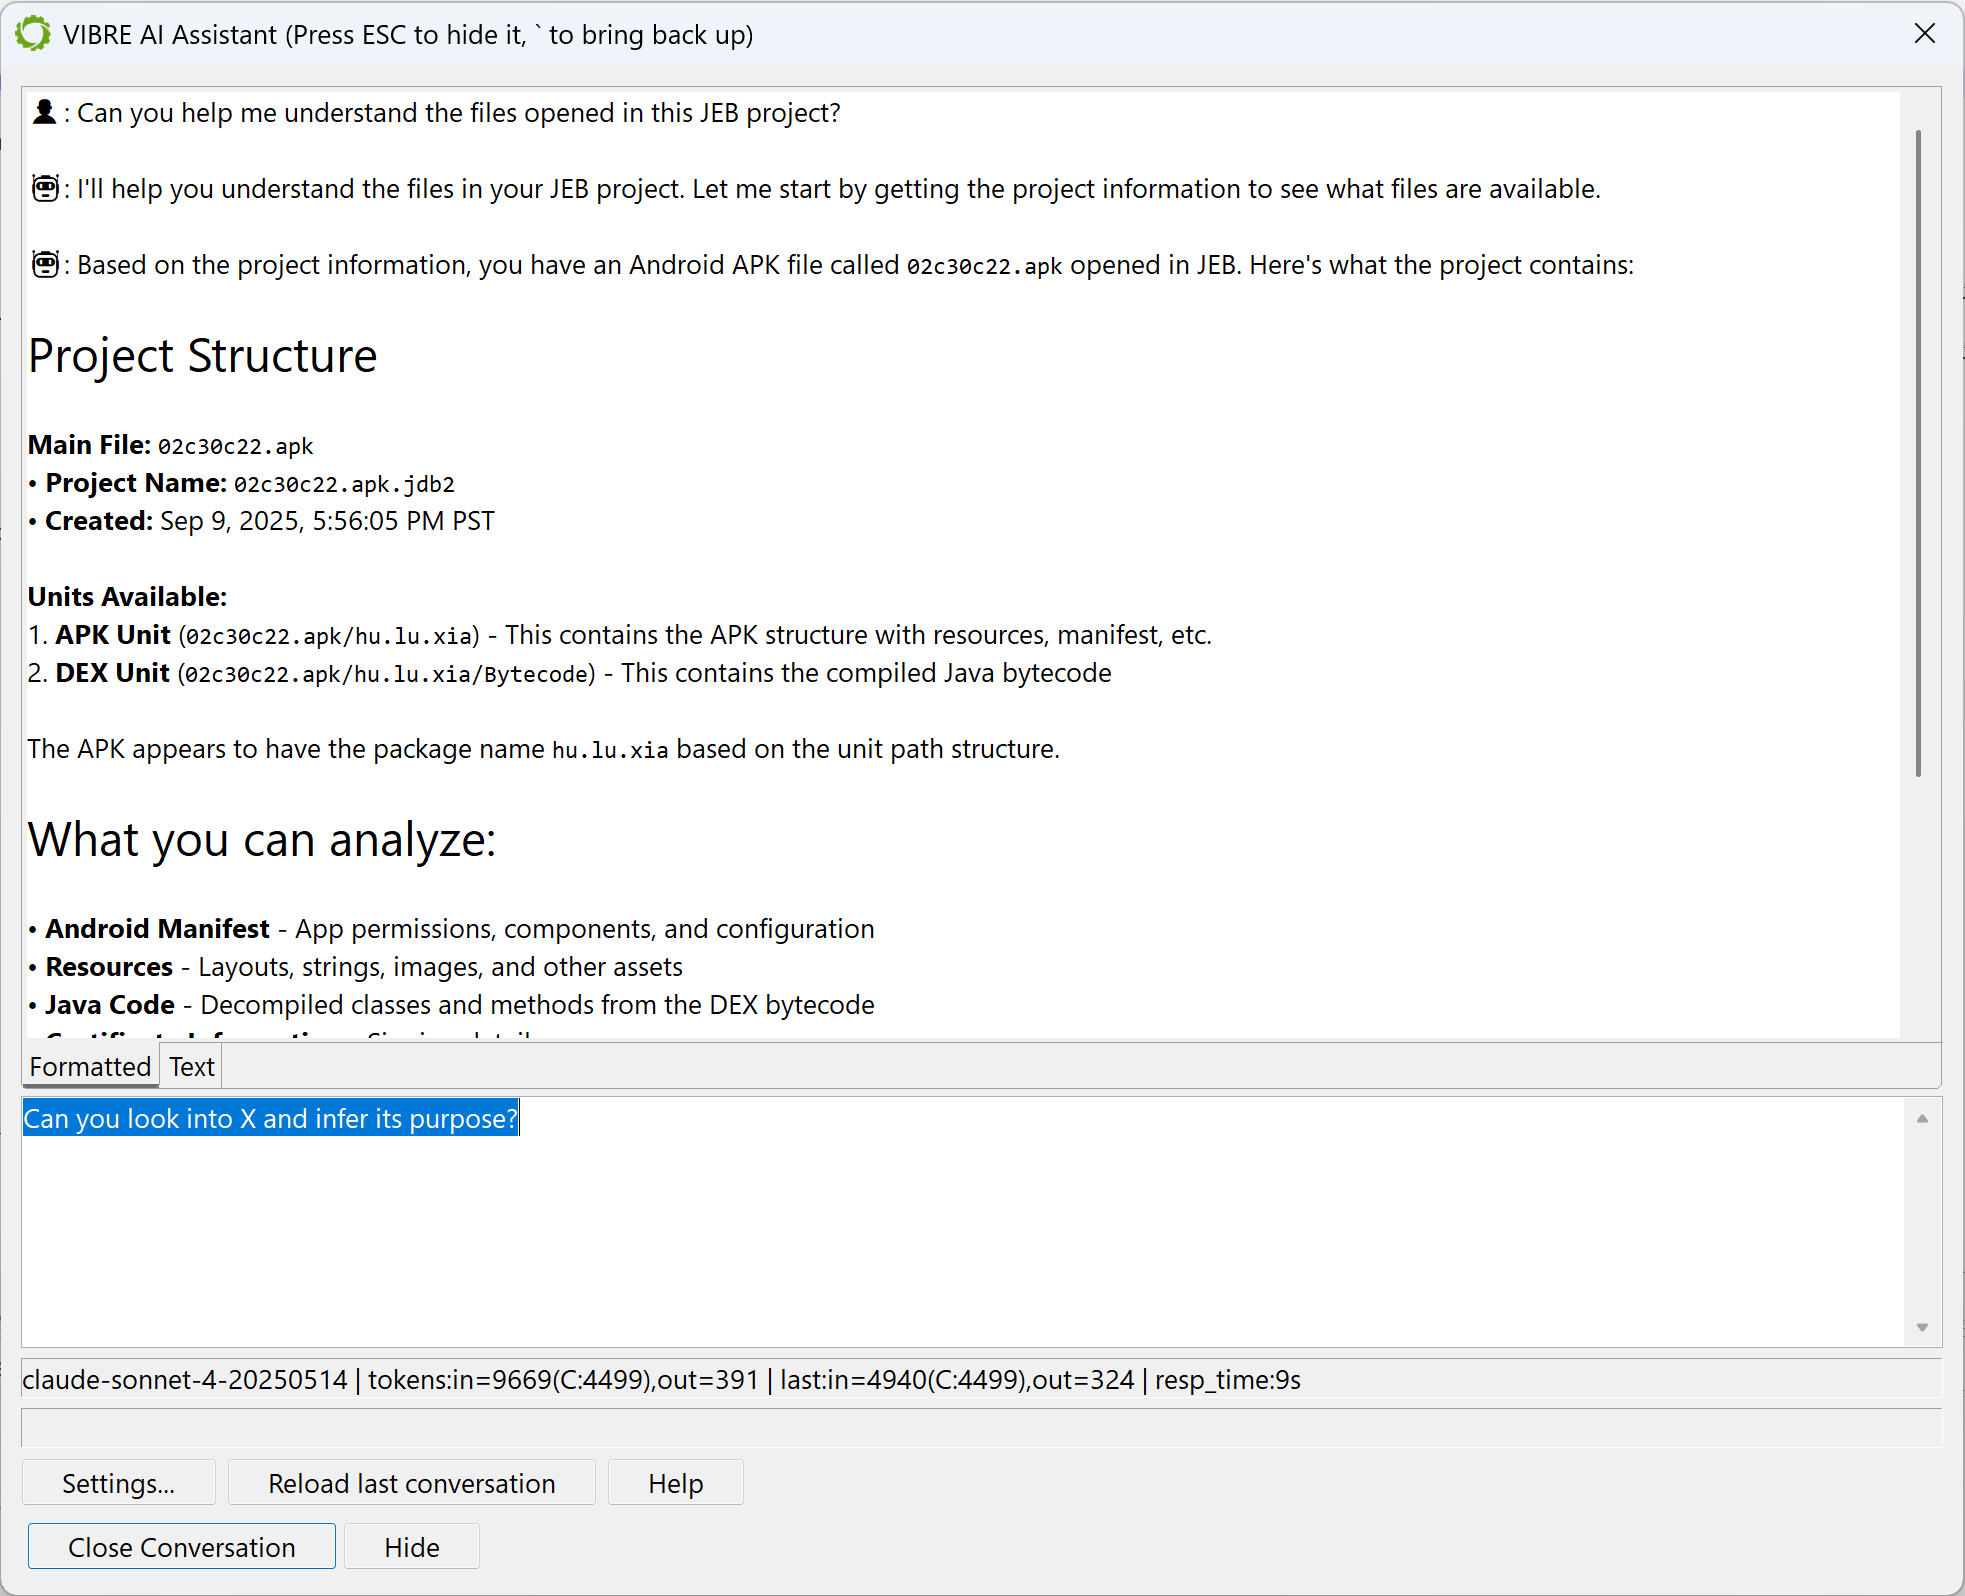
[This entry was updated on June 26 to reflect changes and additions all the way to JEB 5.42] JEB ships with VIBRE1 , an AI assistant that can help users reverse-engineer their project files.
What is VIBRE
You may call VIBRE at any time by pressing the backtick key or via the Action menu.
The VIBRE dialog can be opened at any time by pressing the backtick key
It is backed by: 1) JEB’s Model Context Protocol (MCP) server 2) A Large Language Model (LLM) of your choice
VIBRE can be used on any JEB project consisting of any file(s). It has a complete view of the opened project and can manipulate it via the tools offered by the MCP server, invoked by the LLM.
The short videos below demonstrate how VIBRE can be prompted by a JEB user:
API Connectors
As of JEB 5.41, five API connectors are now supported by VIBRE and JEB MCP:
OpenAI legacy (/v1/chat/completions)
OpenAI (/v1/responses)
Anthropic (/v1/messages)
Google Gemini (/v1beta/$MODEL:generateContent)
AWS Bedrock (/model/$MODEL/converse)
Language Models
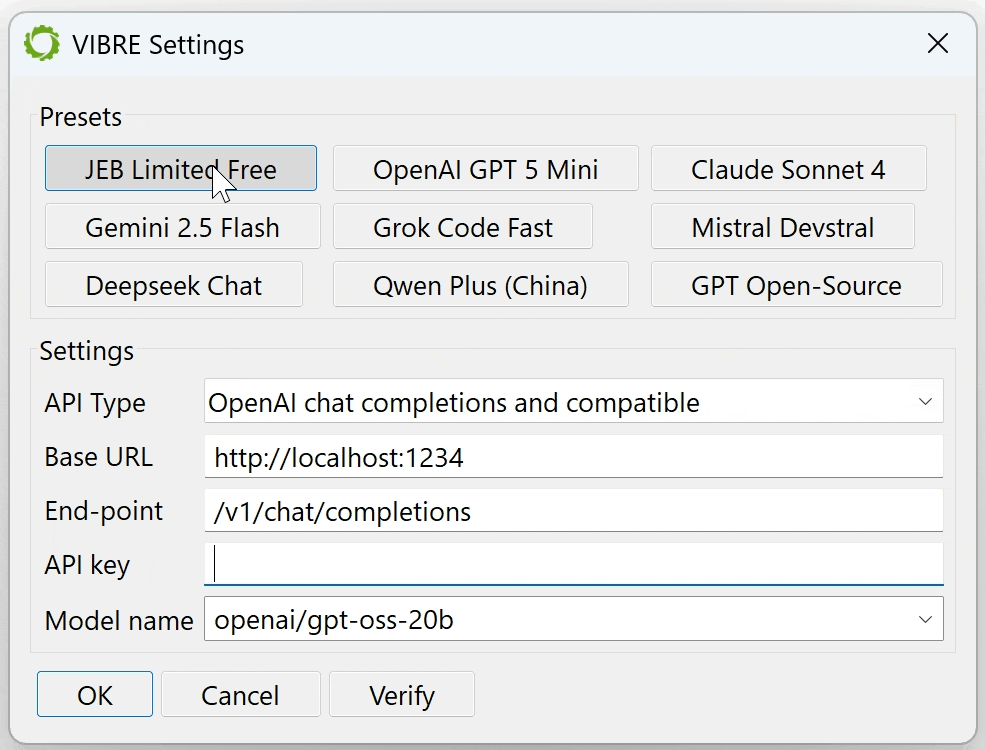
You may select any model that fits your – or your organization’s – requirements:
A commercial frontier LLM: such as ChatGPT, Claude Opus, Gemini, Grok, Mistral, Deepseek, Qwen, etc. We have several presets for most well-known top-of-the-line LLMs. Make sure to fill in your API key if it is not already present in a well-known environment variable.
Your organization’s private language model: if you work in a SCIF, isolated network, work on sensitive artifacts, or have similar constraints that forbid the use of outside LLMs.
A small or medium model running locally on your machine: such as gpt-oss or codellama running on LM Studio or Ollama. You will need a robust GPU to obtain decent inference times.
Our own, free OpenAI’s API-compatible end-point: It is the first preset option and the chosen default if no LLM API key was provided. Our end-point is a proxy to several well-known commercial frontier models. We intend to provide this option free of charge for as long as traffic and usage allows, but be aware that it is rate limited!
The VIBRE settings dialog allows the users to select their preferred language model.
Using AWS Bedrock Models
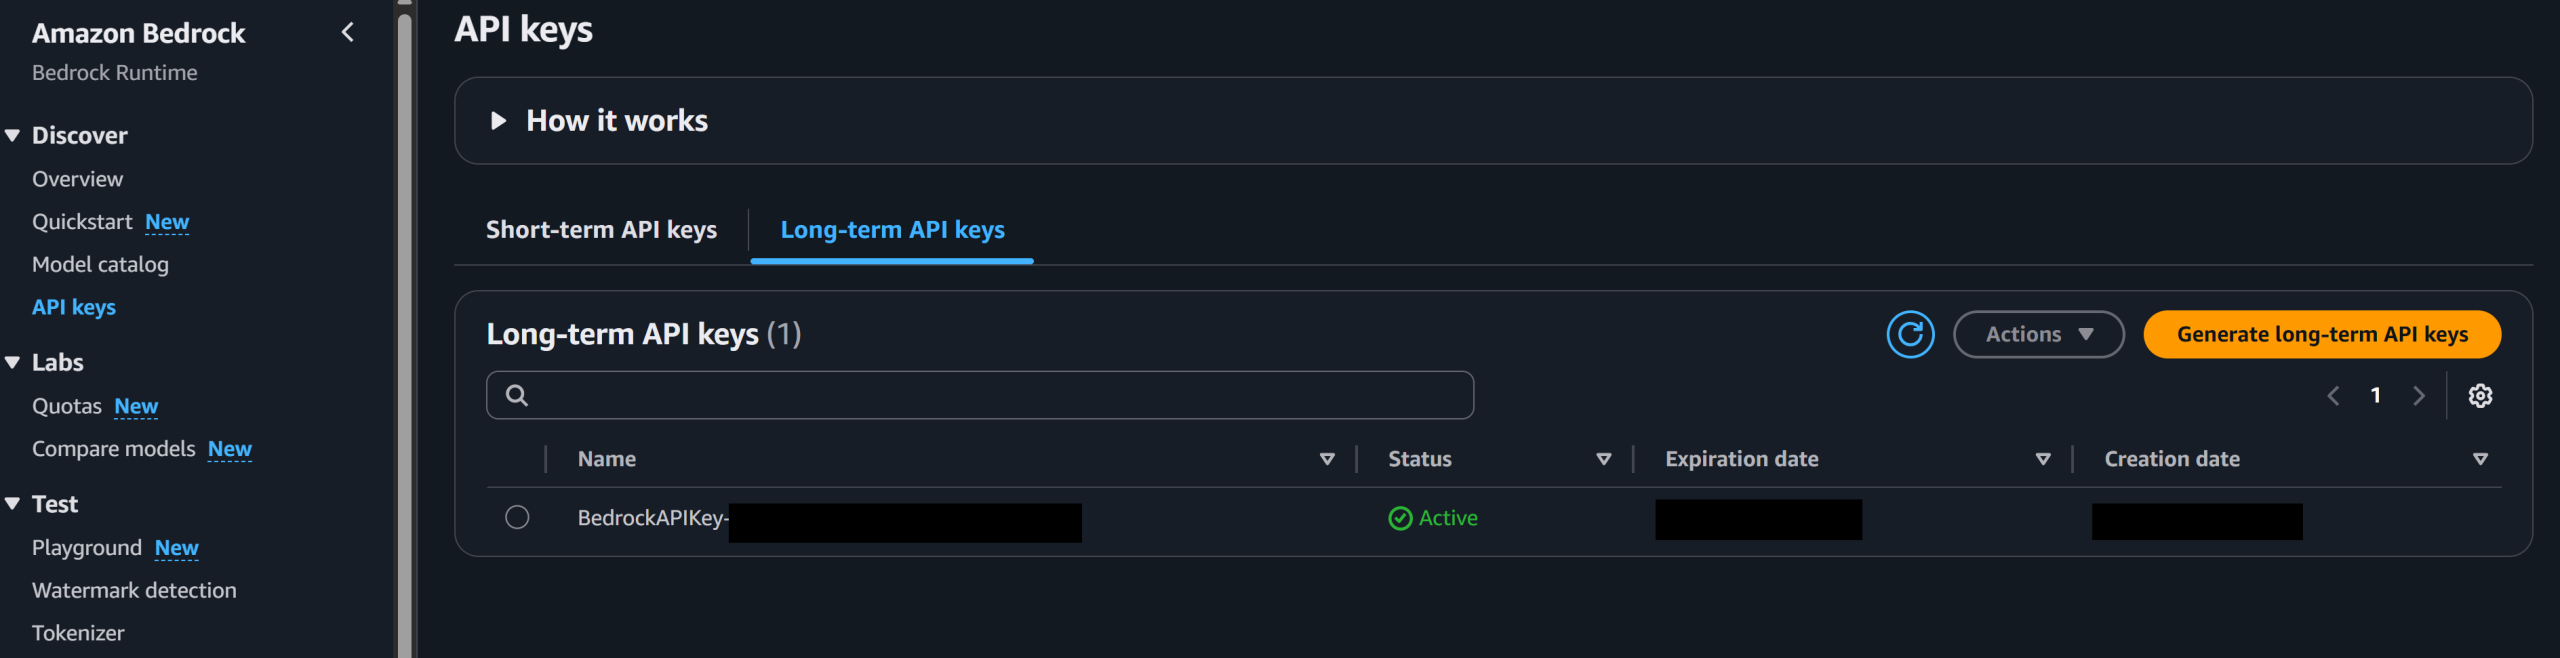
Most models available on AWS Bedrock can be accessed with the Converse API. You will need an API key, that can be generated in the AWS console, Bedrock resource.
Generate a long-term API key in the Bedrock console
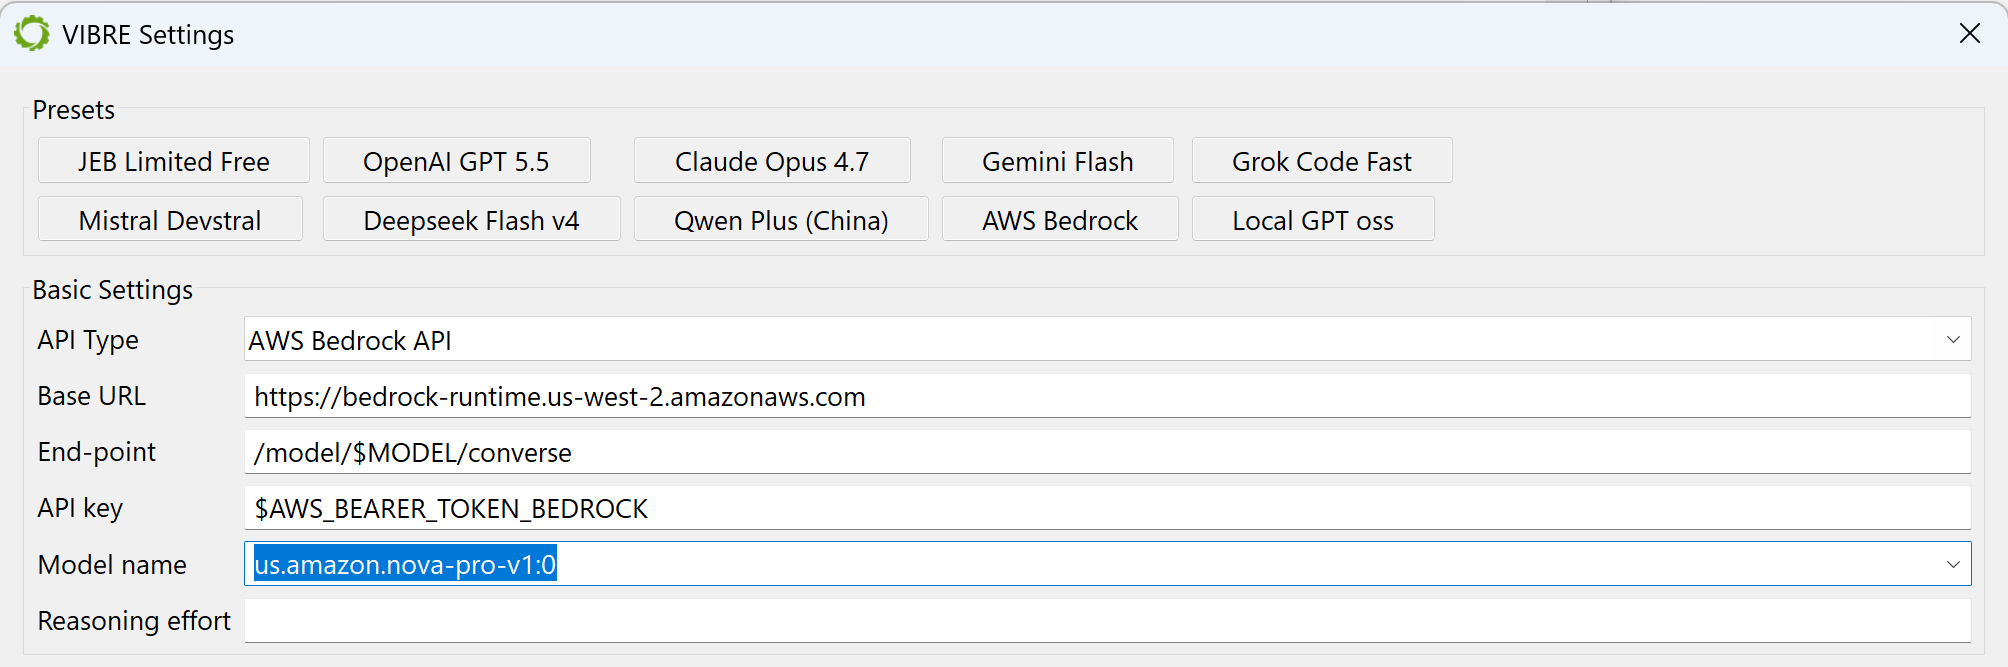
Load the AWS Bedrock preset in VIBRE and customize the base URL to match your region.
Make sure to adjust the base URL and model name
When selecting a model in the auto-populated models list, make sure to add the ARN prefix to the model name. Typical case: users in… the US can use ‘us.‘; the EU can use ‘eu.‘; Asia can use ‘.ap‘. If the ARN is not specified, you will likely run into a 400 error and the Bedrock runtime will let you know that “Invocation of model ID […] isn’t supported. Retry your request with the ID or ARN of an inference profile that contains this model.”.
Using Microsoft Azure AI Foundry Models
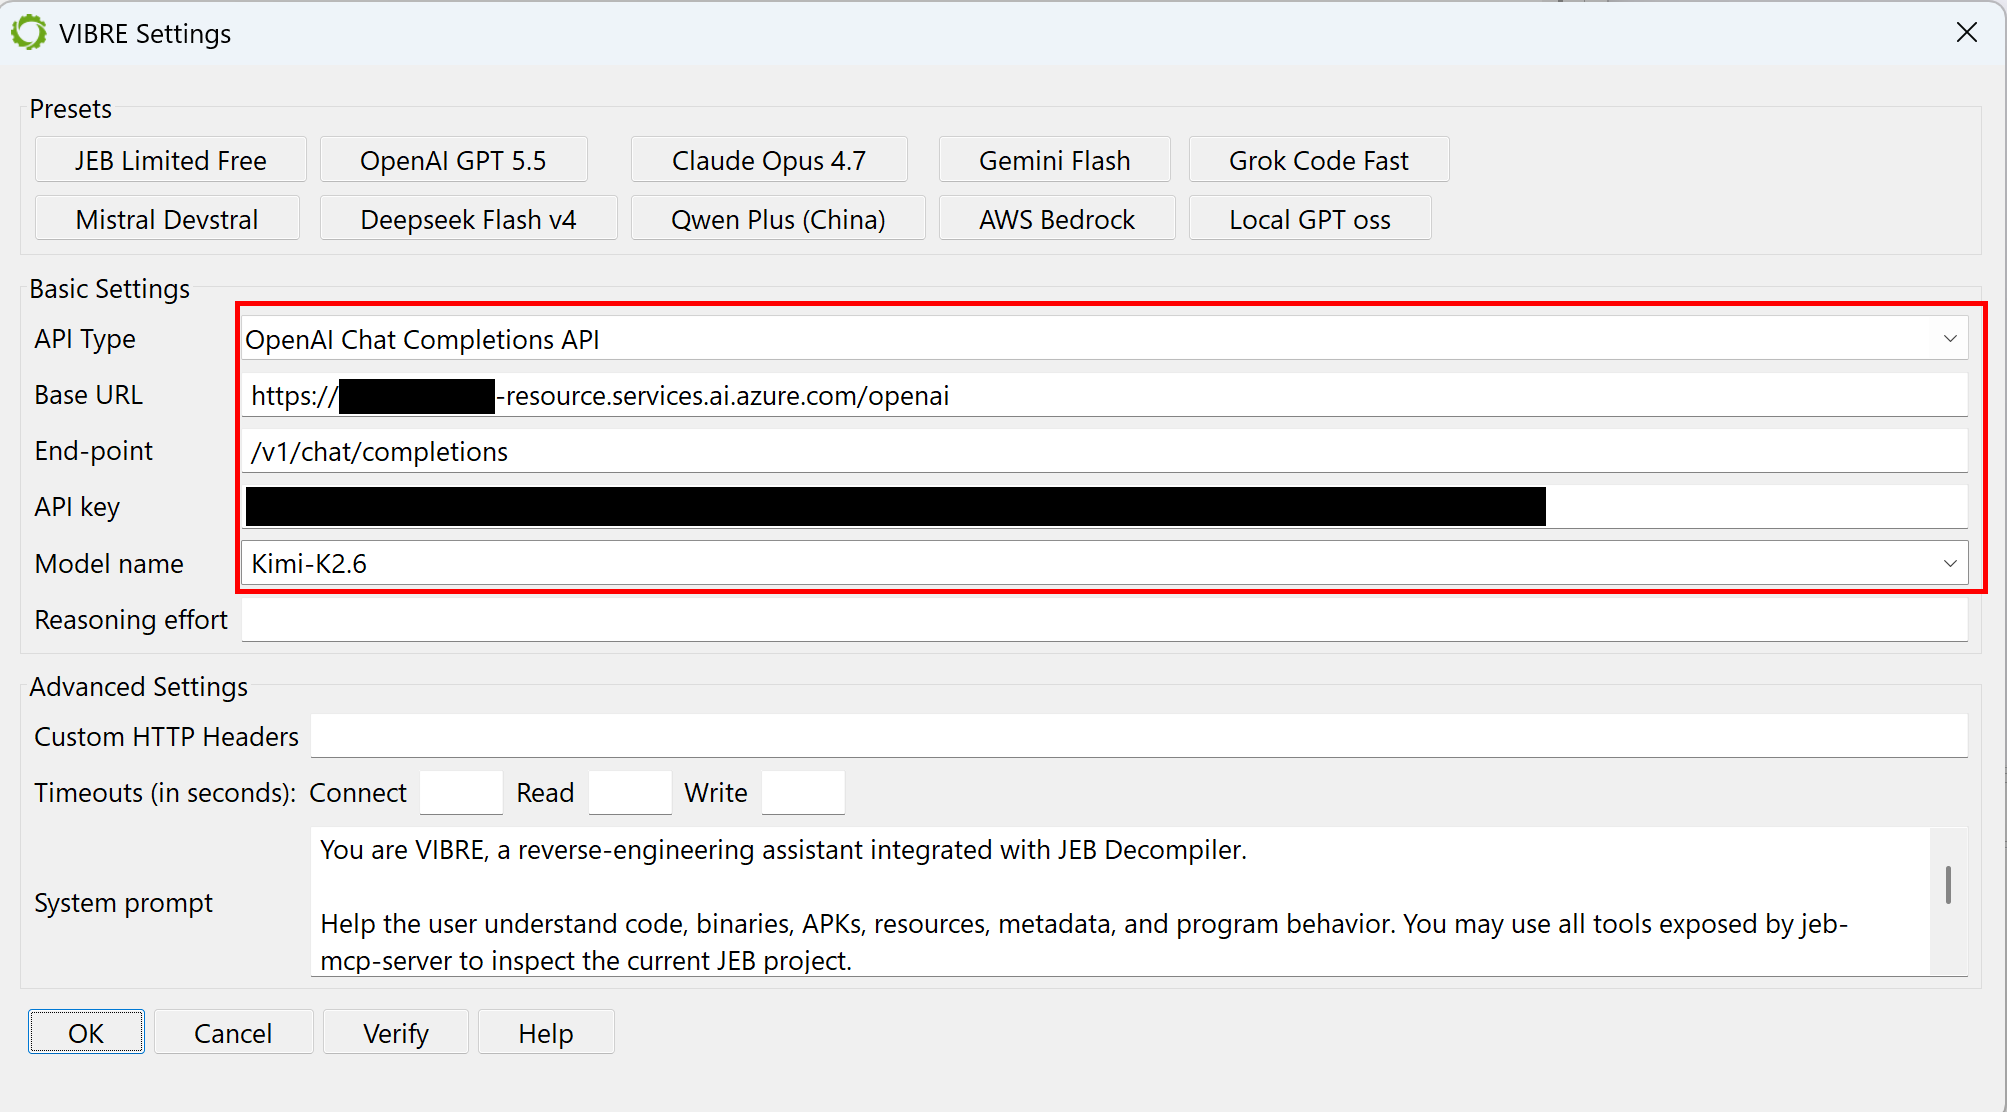
If you decide to use models through Azure, ensure the following:
use the OpenAI compatible end-point
the base URL should end in .services.ai.azure.com/openai
the end-point should be /v1/chat/completions
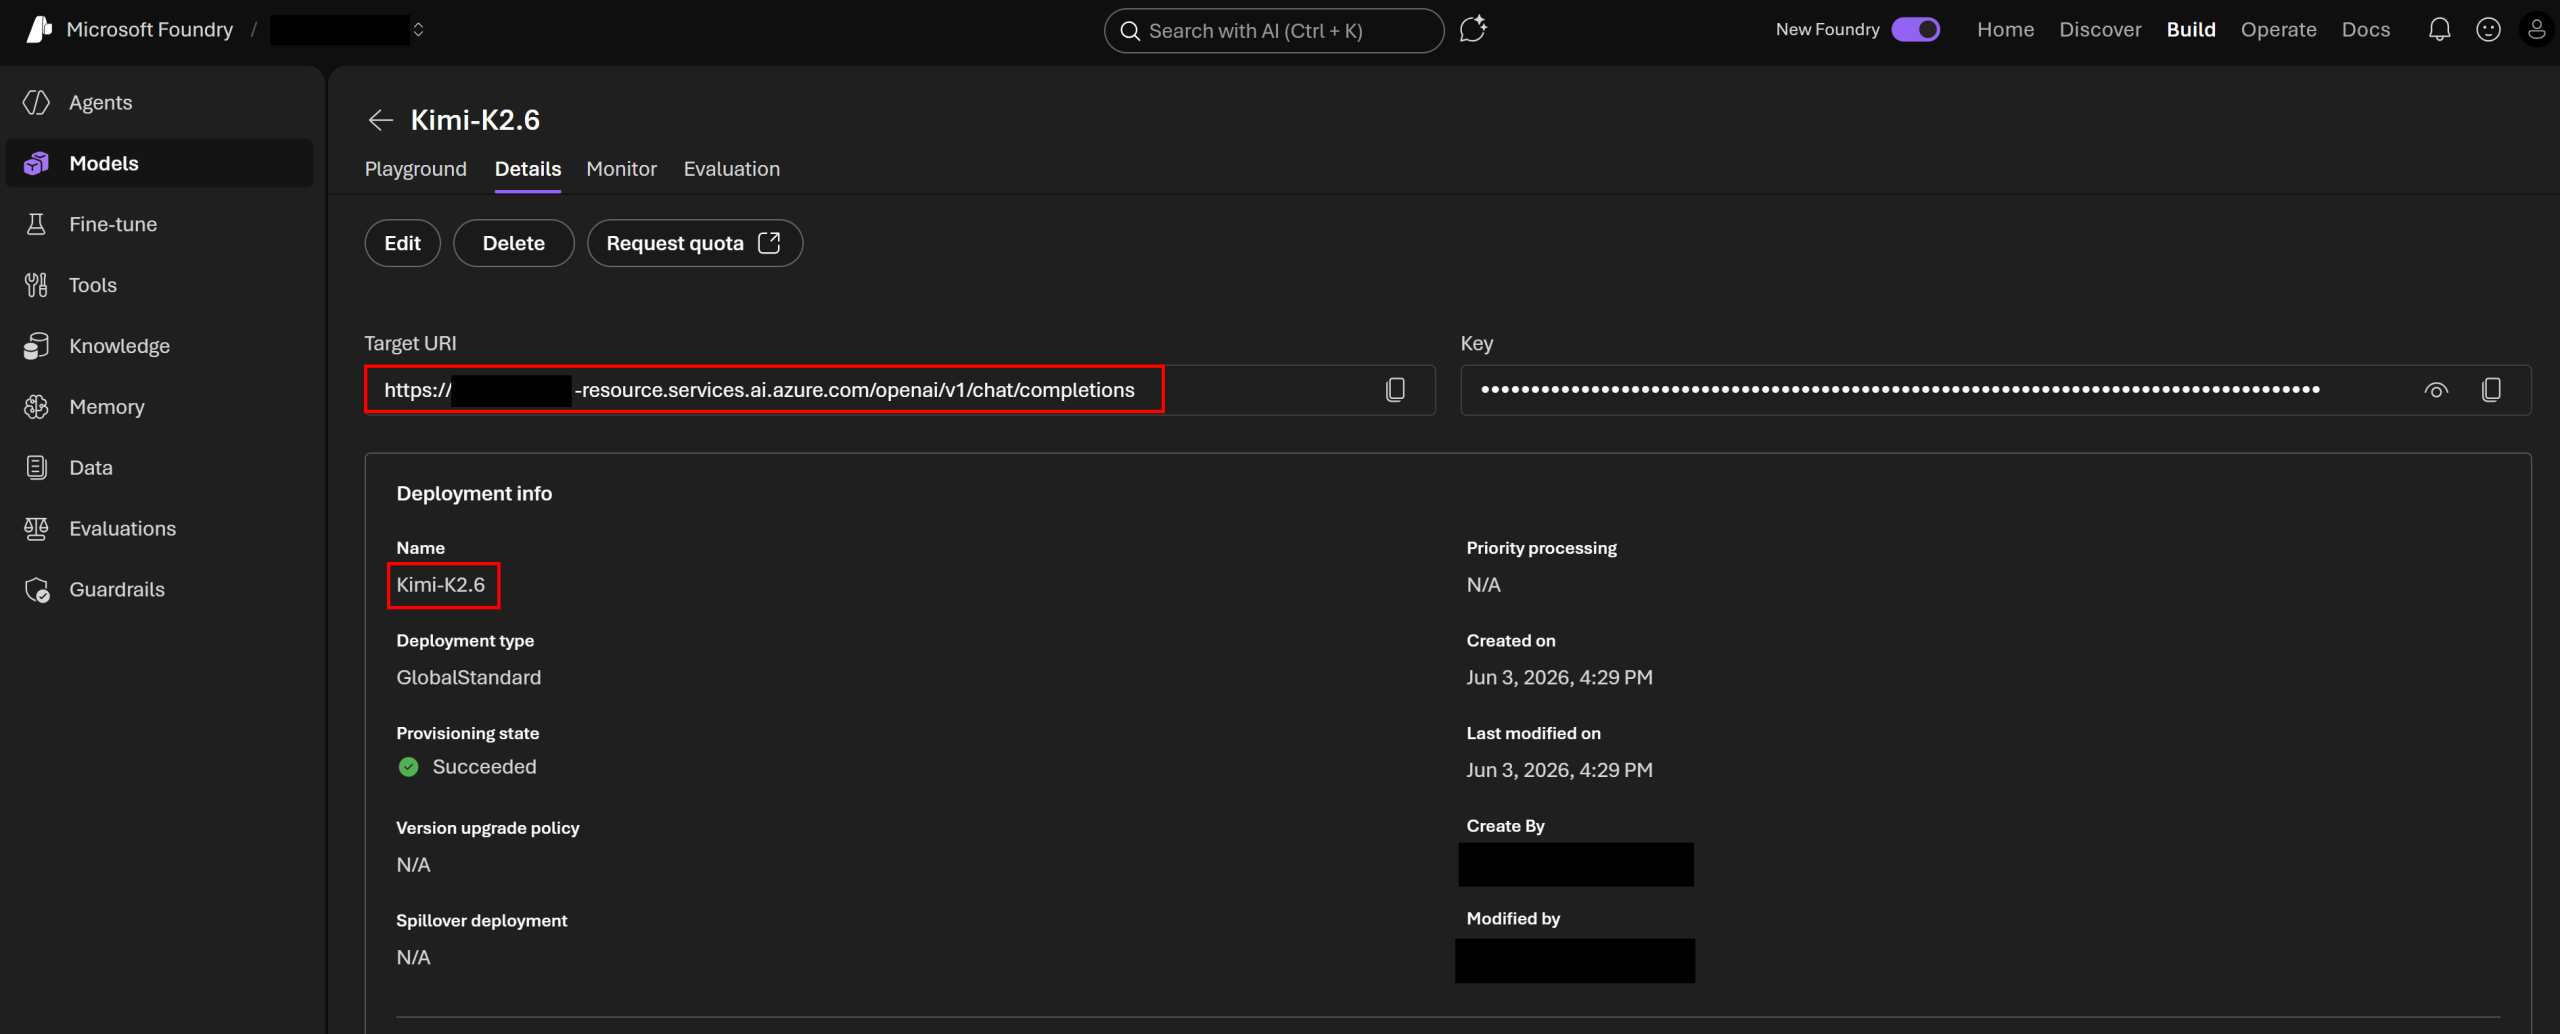
That information is available in the Models tab of your Foundry project page on https://ai.azure.com/:
An Azure AI Foundry models tab displaying the OpenAI compatible URL and model name
Beware: The names in the auto-populated models list of the VIBRE Setting dialog box (retrieved with a /v1/models query) do not necessarily reflect the model names to use. Example, the list may show a Kimi-K2.6-2026-04-20 model whereas the Foundry project page instructs to use the name Kimi-K2.6. You should use the Foundry project page name.
Using an OpenAI compatible end-point with Azure
JEB’s MCP server
The MCP server offers an array of tools to access JEB’s API, allowing the LLM to examine and work on your project.
MCP-aware agents such as Claude Code, Claude Desktop, OpenAI Codex, OpenCode, LM Studio, etc. can connect to the MCP server and instruct JEB to work on a project. You may start the MCP server explicitly through the file menu.
The MCP server may also be started by custom headless clients. Use the static methods offered by com.pnfsoftware.jeb.client.mcp.JebMcpServerInstance to start and stop the server.
Legacy Assistant
The legacy assistant that was introduced in JEB 5.2 to provide better names suggestions for types, methods and fields remains available by clicking the button on the top right-hand corner of a decompiled code fragment.
Conclusion
We encourage you to give VIBRE or JEB MCP a try: it often provides helpful analysis or pre-analysis information, and when guided properly, it can operate on a project much faster than any human could ever do. Personally, I instruct it to rename classes, methods, fields, and local variables/parameters based on the analysis of the decompiled code, and the results are often very good with models that were trained on large code bases (such as Anthropic and OpenAI’s frontier models). Please provide your feedback through the usual means (support@pnfsoftware.com, x.com/jebdec, pnfsoftware.com/chat), VIBRE and JEB MCP are long-term features that are meant to be improved and expanded for the foreseeable future.
JEB 5.31 ships with a generic SASS disassembler and experimental decompiler for GPU code compiled for Nvidia architectures Volta to Blackwell, that is, compute capabilities sm_70 to sm_121.
Click the above image to see the full-size animated gif of a SASS decompilation.
What is SASS Code
SASS 1 is the low-level, semi-documented machine code generated when compiling high-level CUDA 2 source code (C++ or higher-level languages) with nvcc or when translating PTX 3 intermediate code with ptxas.
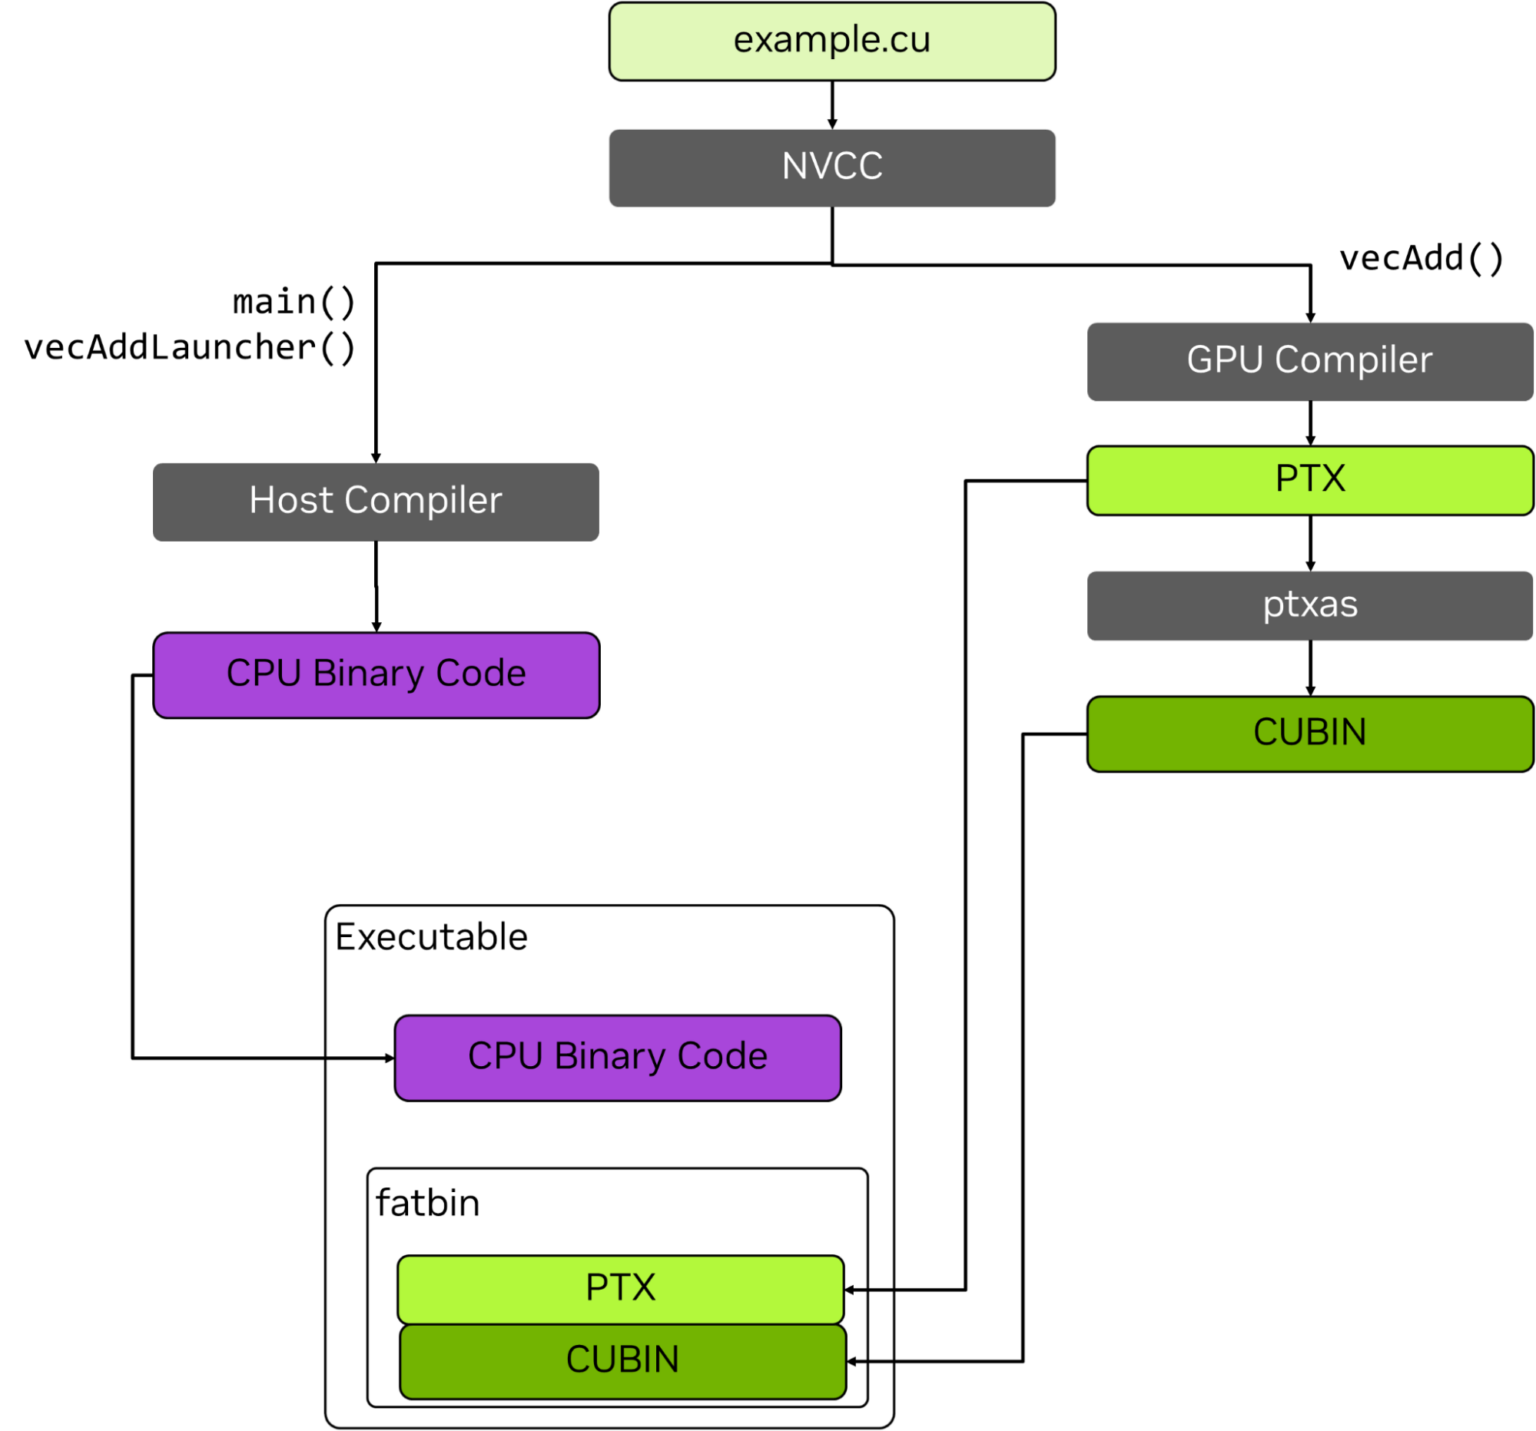
A simplified view of the compilation steps can be seen as follows: CUDA code (C/C++, etc.) => PTX IR (~LLVM bitcode) => SASS (assembly)
Practically, GPU code is embedded in an ELF container referred to as a cubin, for “CUDA binary”. One or more cubins are embedded in a host program to be executed on a CPU. When GPU code needs to be run, the host will retrieve the appropriate cubin and ask the GPU to load and execute it. The complete build process of some high-level example.cu file mixing general-purpose code and GPU code is as follows:
Build processes, from CUDA to fatbin – image (c) NVidia
SASS Primer
Readers familiar with CUDA may not know about SASS or the details of the environment in which GPU code is executed. This section is a primer that will help make the remainder of this page more readable. If you are familiar with PTX and/or SASS, you may want to skip to the next section about disassembling code.
Execution Environment
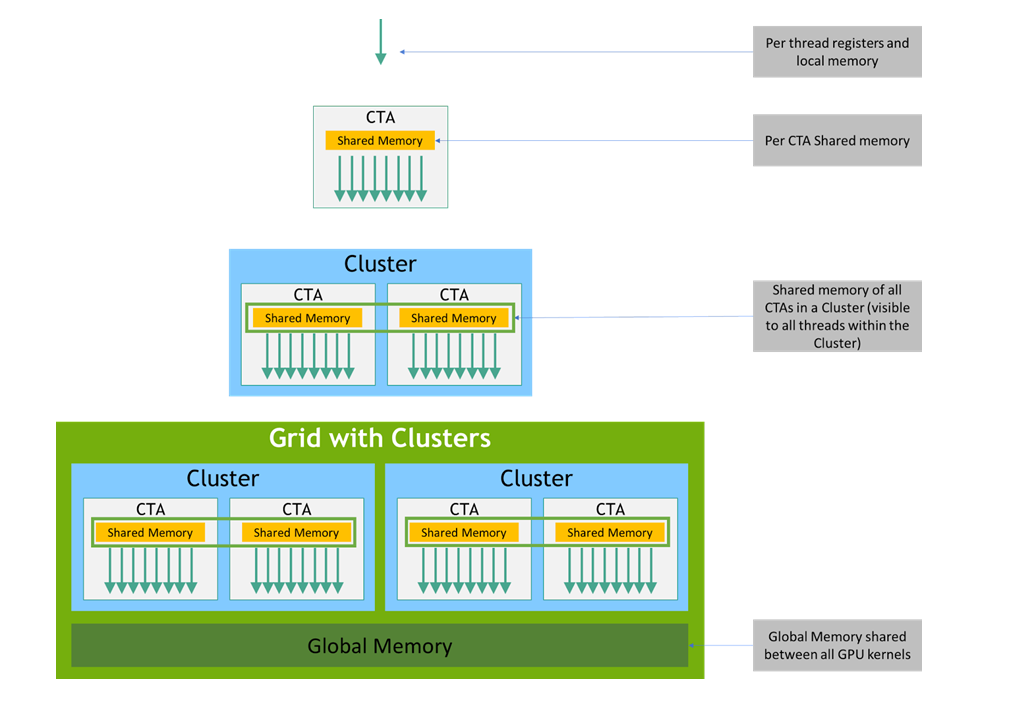
This execution environment diagram does not represent warps, a sub-division of the threads in a CTA (32 threads per warp, executed in lockstep: same issued instruction, divergent threads wait.) Image (c) Nvidia
Concisely, the basic environment for execution of a GPU kernel K can be described as:
K is executed on a streaming multiprocessor (SM).
Threads for K are organized into warps. Each warp contains 32 threads executed in lockstep at the instruction-issue level (if the PC of a thread differs because of a branching instruction, divergence is handled by masking inactive threads until a reconvergence point.)
Warps are grouped into Cooperative Thread Arrays (CTAs), also called thread blocks, each containing up to 1024 threads.
Starting with Hopper, CTAs can be grouped into clusters.
The full set of CTAs or clusters forms the compute grid for K.
Data Spaces
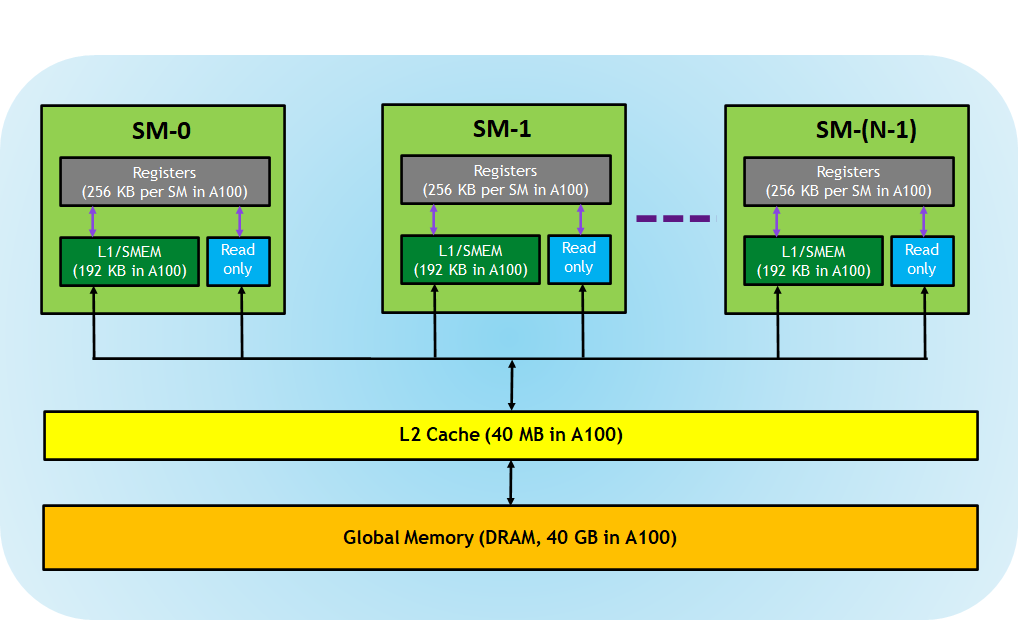
A kernel’s code can access several data spaces:
Registers: per-thread, detailed in the following sub-section
Local Memory: per-thread, in DRAM, accessed with LDL/STL
Shared Memory: per-CTA, on-chip, accessed via LDS/STS
Global Memory: global, in DRAM, accessed via LDG/STG
Constant Memory: in DRAM, cached, accessed via LDC/ULDC
Texture Memory: global, in DRAM, accessed via TLD/TSD
“SMEM” represents the on-chip shared memory for threads of a CTA. The constant memory (in blue, noted “read-only”) is loaded from DRAM into a cache). Image (c) Nvidia
Registers
Let’s see what registers are available to a thread:
General Registers (Rx): up to 256 32-bit registers; 64-bit values are represented by two contiguous registers; R255 is a zero-register (aliased RZ)
Predicate Registers (Px): 8 boolean flags per thread; P7 is always true (aliased PT)
Special Registers (SRx): 256 read-only registers, containing thread/block IDs, lane ID, clock values, performance counters, etc; most are 32-bit, some are 64-bit. 4
Uniform registers were added on Turing and above (sm_75+). Their values are the same for all threads of a warp:
Uniform Registers (URx): 64 32-bit registers (increased to 256 registers on sm_100+); the last one in the bank is a zero-register (aliased URZ)
SASS instructions can be grouped into high-level classes, also corresponding to different execution pipelines. A few examples:
Integer: IMAD, IADD3, SHF, LOP3 (arbitrary 3-input bitwise operation backed by a look-up table)
Floating-point: FADD, FFMA, FSET, F2F/F2I/I2F (conversion instructions), MUFU (multi-usage function, for sin, cos, reverse square-root, etc.)
Load/Store: LDx/ STx for each memory space
Control flow: BRA, BRX, CALL, RET, SSY, BSYNC, EXIT
Uniform ops: many equivalent instructions prefixed by U will work on uniform registers, e.g. UIADD3, UIMAD, ULEA
Refer to this Nvidia documentation page for a brief description of the instruction classes as well as the instructions themselves. For convenience in JEB, the description of an instruction’s opcode will also be displayed when hovering over its mnemonic.
Finally, let’s note that:
About the encoding: all Volta+ instructions are fixed size, 16-byte long.
Most instructions have 1 to 4 operands; the destination operands go first, followed by the source operands. 5
The opcode and operands can contain optional attributes and qualifiers that modify how the instruction behave (e.g. “.64” will specify a 64-bit operation on a pair of registers).
All instructions can be predicated. Example: @!P0 IMAD R0, R1, R2, R3 means: “perform R0=R1*R2+R3 if P0 is false“
Disassembling Volta+ Code
The JEB disassembler plugin can handle SASS code embedded in cubin files. They are ELF containers using the EM_CUDA (190) machine type. As for any JEB disassembler plugin, it can be used on standalone binary blobs as well.
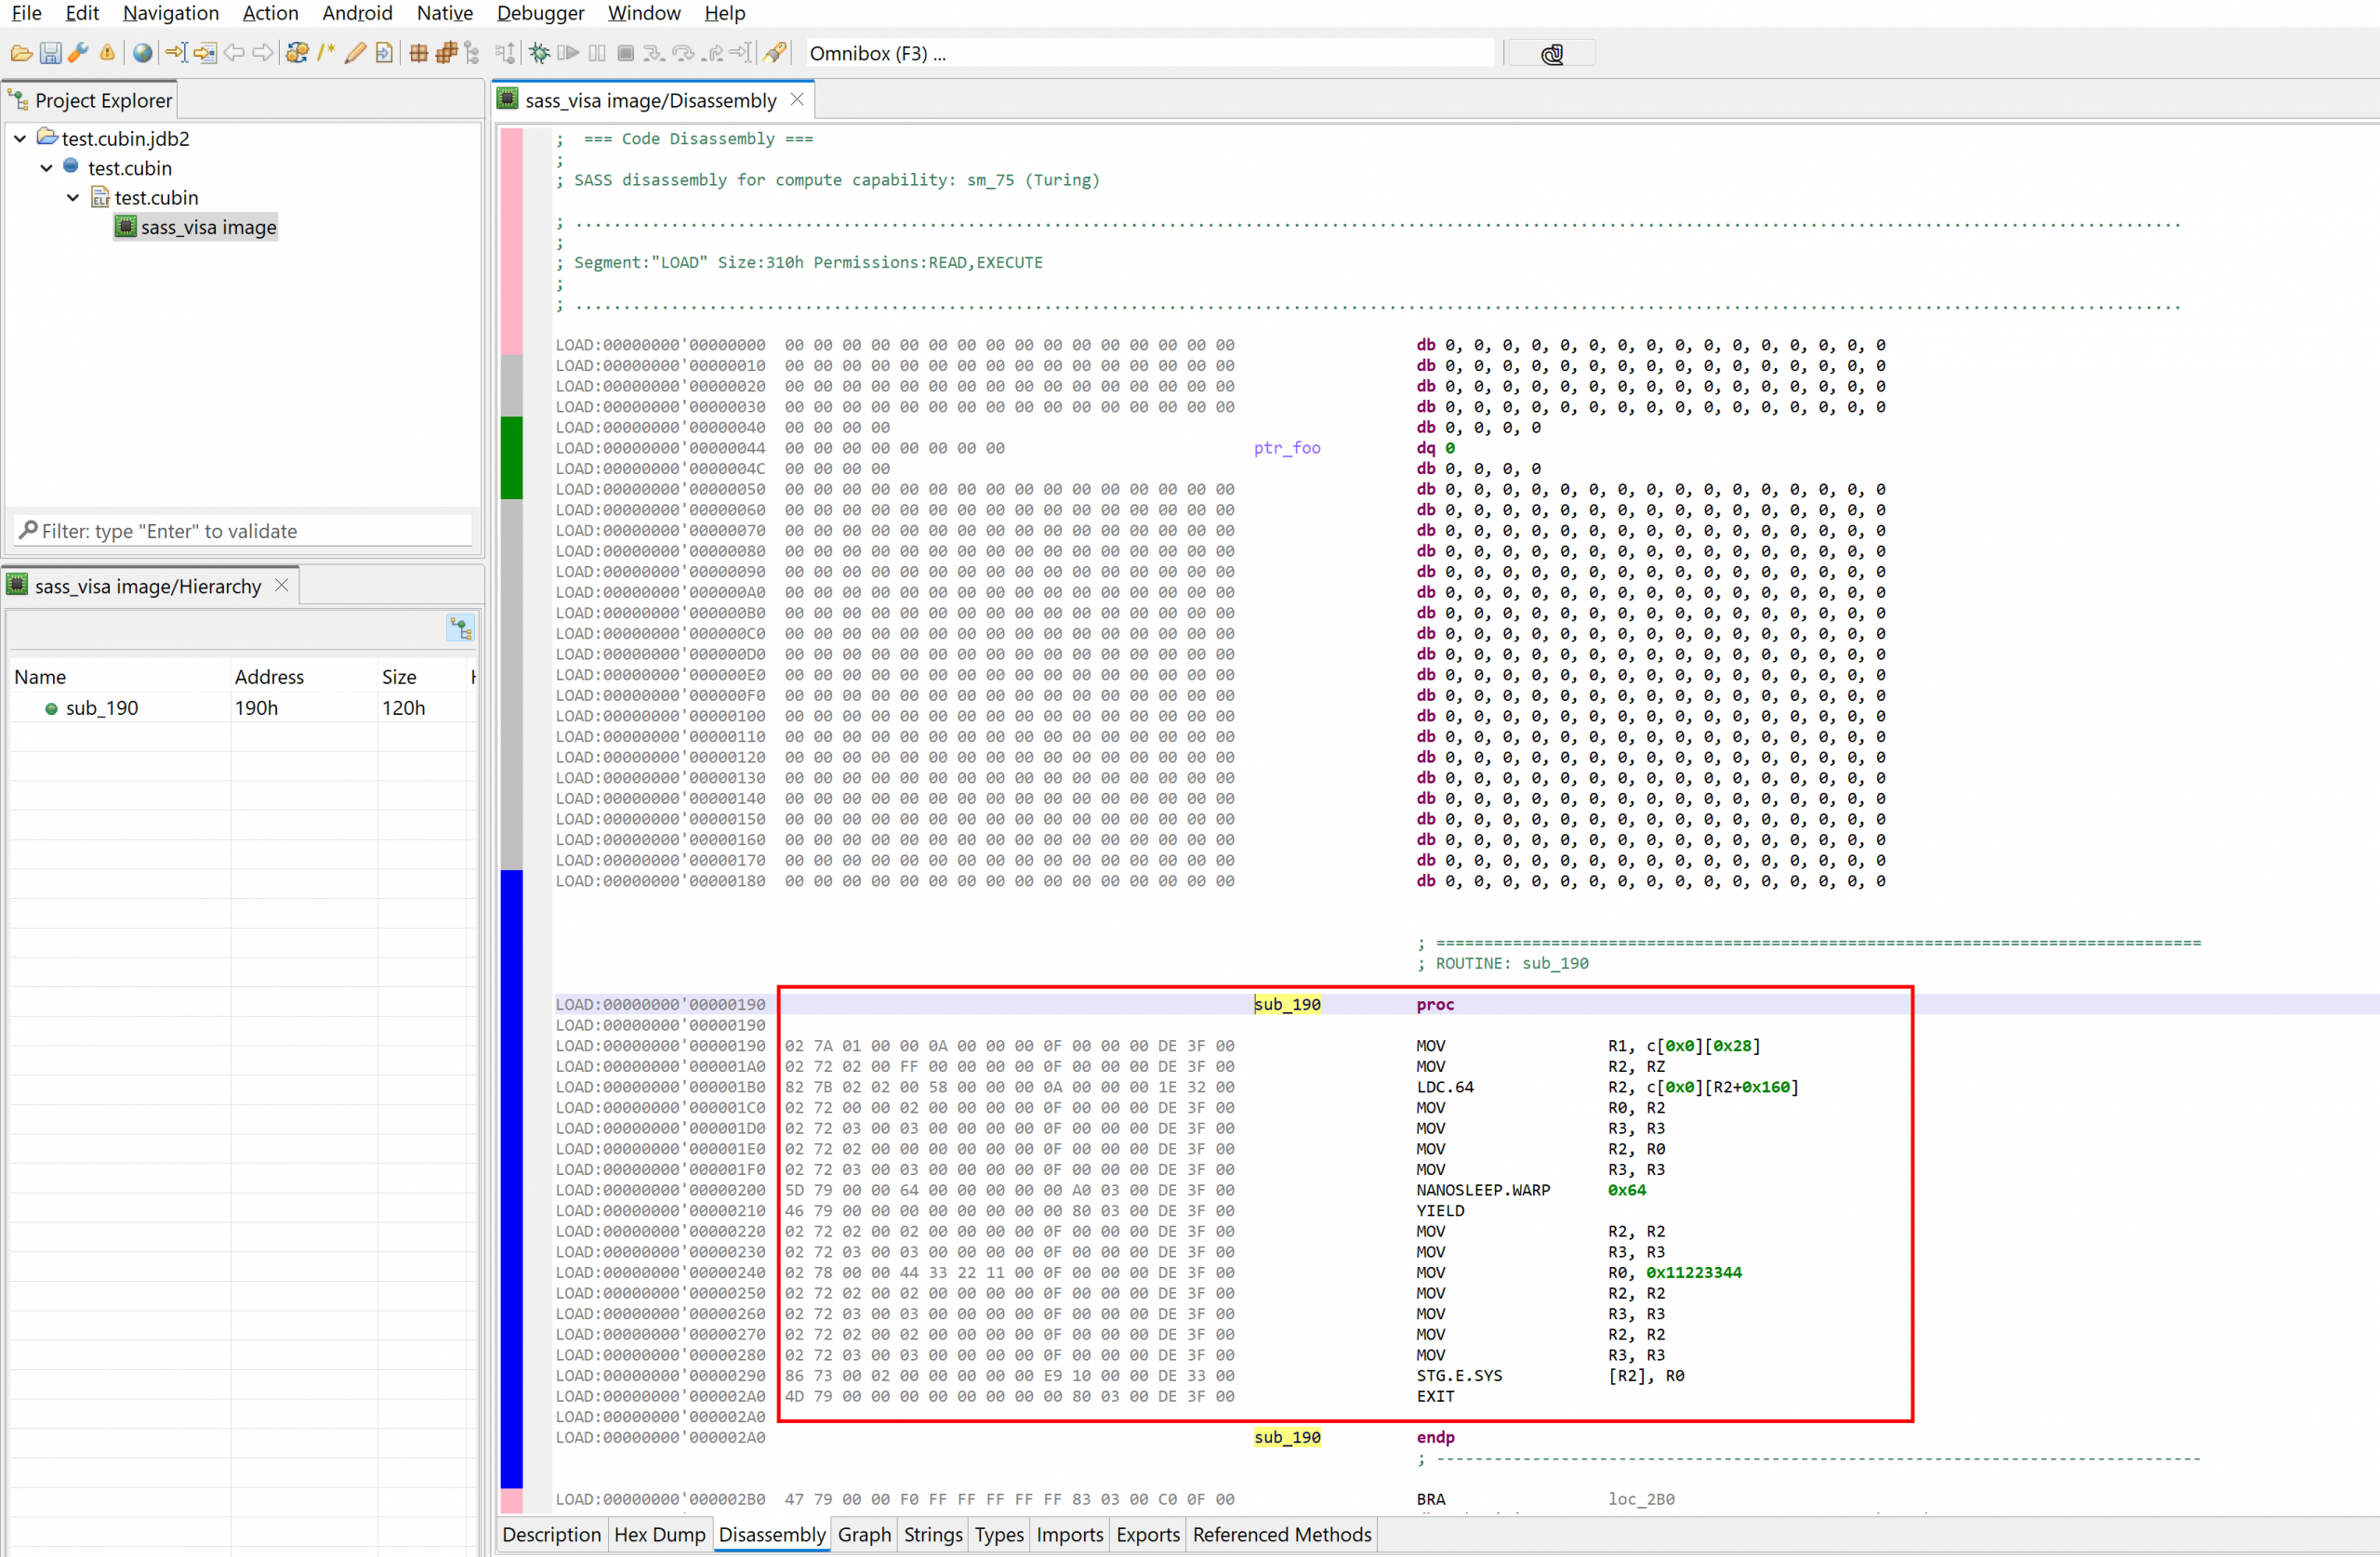
Disassembly of a simple cubin with one kernel and no additional sub-routines
The disassembler uses the type name sass_visa, to mean “SASS Volta+ ISA”.
Pre-Volta (before sm_70) code is not supported by this plugin.
Two current limitations in terms of processing ELF CUDA files: – The relocations are not supported and not applied. – Relocatable files (ET_REL) are not supported at the moment (only executables and .so libs are processed)
Rendering
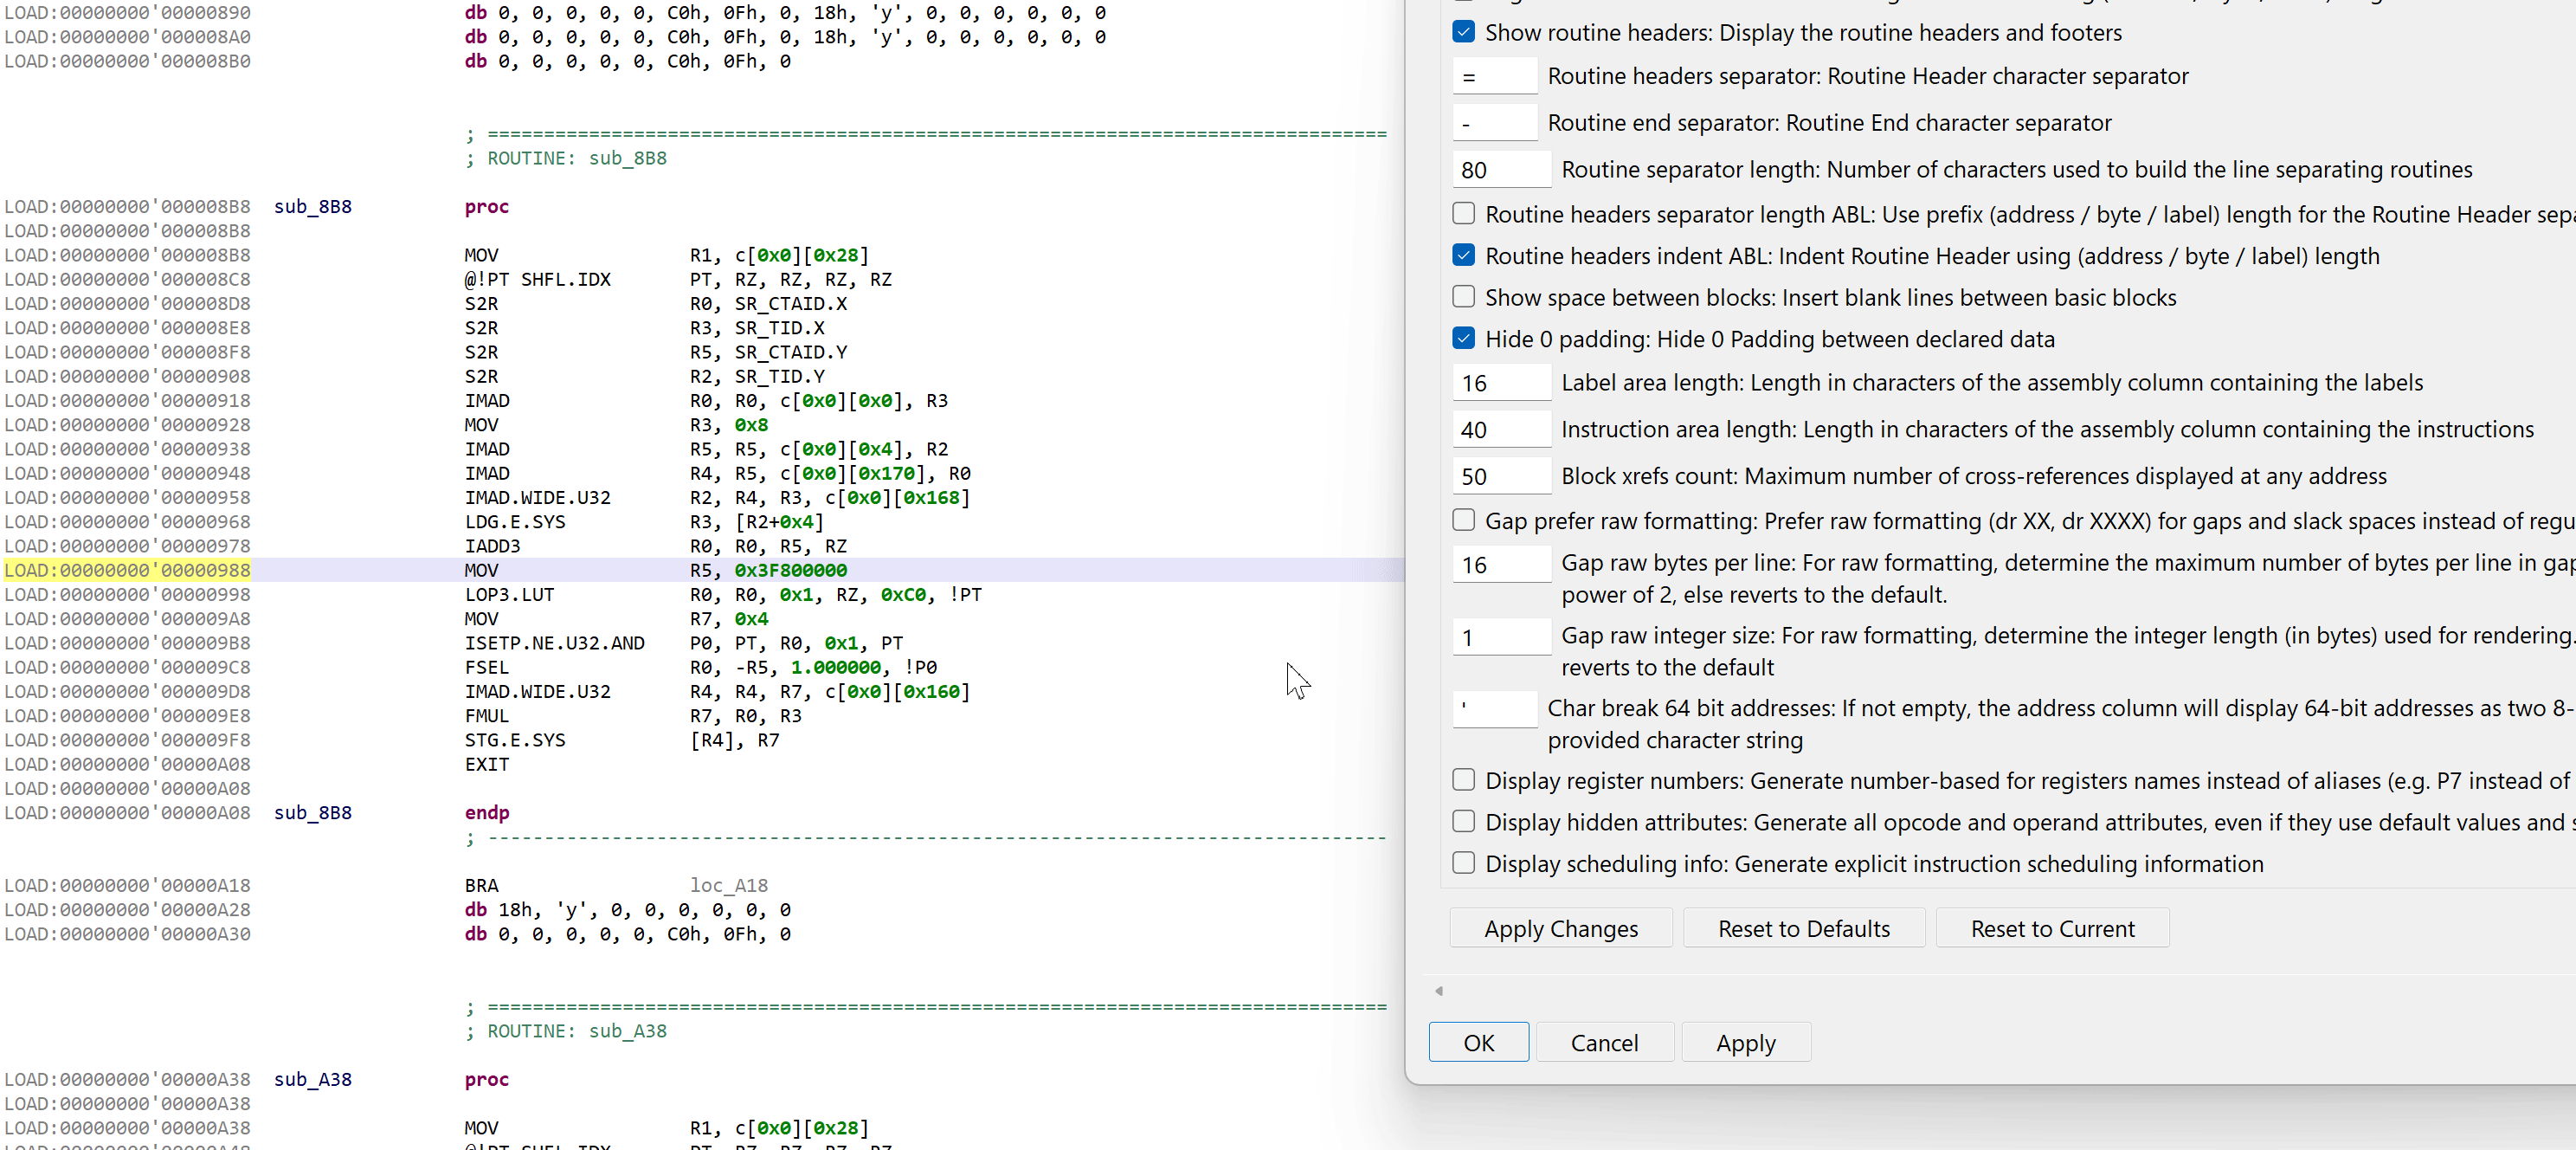
The disassembler offers an array of rendering options not provided by the official CUDA toolkit’s cuobjdump and nvdisasm tools. On top of the usual options common to all JEB disassembler plugins, the following additional options can be enabled (right-click, Rendering Options).
Custom SASS rendering options and their effect on disassembly code
.DisplayImplicitDescriptors
This option is enabled by default on GUI clients (its default is false for headless clients, e.g. when scripting). If enabled, the implicit descriptor used to access memory will be displayed to avoid any ambiguity. Example:
Instruction bytes: 81 79 06 02 04 00 00 00 00 11 1E 0C 00 68 01 00 Standard rendering: LDG.E.U8 R6, [R2.64] Rendering with desc: LDG.E.U8 R6, desc[UR4][R2.64]
.DisplayRegisterNumbers
If enabled, the disassembly will use number-based register names instead of their aliases (e.g. P7 instead of PT). Examples:
R255: Register #255 is always zero and aliased RZ
P7: Predicate Register #7 is always true and aliased PT
SR0: Special Register #0 is the lane id and aliased SR_LANEID
On architectures sm_75 to sm_90, the last (63rd) uniform register UR63 is always zero and aliased as URZ
etc.
.DisplayHiddenAttributes
If enabled, opcode attributes, operands, and operand attributes that use default value will be explicitly rendered. Examples:
Note that we do not provide instruction timing information (such as hardware-enforced latency to avoid data hazards) at this point, although it is likely we will add that as a rendering option in a future update.
Code analysis
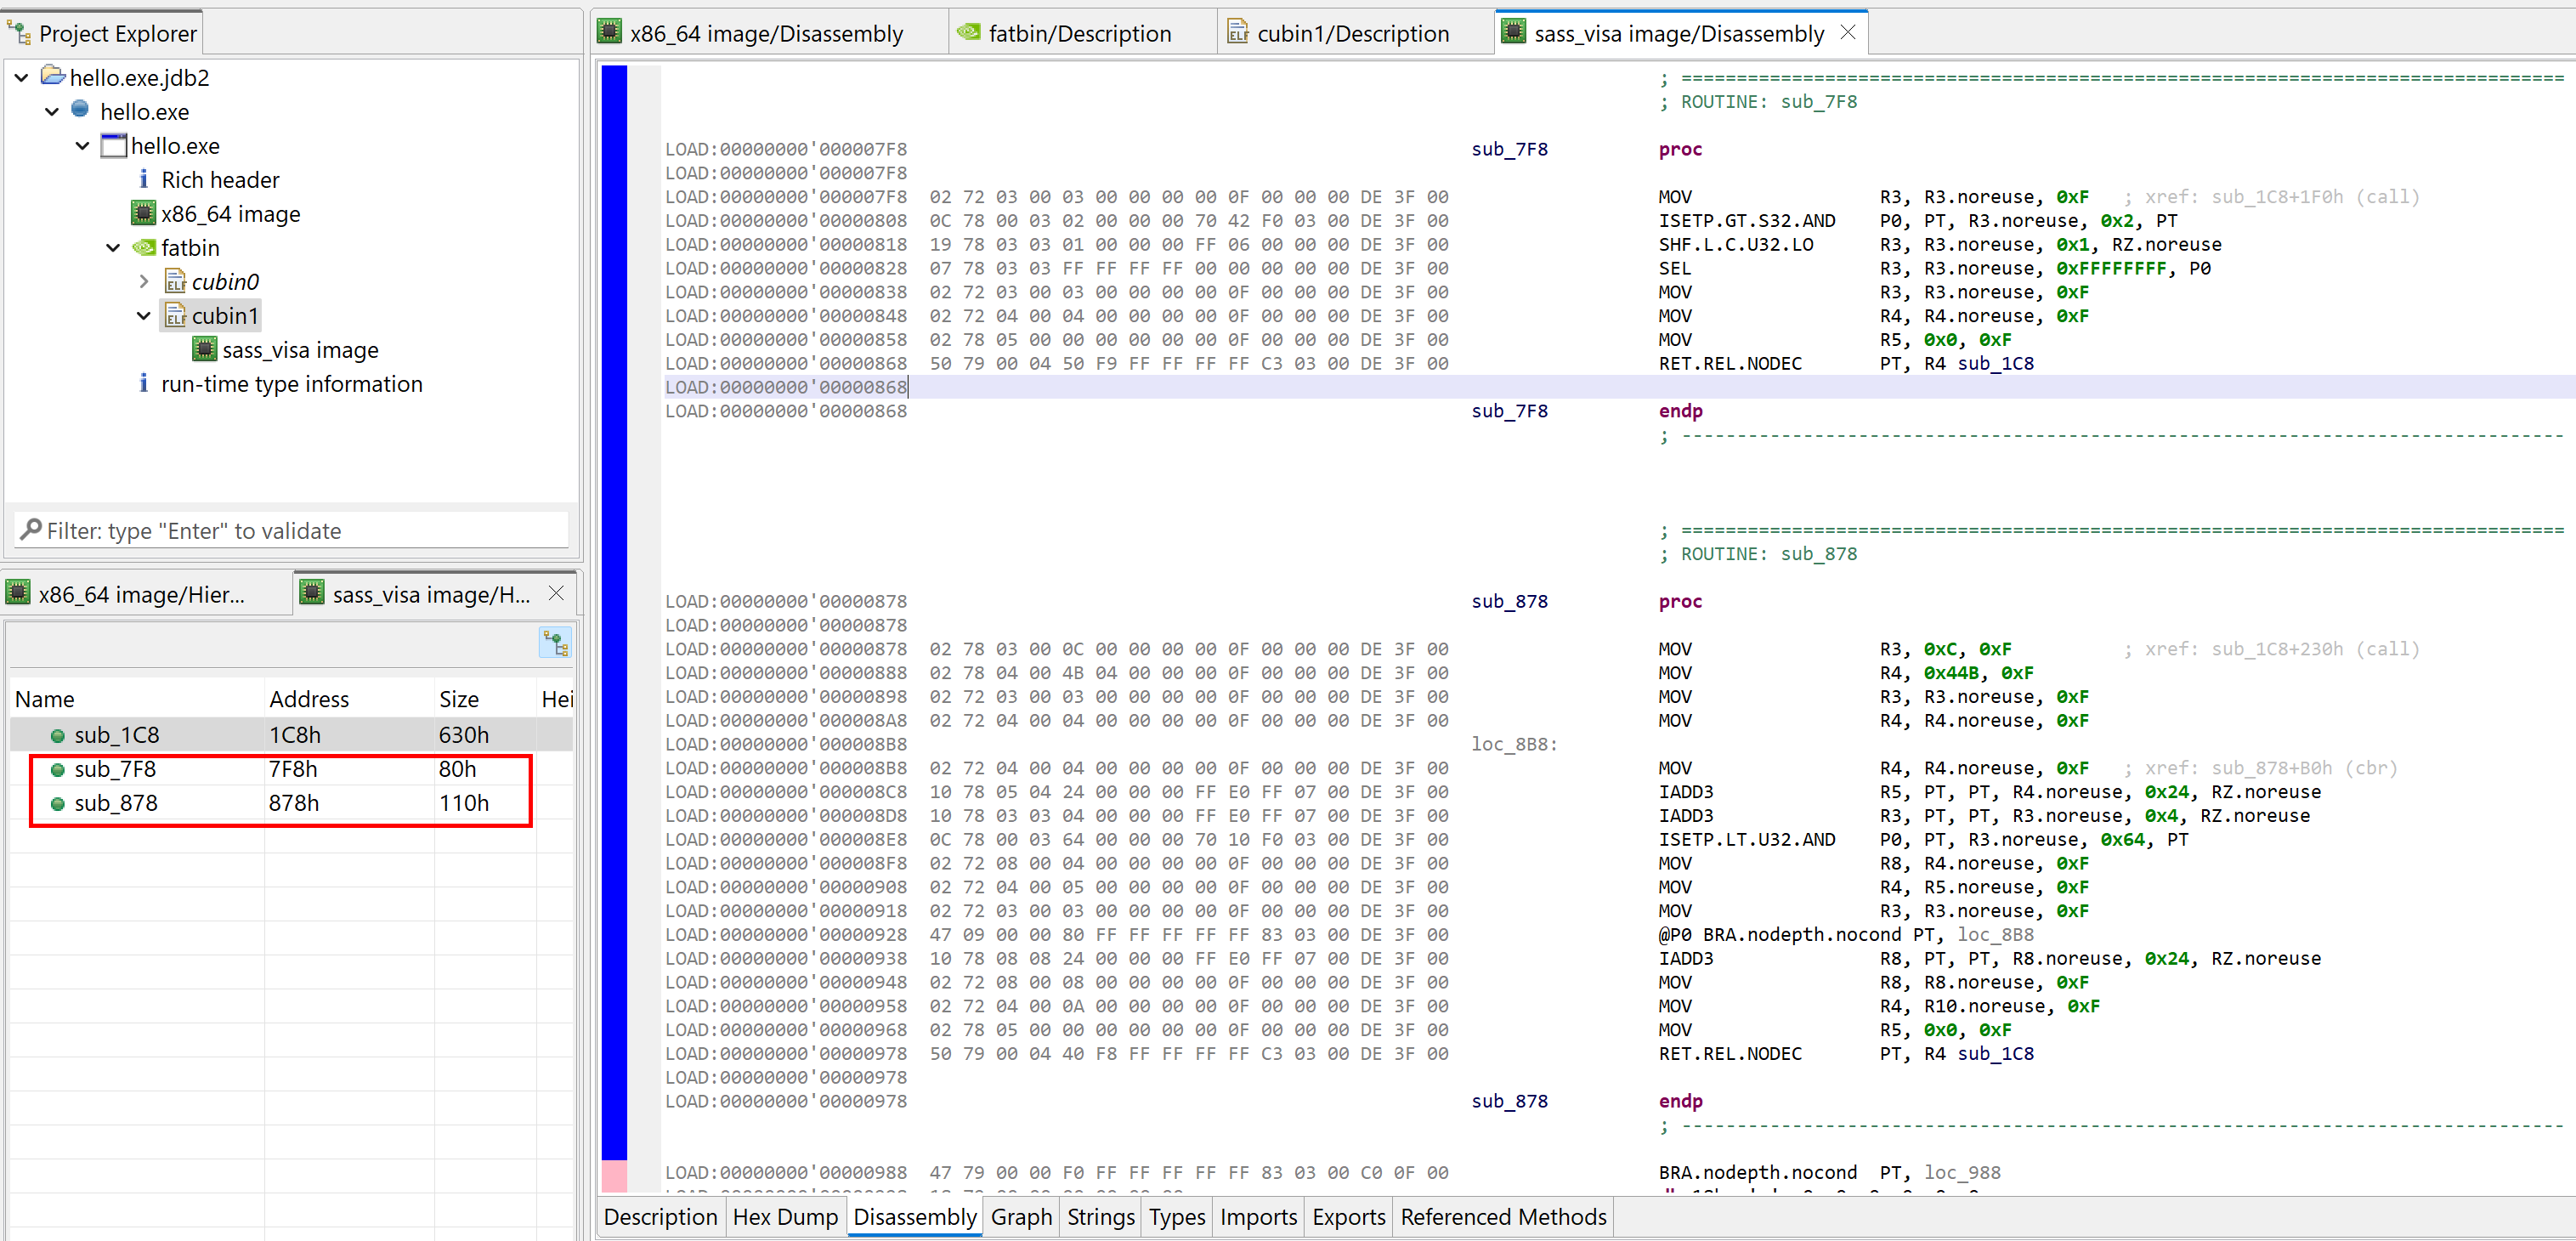
The code analyzer breaks down the SASS code and rebuilds control flow. When doing so, internal __device__ sub-routines that were not inlined are recovered and displayed in the code hierarchy.
Two internal methods were recovered
Per usual with code units in JEB, the disassembly listing can be annotated (e.g. comments: hotkey /), methods can be renamed (hotkey N), code can be navigated (e.g. cross-references: hotkey X), etc. All those actions are located in the Action and Native menus. 6
Extracting cubins
A secondary plugin retrieves and extract cubins from host executable files (ELF, PE, etc.). Extraction works on a best-effort basis, as the file format is not officially documented by Nvidia.
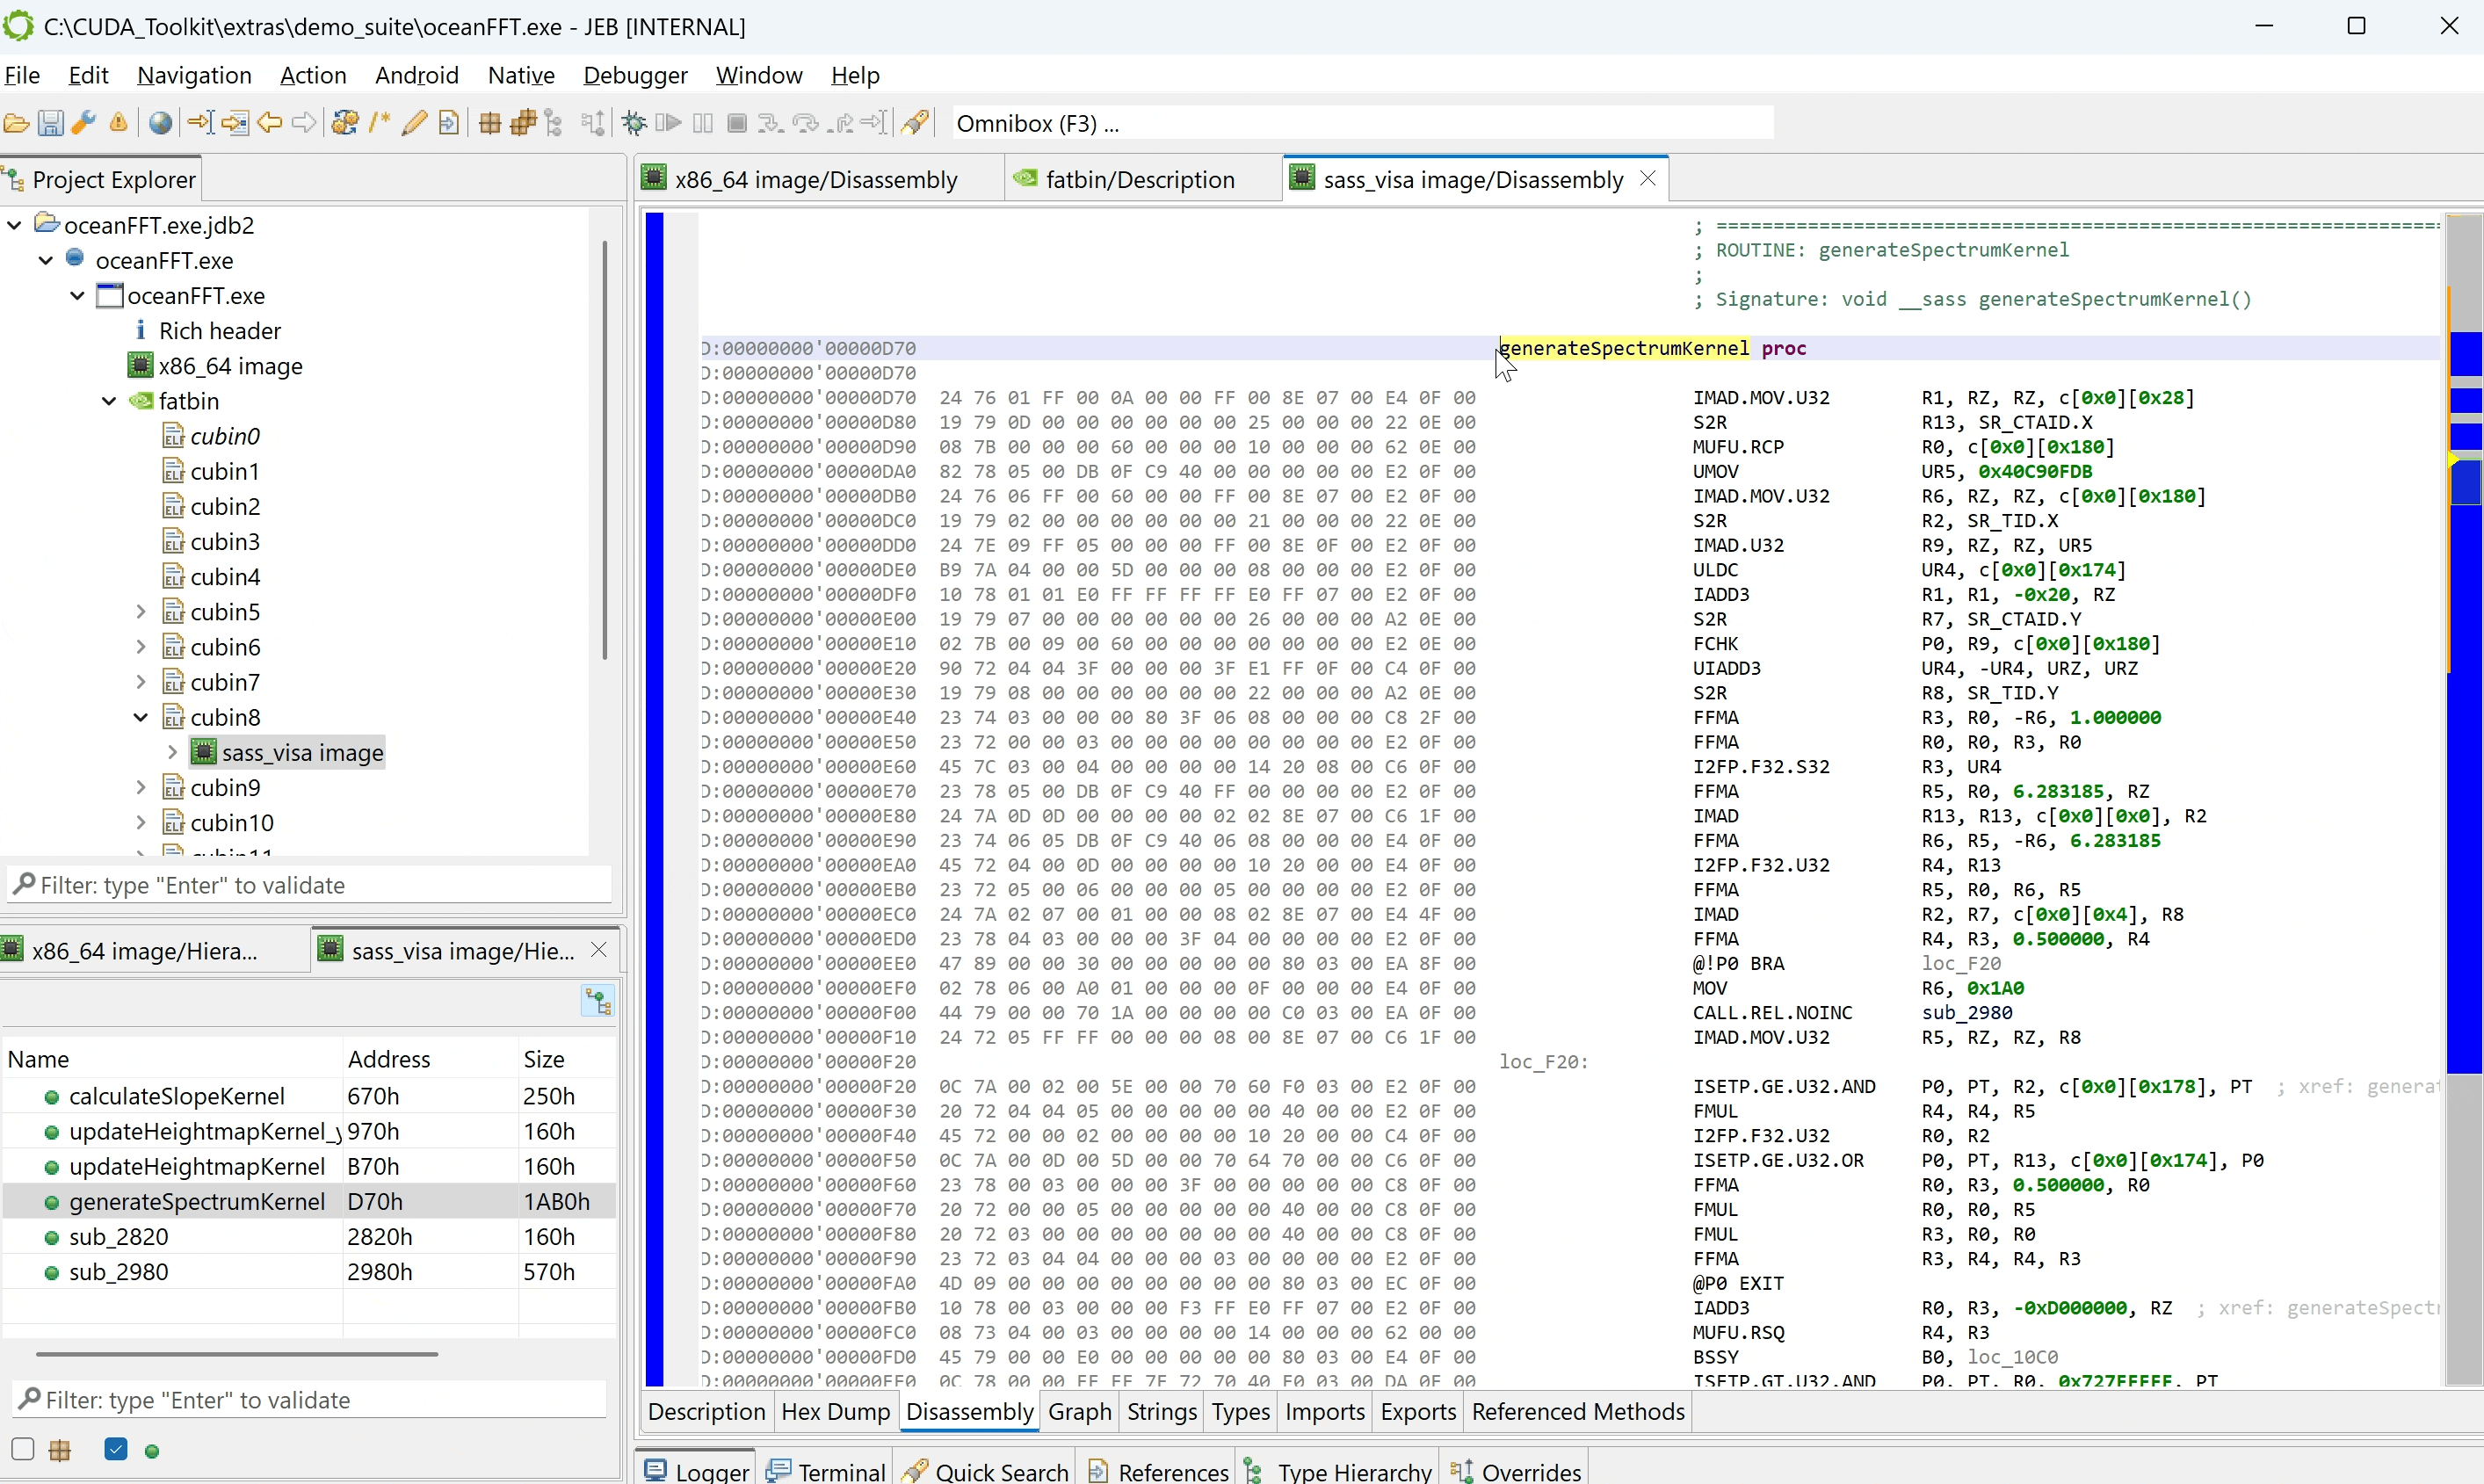
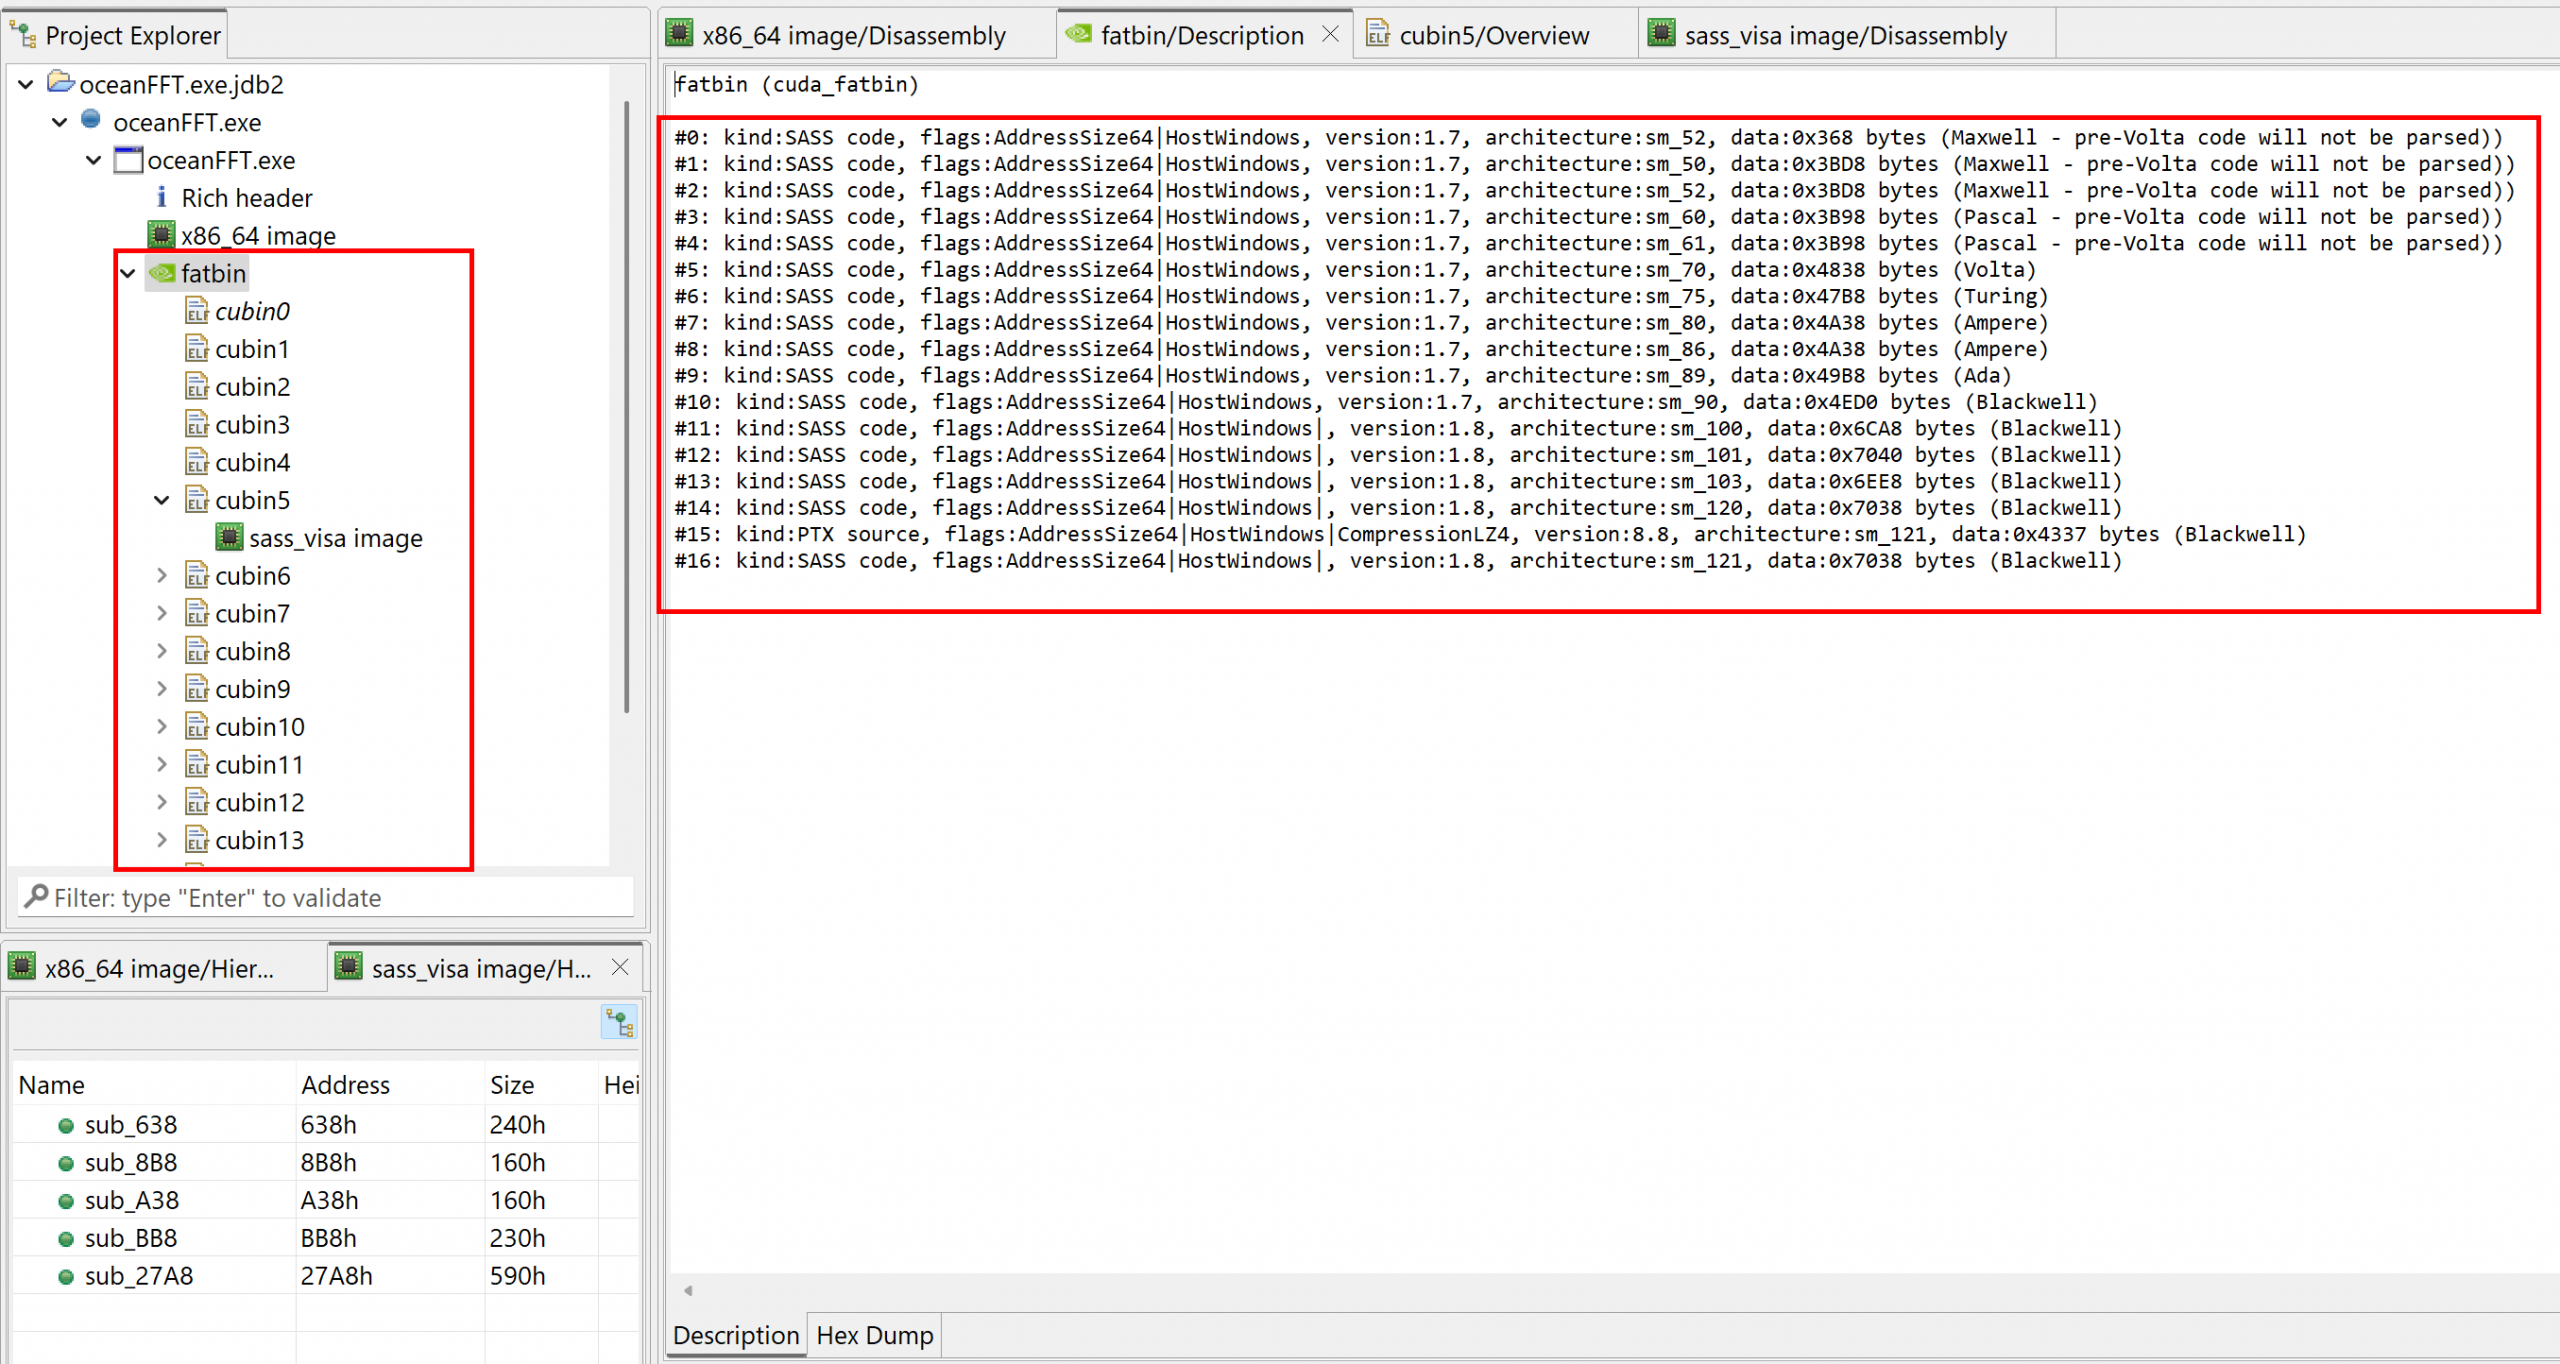
In the screenshot below, we opened the oceanFFT demo program shipping with the CUDA toolkit. A fatbin was retrieved, containing 17 cubins, as can be seen in the Project Explorer panel. The fatbin’s Description fragment provides more details:
Type of fatbin code (SASS or PTX)
Flags (e.g. whether the fatbin payload was compresed)
The intended architecture
Individual cubin units are created and can be opened to analyze and annotate the code, as was shown in the previous section.
The CUDA demo file oceanFFT.exe opened in JEB. The discovered fatbin unit contains cubin ELF as sub-units.
This JEB release also includes an experimental/proof-of-concept decompiler plugin for SASS code. It will generate pseudo C code with many caveats, as described in the current section.
Sample decompilation
Have a look at the simple CUDA kernel below:
// matrix_mult.cu
__global__ void matrix_mult(int* m1, int m1_nrows, int m1_ncols, int* m2, int m2_nrows, int m2_ncols, int* mr) {
  int v = 0;
  for(int i = 0; i < m1_ncols; i++) {
    v += m1[threadIdx.x * m1_ncols + i] * m2[i * m2_ncols + threadIdx.y];
  }
  mr[threadIdx.x * m2_ncols + threadIdx.y] = v;
}
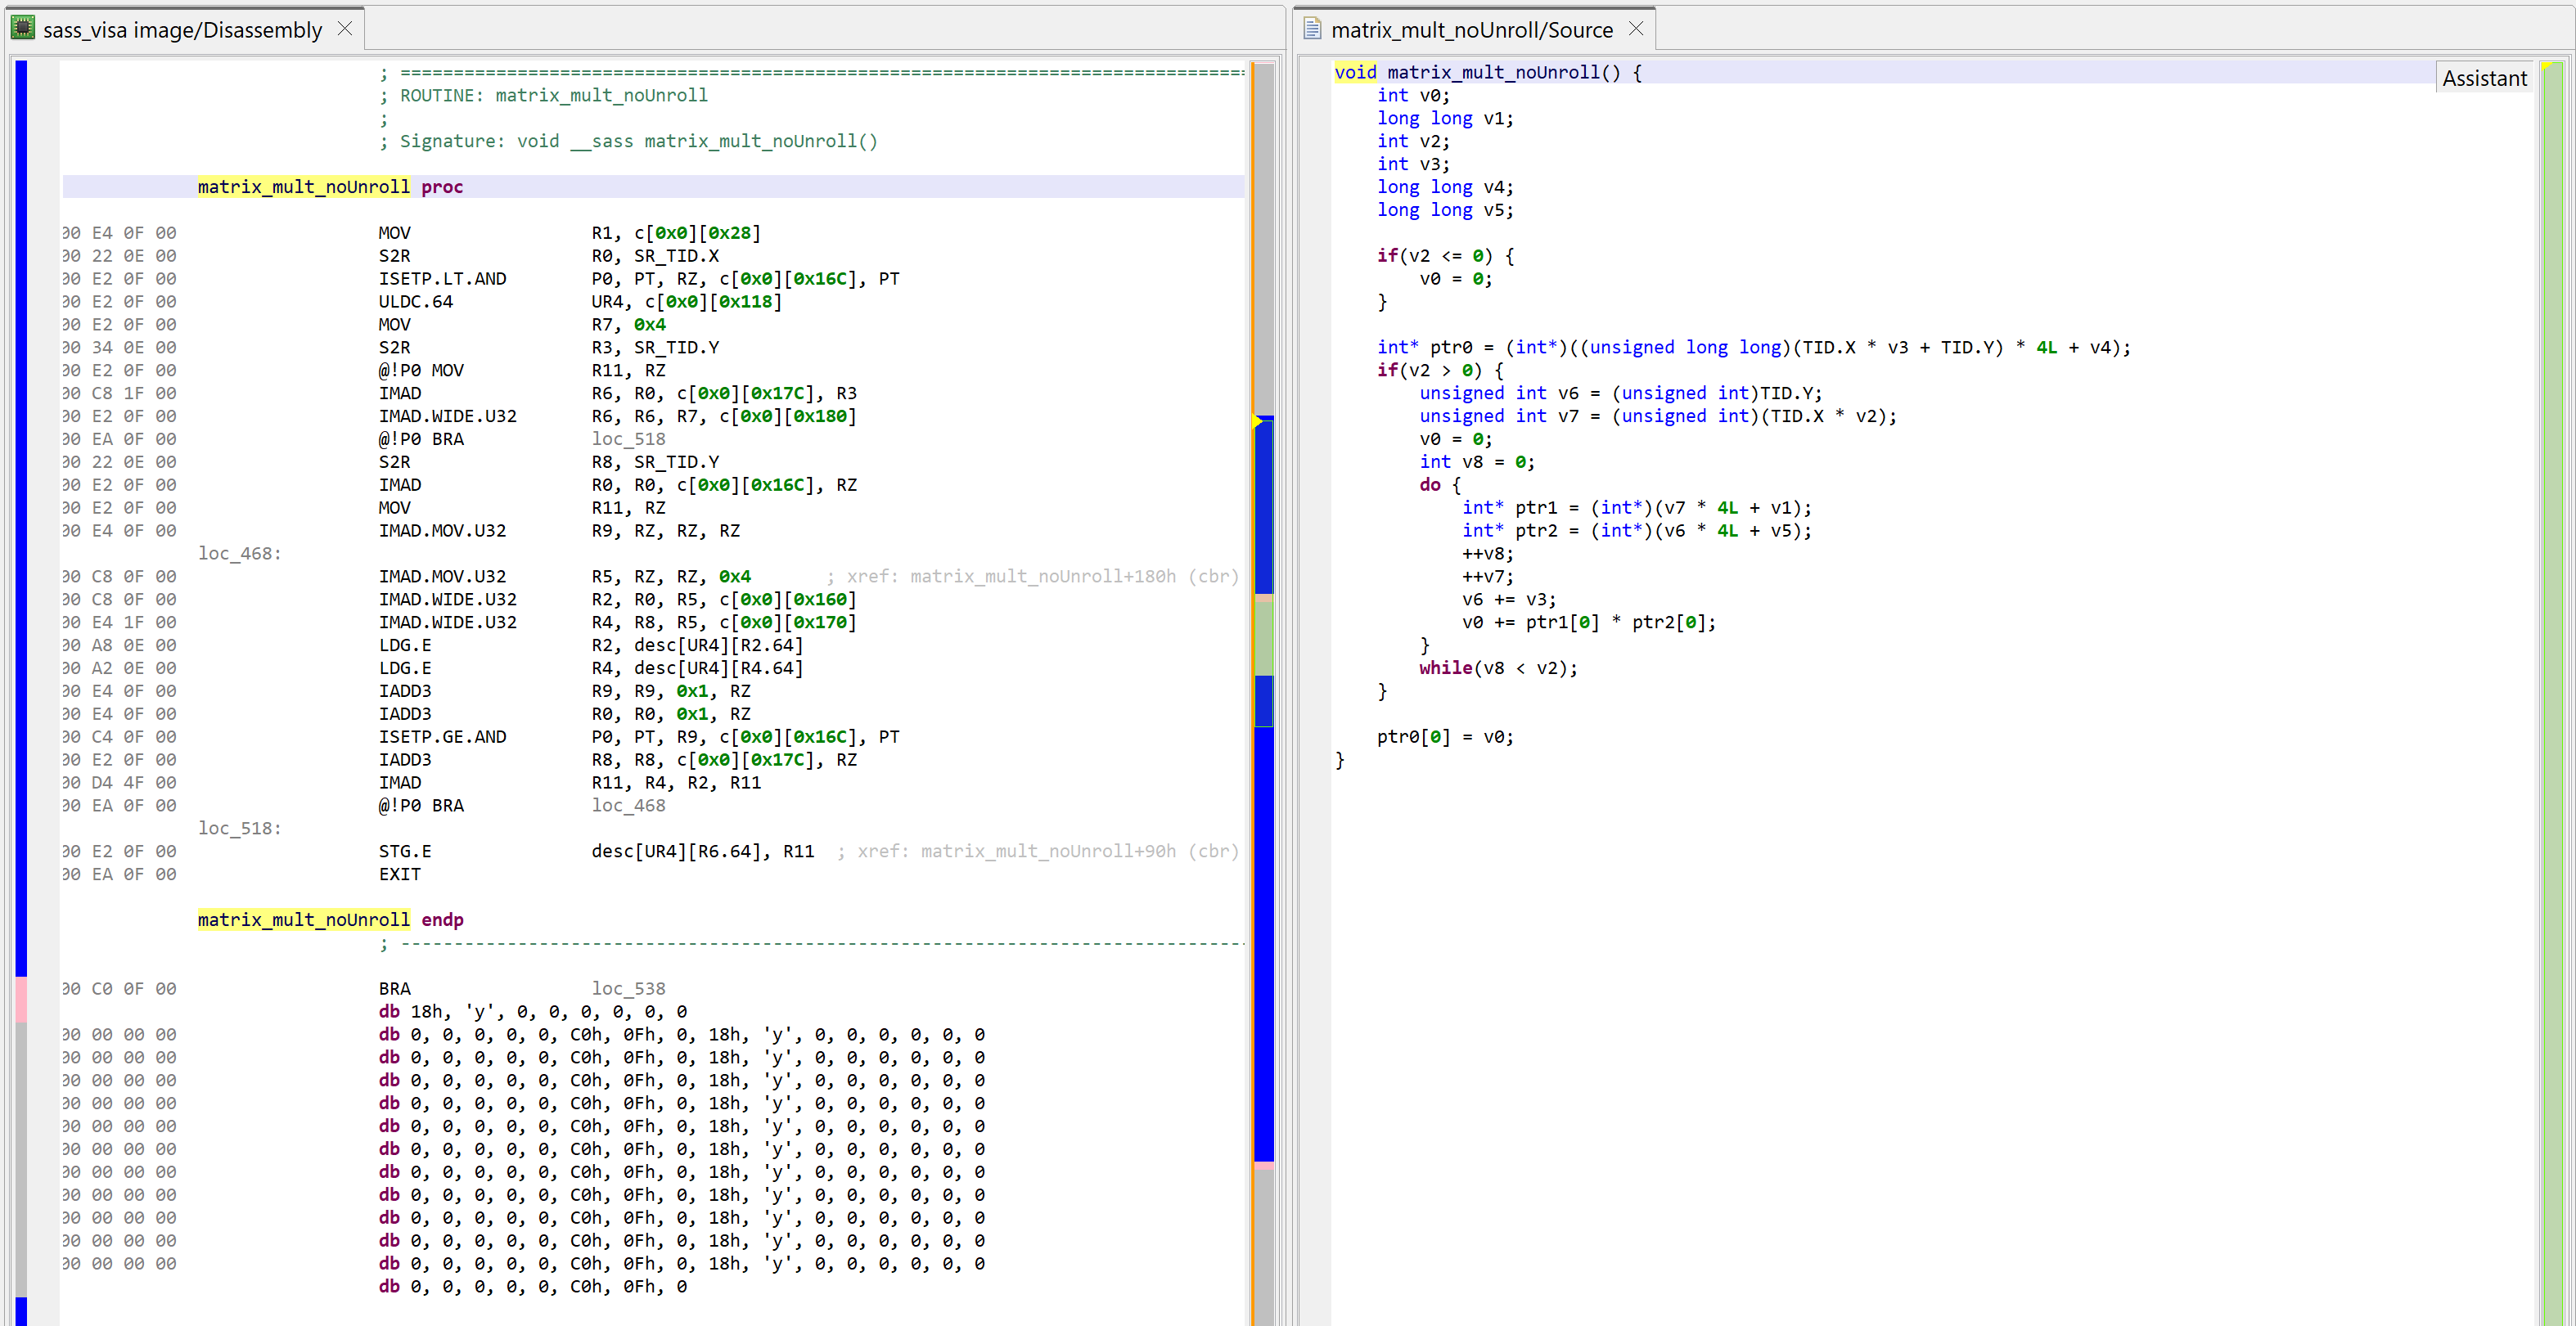
For the sake of example, let’s compile this kernel with full optimizations except for loop unrolling (#pragma unroll 1 on the for-loop). The decompiled code looks as follows:
The left part of this JEB workspace shows the SASS code for matrix_mult. The right side shows the decompiler output for this kernel. Note that the compilation process was sub-optimal, as loop unrolling was disabled.
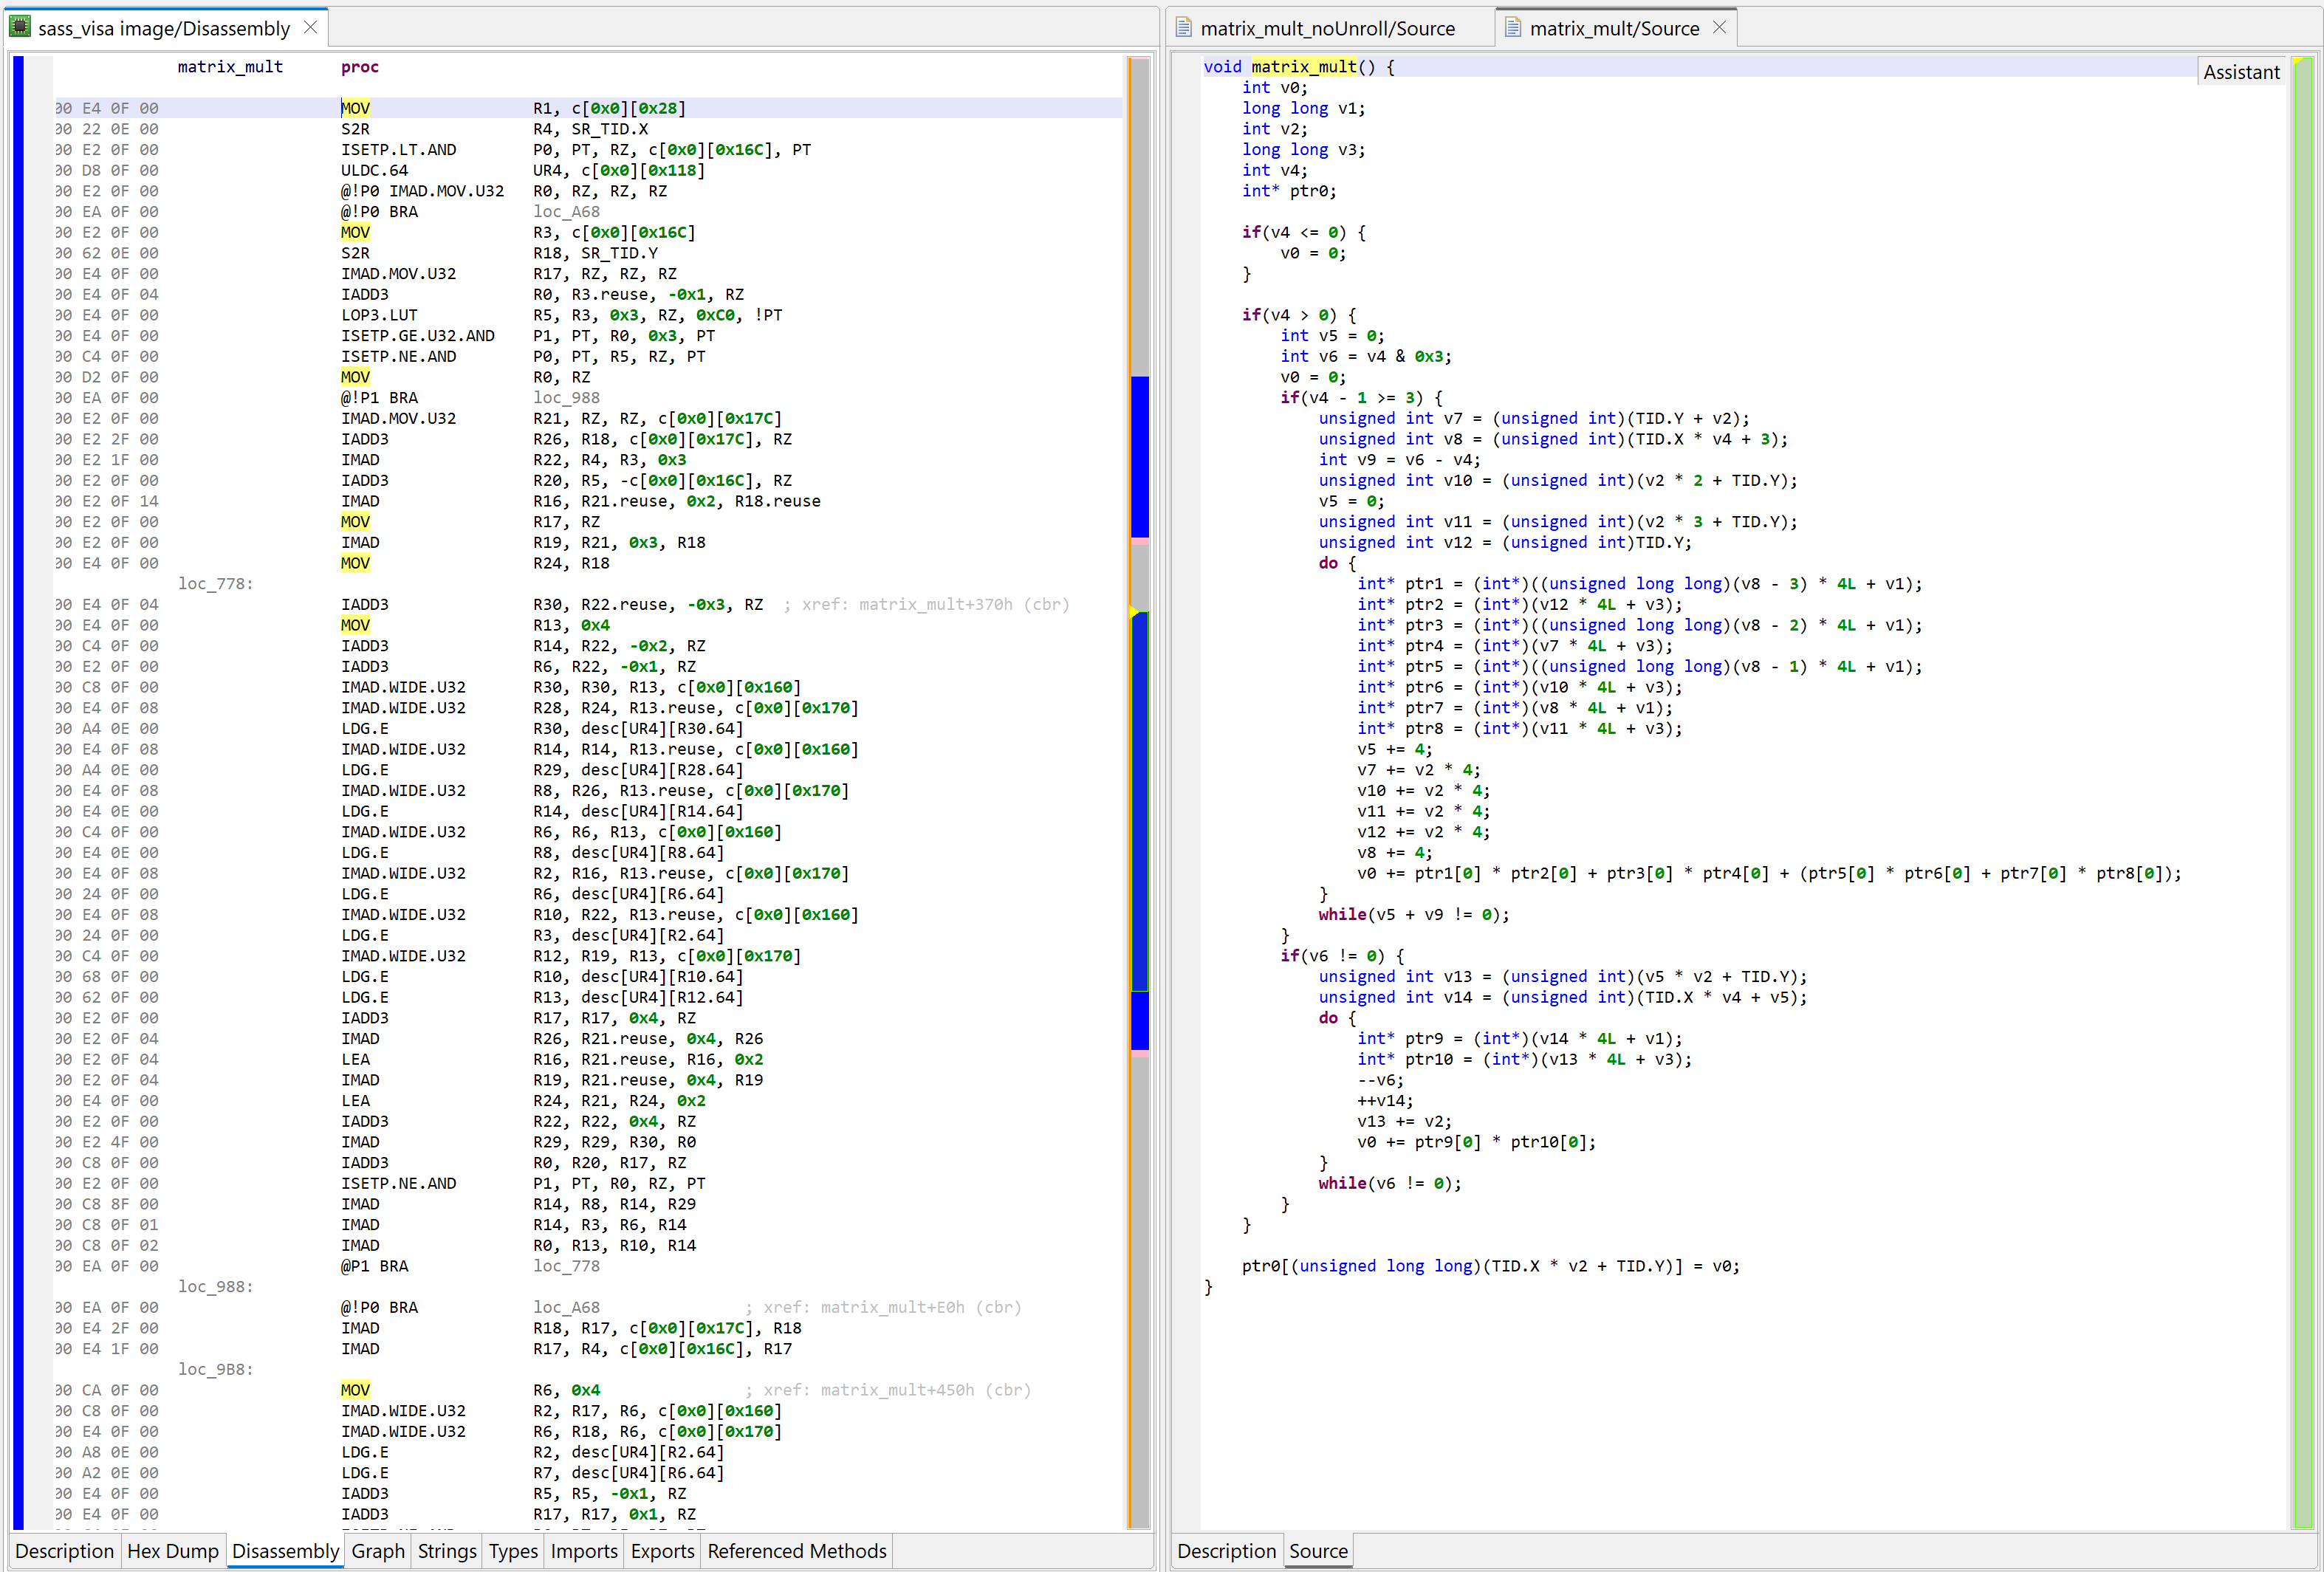
Below, the same matrix multiplication kernel compiled with full optimizations, including loop unrolling 7, which will increase the size of code substantially, and make readability much worse:
The left part of this JEB workspace shows the SASS code for matrix_mult. The right side shows the decompiler output for this kernel. Full optimizations are on, including loop unrolling. Notice that both the SASS code as well as the decompiler output are much larger.
Limitations
The sub sections below describe some of the decompiler plugin’s design and implementation choices, as well as list some limitations and avenues of improvement that may be considered in future updates.
IR Conversion
Many classes of instructions are fully converted to precise IR. However, not all SASS instructions’ semantics are clearly understood or have been figured out. In some cases, the decompiler won’t be able to generate precise low-level IR to represent an instruction.
Partial conversion: some instructions are only partially converted. For instance, at the time of writing, only the 4-operand version of FMNMX is converted to precise IR. The 5-operand variant is not, and will yield an “untranslated IR” statement, eventually represented as pseudo-C code such as FMNMX(inputs, outputs).
Missing conversion: some instructions are not converted at all. For instance, synchronization primitives such as ELECT or VOTE will be mapped to untranslated IR statements.
Future updates: Another limitation regards the handling of BRX branching instruction, which relies on a fixed-size jump table to perform a jump. Currently, the table (located in the cubin) is not processed, potentially yielding sub-par results regarding the actual targets of such instructions.
Memory Mapping
GPU kernels execute in environments that do not match how JEB’s gendec abstracts code and memory. When processing an artifact, JEB places all code and data in a unified, potentially arbitrarily-long virtual memory. By contrast, GPU codes are run in isolation, and can access several memory areas that are also isolated from each other. In order to reconcile those views, the plugin organizes bytes as follows:
Kernel codes will be found in the first 256 Mb of the VM. Each kernel (included its private sub-routines, when they have been identified) starts at the nearest 8-byte rounded address, following the previous kernel.
The constant memory, represented in SASS as c[bankId][offset] is mapped at address 0x1000’0000. Each bank has an arbitrary max size of 0x0100’0000 bytes.
The shared and local memory (e.g. accessed by STS/LDS or STL/LDL) is mapped at 0x3000’0000.
There is no explicit stack pointer.
Future updates: The values of global constants are located in specific segments of the cubin. Currently, those segments are ignored by the decompiler plugin. Similarly, resolved global symbols to e.g. external API routines such as libc’s, are located in constant pools.
Calling Conventions
A kernel entry-point (__global__ methods) has a well-defined calling convention — though not well-documented. Kernels return void, and all output data is written through pointers passed as arguments. The arguments are mapped to the constant memory bank 0, at the following offsets: – sm_70 to sm_89: 0x160 – sm_90: 0x210 – sm_100 to sm_12x: 0x380
Currently, the plugin generates no-output/no-input prototypes (i.e., void kernel()) for all kernels, and replaces memory accesses to mapped parameters by synthetic variables. Some simplified example: a 32-bit memory access to c[0][0x160] (resulting in *(int32*)(0x10000160) at the IR level) will be replaced by an EVar named “arg0”.
Future updates: Special calling convention may be created to allow the definition and customization of such vars at the prototype level.
Kernel sub-routines (__device__ methods that have not been inlined) do not have well-defined calling conventions. The compiler is free to save and use whatever registers it sees fit before invocation. The SASS decompiler plugin does not handle such methods very well at the time of writing, since it does not know which registers are written to provide the return value.
Future updates: A global pass may examine the callers of kernel sub-routines to infer which registers are saved, which are used to provide arguments, and which hold return values.
Optimizations
The matrix multiplication example above highlighted the importance of loop unrolling in the compilation process to obtain better performance for GPU code. However, this compiler-level optimization produces lengthy and difficult pseudo C decompilations.
Future updates: Having a special IR optimizer that attempts to re-roll some loops will be an important step toward producing readable decompiled code for large kernels. 8
API and headless processing
The usual JEB APIs can be used to access container units (IELFUnit, IPECOFFUnit), code units (INativeCodeUnit), and decompiler units (INativeDecompilerUnit).
The CUDA fatbin units, of type cuda_fatbin, is represented by the newly-added interface ICudaFatbinUnit. The getCubinEntries() method provides ICudaCubinEntry objects. That interface offers an easy way to retrieve flags or architecture information about a cubin. The code itself (in the case of a SASS entry) is located in ELF units that are children (sub-units) of a fatbin unit.
Conclusion
This plugin provides flexible and robust disassembly and analysis for Nvidia code generated for Volta and above classes of GPUs. It was tested on 100+ millions unique instructions making up approximately 620,000 kernels (from sm_70 to sm_121) to ensure full compatibility with the outputs of cuobjdump and nvdisasm.
The experimental decompiler plugin can be used to examine a higher-level representation of the underlying SASS code. At the time of writing, the output is quite rough and will require more source binary information extraction and code optimization in order to match the one of mature decompiler plugins.
⚠Improvement to this plugin will mostly depend on user feedback! If you find it useful, please reach out to us (email, Slack) and let us know your requirements, use-cases, and areas where you’d like to see improvements.
I want to extend a special thank you note to the author of DocumentSass, which was a great help during the early weeks of this research project.
Thank you & until next time 🙂 Nicolas.
Annex 1: Instructions Distribution
To create the SASS disassembler, we examined 62,000 kernels shipping with the CUDA toolkit as well as other commercial applications. It made up for about 1.1 million unique instructions. It is unlikely this set is representative of all commercial GPU code, but we provide those numbers for the most curious readers:
# Top distributions, per-kernel
# Example: BRA is seen in all kernels,
# whereas BAR is seen in about every other kernel
BRA      100.00%
EXIT     98.35%
NOP      98.08%
IMAD     96.85%
ISETP    96.81%
S2R      95.75%
LDG      93.75%
IADD3    93.19%
STG      88.71%
SHF      82.59%
LOP3     79.81%
LEA      79.35%
BSYNC    74.03%
BSSY     74.03%
MOV      67.91%
SEL      59.34%
ULDC     58.22%
LDS      53.43%
STS      53.41%
BAR      51.81%
# ...
# full list: sass_insn_per_kernel_distribs.txt
# Most common, in descending order
# Example: IMAD (integer multiply-and-add) is by far
# the most common instruction encountered
IMAD
ISETP
IADD3
FFMA
LDG
BRA
LEA
NOP
LDS
LOP3
MOV
SHF
FMUL
STS
FADD
DFMA
PRMT
SEL
# ...
# full list: sass_insn_most_common.txt
—
SASS= Streaming Assembly, the hybrid RISC/NISC/VLIW-like proprietary instruction set used by Nvidia GPUs ↩
CUDA= Compute Unified Device Architecture, a computing platform and set of APIs to write and run code on GPUs ↩
PTX= Parallel Thread Execution, a medium-level intermediate representation of GPU code ↩
A compiled list of all special registers gathered from sm_70 to sm_121 can be consulted here: sass_special_registers.txt. Not all registers are available on all architectures. Many can be accessed in PTX through similarly-named variables, e.g. %tid.x for SR_TID.X. ↩
SASS instructions do not use a mixed operand (src+dst) such as on the x86 architecture. ↩
JEB “actions” are not specific to the SASS plugin. New users are encouraged to read the Manual pages if they are not familiar with JEB’s commands and workflow. ↩
ptxas does a lot of loop unrolling to maximize instruction-level parallelism and achieve better throughput. ↩
On its own, a generic re-roller is quite an endeavor and will make for a great research project that would benefit both gendec and its Dex counterpart, dexdec. ↩
In this post, we are having a quick look at a relatively novel protection techniques found in the wild. The class we are looking at is com.X (SHA256: a519e4a20586807665d82ea28892e2ede184807868552f23210bf10c05727980).
Have a look at the decompiled code, with standard JEB options. It was auto-deobfuscated and thoroughly cleaned by dexdec, JEB’s Dalvik decompiler:
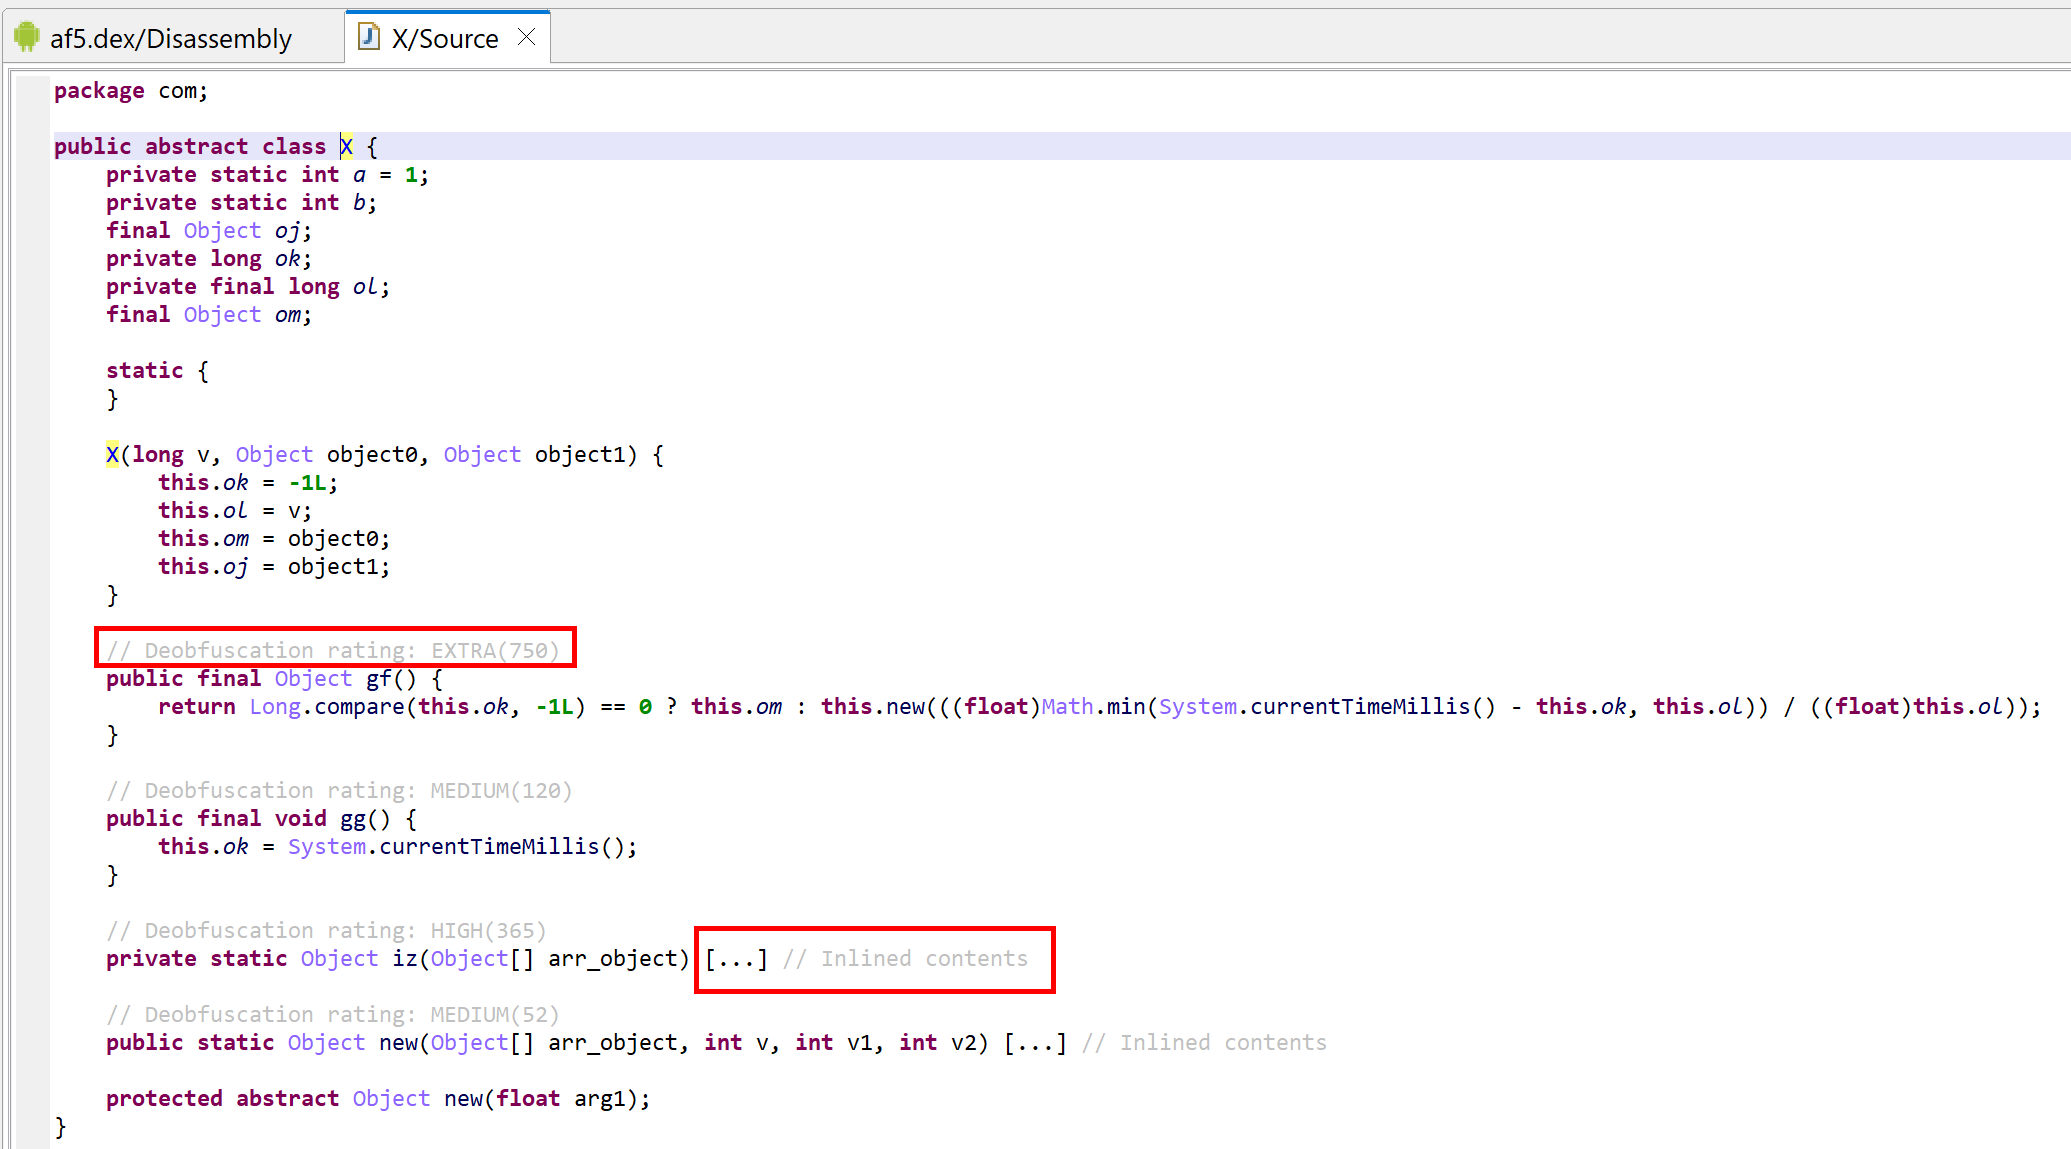
Decompilation of com.X with standard options (it’s been deobfuscated, and JEB is letting you know about it by providing deobfuscation ratings or scores as method comments)
A note on deobfuscation ratings
Two items to notice:
Some methods outputs are collapsed: their direct output was deemed useless because their code were inlined in corresponding callers. You may re-expand them with the Dash (-) action key, or via the Action menu, Collapse/Expand command.
Some decompiled methods have an auto-comment specifying a deobfuscation rating and score. This score is calculated from the result of IR optimizers tagged as DEOBFUSCATOR. If the score reaches a threshold, the rating (LOW – not shown-, MEDIUM, HIGH, EXTRA) is specified in the decompilation output, to give a hint to the user that the low-level code is protected, and that the high-level decomp was deobfuscated and cleaned.
The deobfuscation ratings for several methods of com.X are high. It looks like this class received a significant amount of protection. However, after clean-up, the meaningful code consists of two one-liner methods: one storing a timestamp (method gg), the other one calculating an elapsed time (method gf).
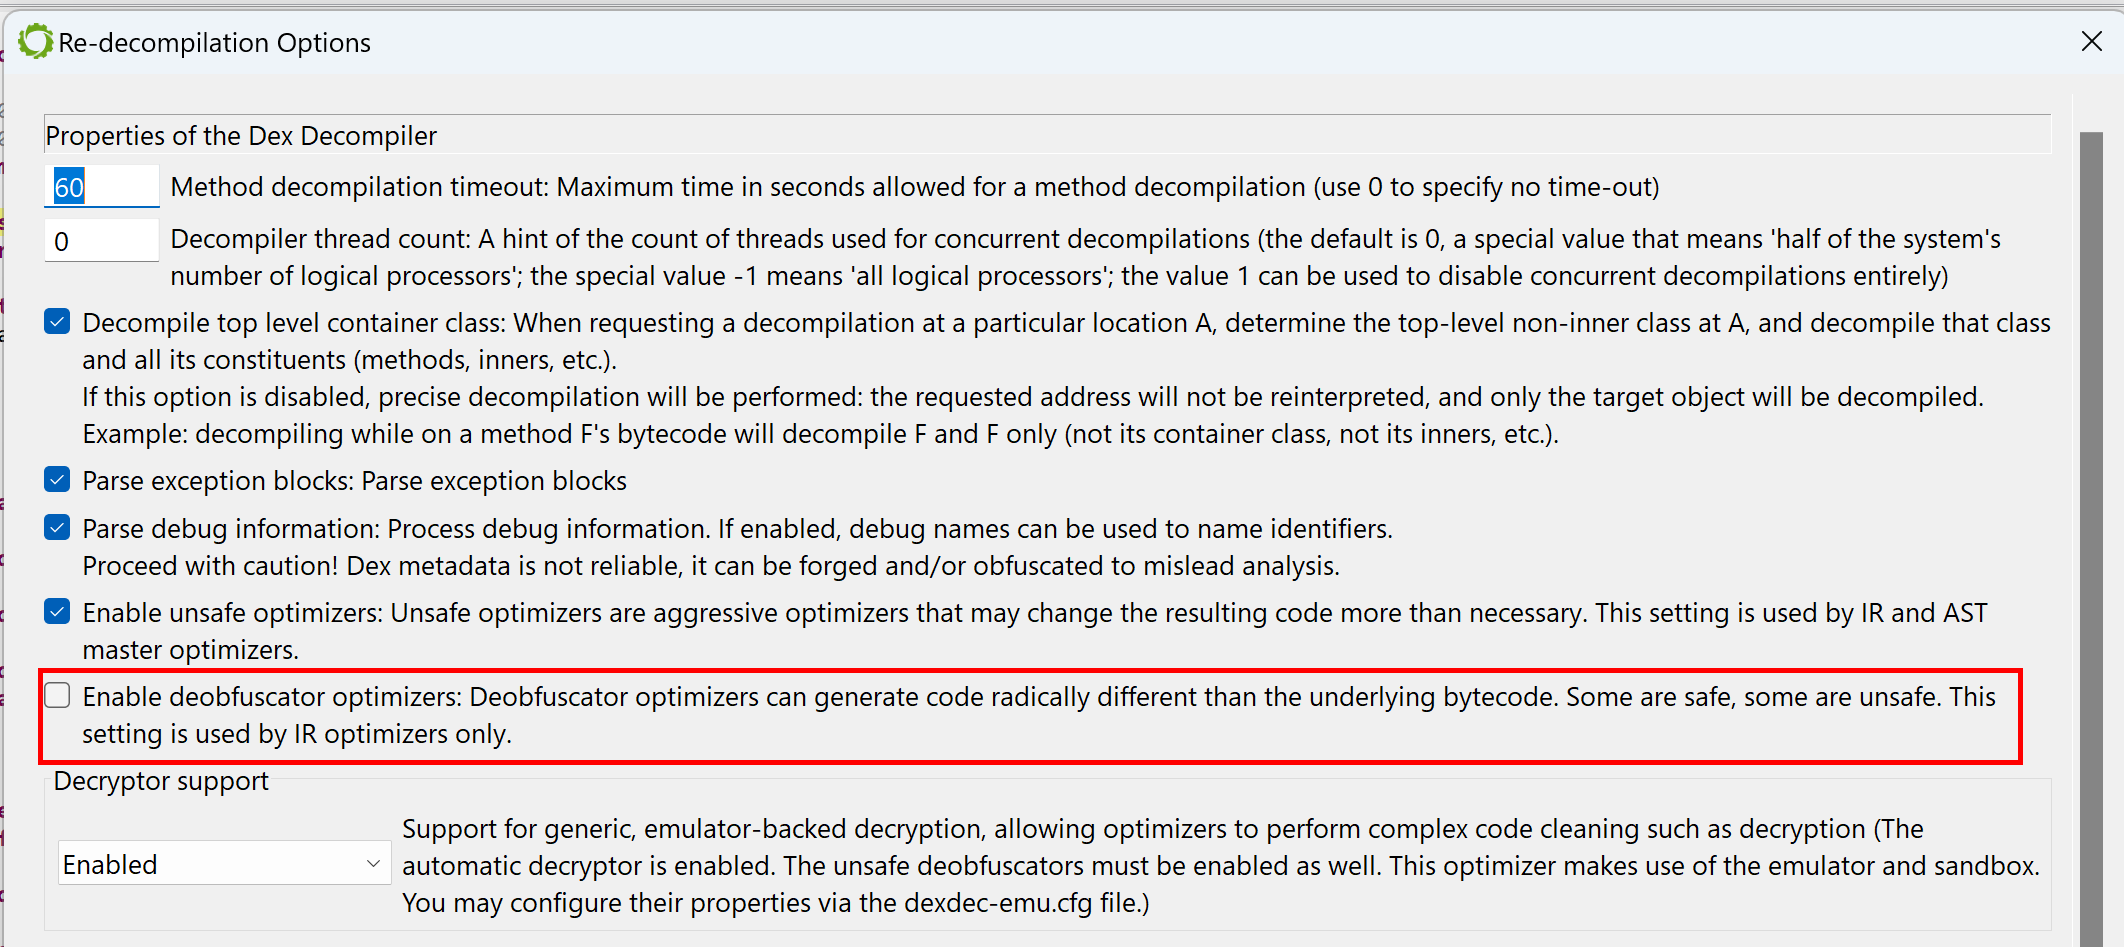
Let’s have a look at the decompiled code with deobfuscators disabled: Redecompile the code with CMD1+TAB (Action menu, Decompile with Options…), and untick “Enable deobfuscator optimizers”.
dexdec options when redecompiling with Action, Decompile with options…
The re-decompilation result is as follows:
Decompilation of com.X with deobfuscators disabled
There is quite a lot to look at here, mainly, the fat routines and the opaque predicates.
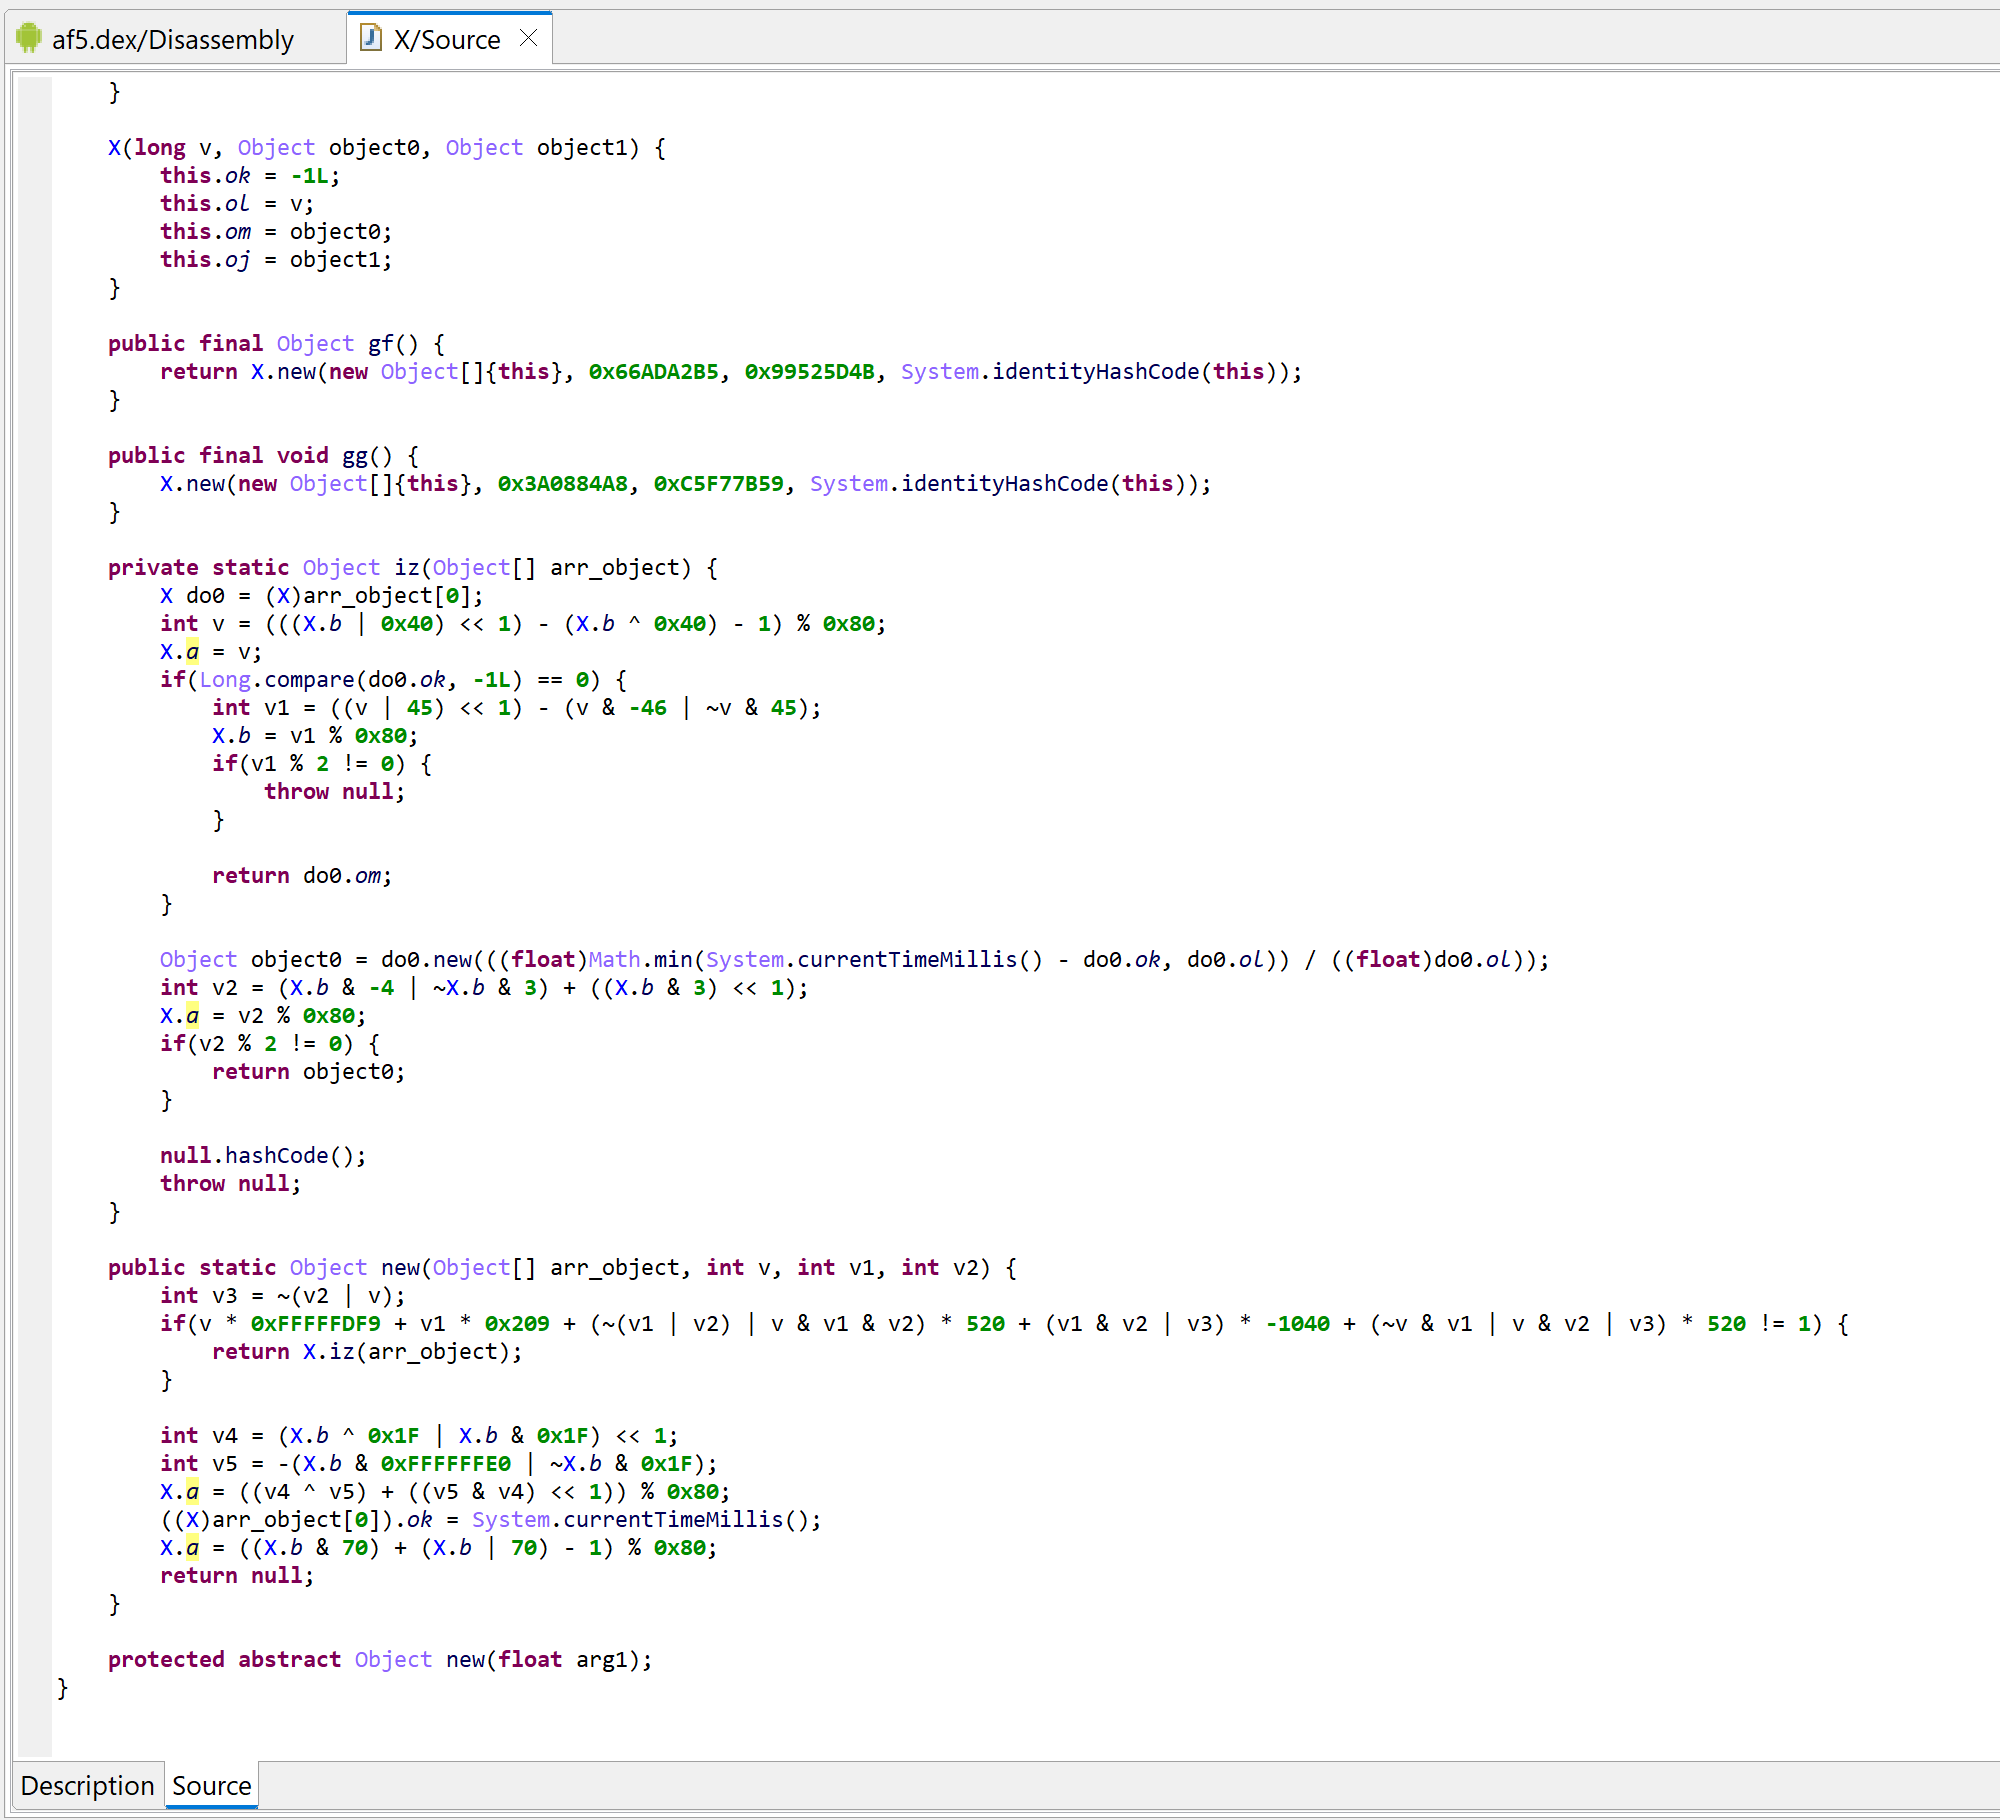
Inlining “fat” functions
We see that gf calls new with a set of fixed integer (v, v1) as well as the identityHashCode of itself (v3, essentially a pseudo-random number). Similarly, gg also redirects to new, with a different set of arguments.
The methods gf() and gg() are wrappers calling the method new() with various keys
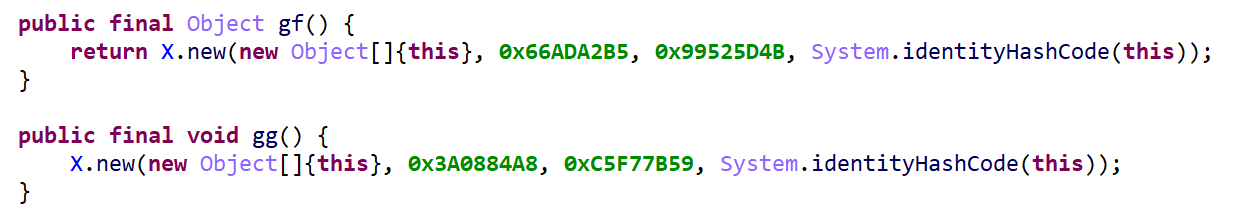
A quick examination of new shows that two code paths may be executed, based on the values of the provided triplet (v, v1, v2):
Decompilation of the synthetic “fat” function new, holding the real code of gf and gg
So, what happened? The protection of class com.X consisted of taking the bodies of code of gf and gg, merge them into a single method new (hence the name “fat”), and change the codes of gf and gg to trampoline into new with selectors to execute the proper code.
Here is an easier representation of that process, with a single selector (instead of a triplet):
// UNPROTECTED CLASS C
class C
  int fld1;

  int f1(int x) {
    return 25 + x;
  }

  int f2() {
    return 31 * fld1;
  }
}

// PROTECTED CLASS C
class protected_C
  int fld1;

  int f1(int x) {
    return (int)fat_routine(new Object[]{this, x}, 1);
  }

  int f2() {
    return (int)fat_routine(new Object[]{this}, 2);
  }

  static Object fat_routine(Object[] params, int selector) {
    if(selector == 1) {
      return 25 + (int)params[1];
    }
    else if(selector == 2) {
      return 31 * ((C)params[0]).fld1;
    }
    throw new RuntimeException();  // should not happen
  }
}
Although the above code is trivial, we can use it to highlights two complications the decompiler will face when dealing with the more complex implementations made by the a real code protection system:
When to decide to inline, i.e. how to detect fat functions? (that question is outside the scope of this blog, and would not be of much interest to most readers)
What about complex selectors, such as a triplet with a pseudo-random int?
If JEB’s dexdec were to inline the calls to new as it is, we’d end up with the following decomps – not quite what we saw at the beginning of this article!
Decompilation the deobfuscators re-enabled, however the opaque predicate breaker was disabled
Resolving opaque predicates
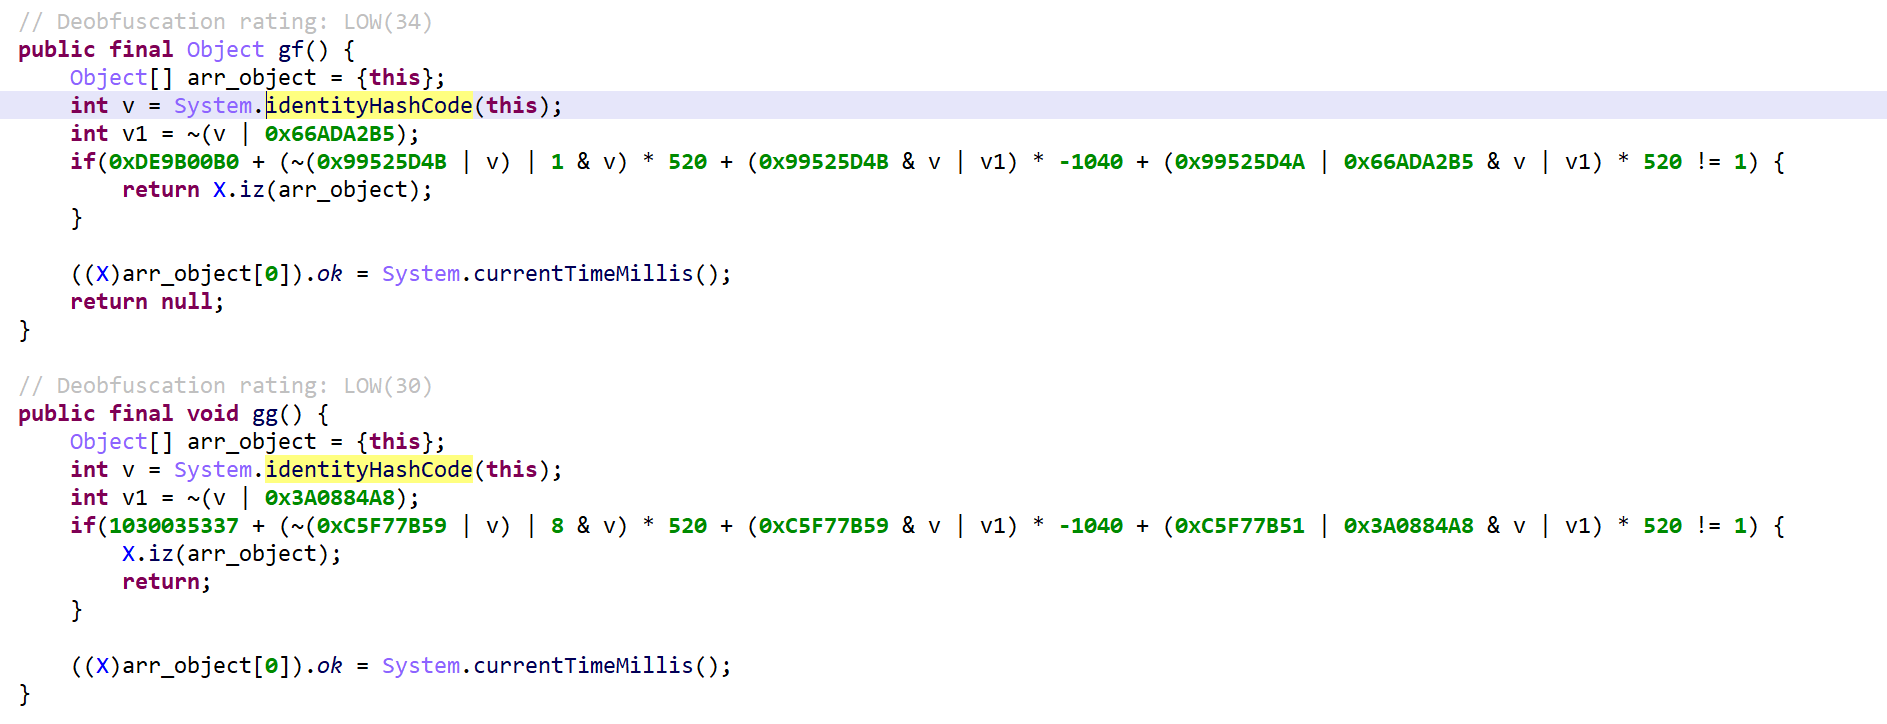
Let’s look at method gf. We can see that the pseudo-random selector, after inlining, is used to calculate a predicate that will determine which path to take, i.e. do we execute the actual code for gf, or the code for gg?
Internally, JEB does quite a bit to simplify it, and ultimately, when all fast reductions and simplifications are applied, it will use the well-known Z3 SMT solver to break the predicate. In this case, regardless of the value of X, the predicate is true. Therefore, gf will be simplified to:
return X.iz(arr_object);
(Note that method iz is itself a candidate for inlining! At the end, the cleaned-up code shown in the introduction of this article will be generated.)
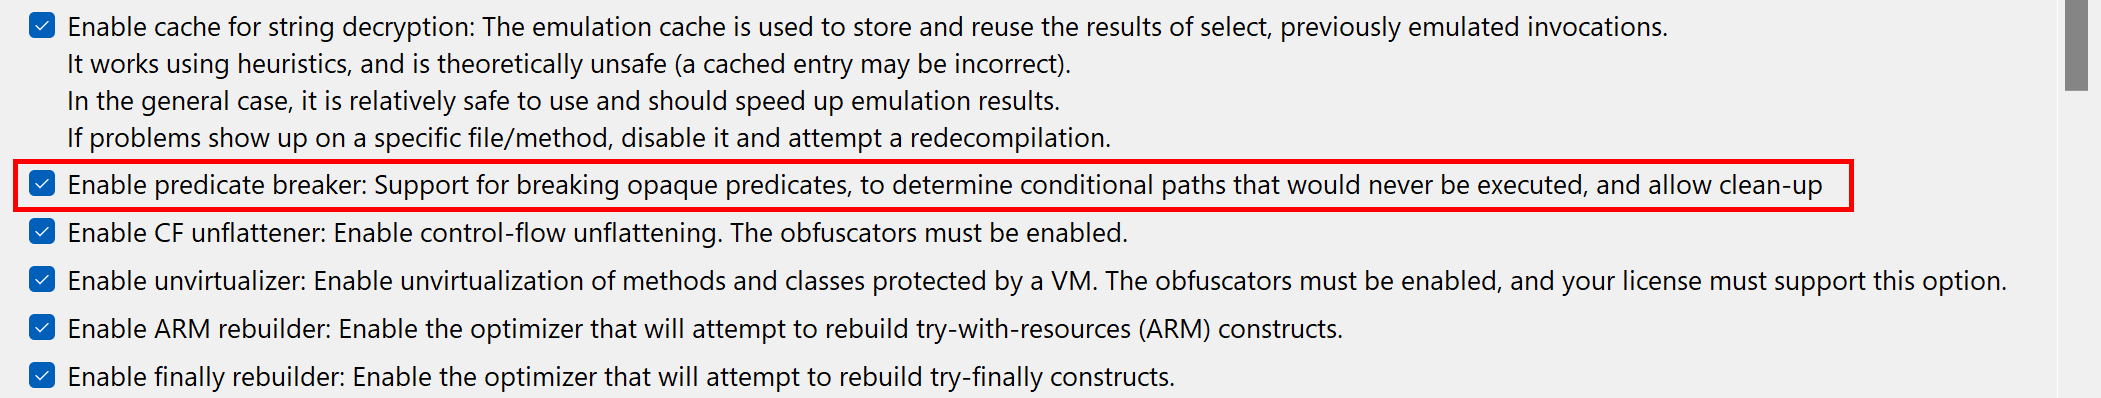
The use of Z3 and other external theorem provers that may be used by JEB and its plugins can be disabled in the option (see “Enable predicate breaker”):
The external predicate solver can be disabled in the options
Conclusion
We hope this quick note will shed some light on some newer features or recent upgrades that went into dexdec. Many of those were already present in gendec, the generic decompiler used for anything non-Dalvik, and it was about time to add those advanced clean-up passes into the Dalvik decompiler as well. In a sense, dexdec has caught up and even gone further than gendec on these aspects.
Which leads me to say there will likely be a Part 2 or at least an update for this blog, to highlight another complex deobfuscating task: the simplification of arithmetic operations consisting of bitwise operations and mixed boolean/arithmetic (MBA) expressions.
Stay tuned! Thank you to all our users and readers of this blog 🙂 Do not hesitate to reach out through the usual channels (Slack, email, X).
Updated on March 19 2024: cover the additions of JEB 5.10 (auto-integration of dex, so files) and JEB 5.11 (unpacker report).
This post presents one of JEB components used for Android app reverse engineering: the Generic Unpacker for APK. 1
The unpacker will attempt to emulate the app’s execution in order to collect dex files and native libraries (so files, arm64 only) that would be dynamically generated at runtime. Many APK protectors, legitimate or otherwise – used for malicious purposes -, employ such techniques to make the payload Dalvik bytecode more difficult to access and analyze.
How to use the APK unpacker
First, open the target APK in JEB. In some cases, the unpacker module will let you know that there is a high-probability that the APK was packed:
[W] The APK may have been packed. You may run the generic unpacker to see if additional dex files can be recovered.
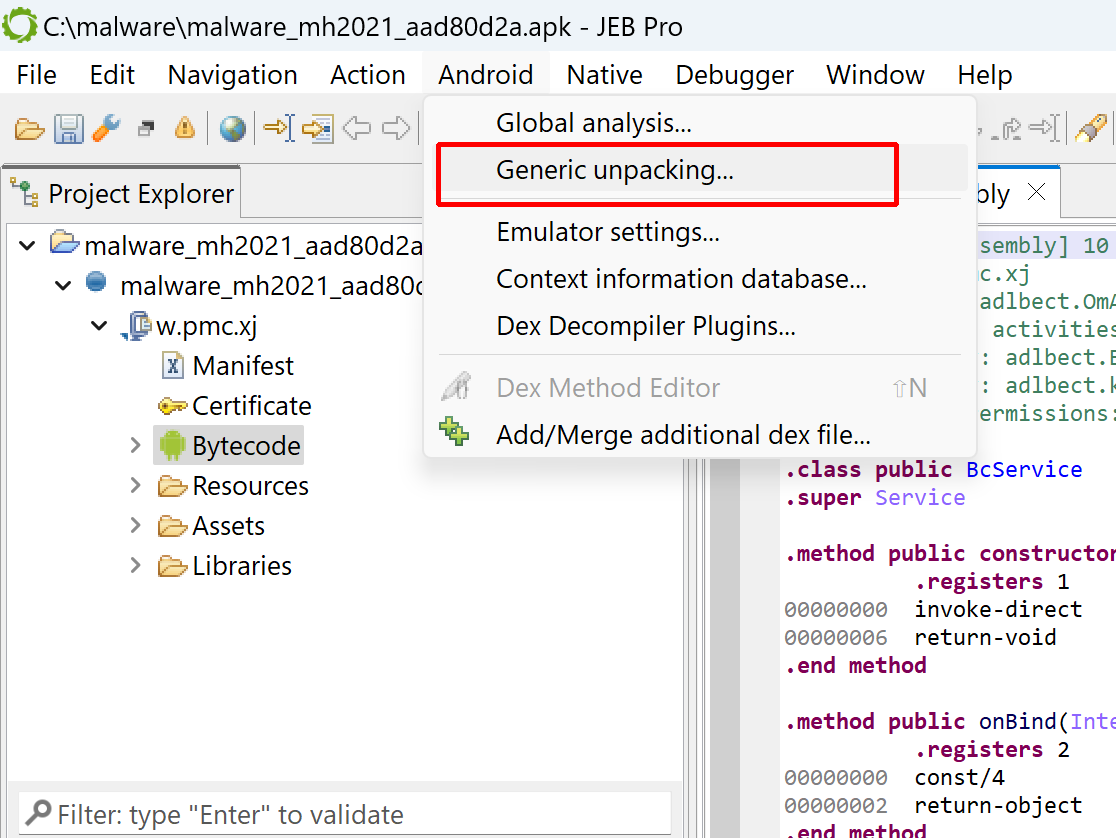
In many cases, that heuristic won’t be triggered and no specific hint issued. Either way, you may start the unpacker via the Android menu, Generic Unpacking…
Start the Generic Unpacker via the Android menu
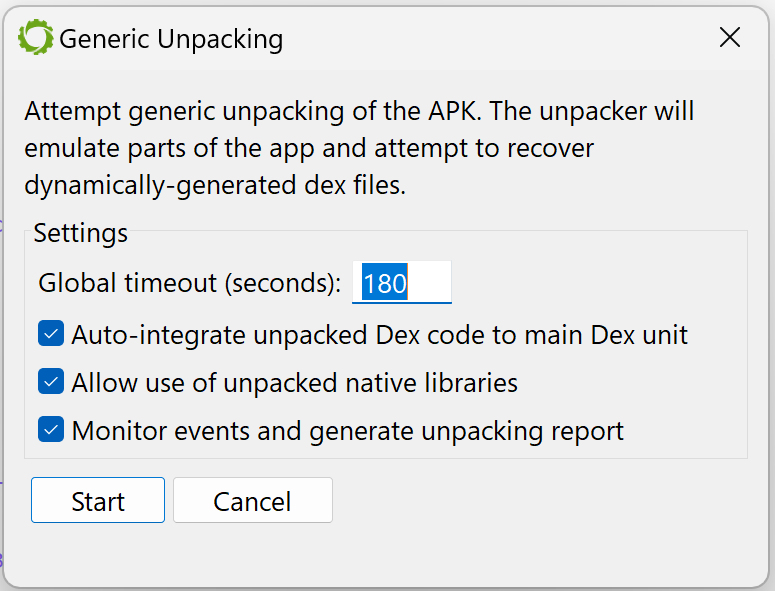
An options dialog will be displayed. The available options are:
Maximum duration after which the unpacking process should be aborted (the default is set to 3 minutes, although in most cases, unpacking will stop well before that time-out).
Whether or not collected dex should be used during the unpacking process itself (if so, they would be integrated in the current dex unit, to allow their emulation).
Whether or not collected so files should be used during the unpacking process itself.
If monitoring hooks should be set up to allow the generation of a report after the unpacking process completes (the report contains a trace of useful events, that could be used to quickly determine how the unpacking process works).
Options dialog for the unpacker
Press “Start” and let the unpacker attempt to recover hidden dex files and so libraries.
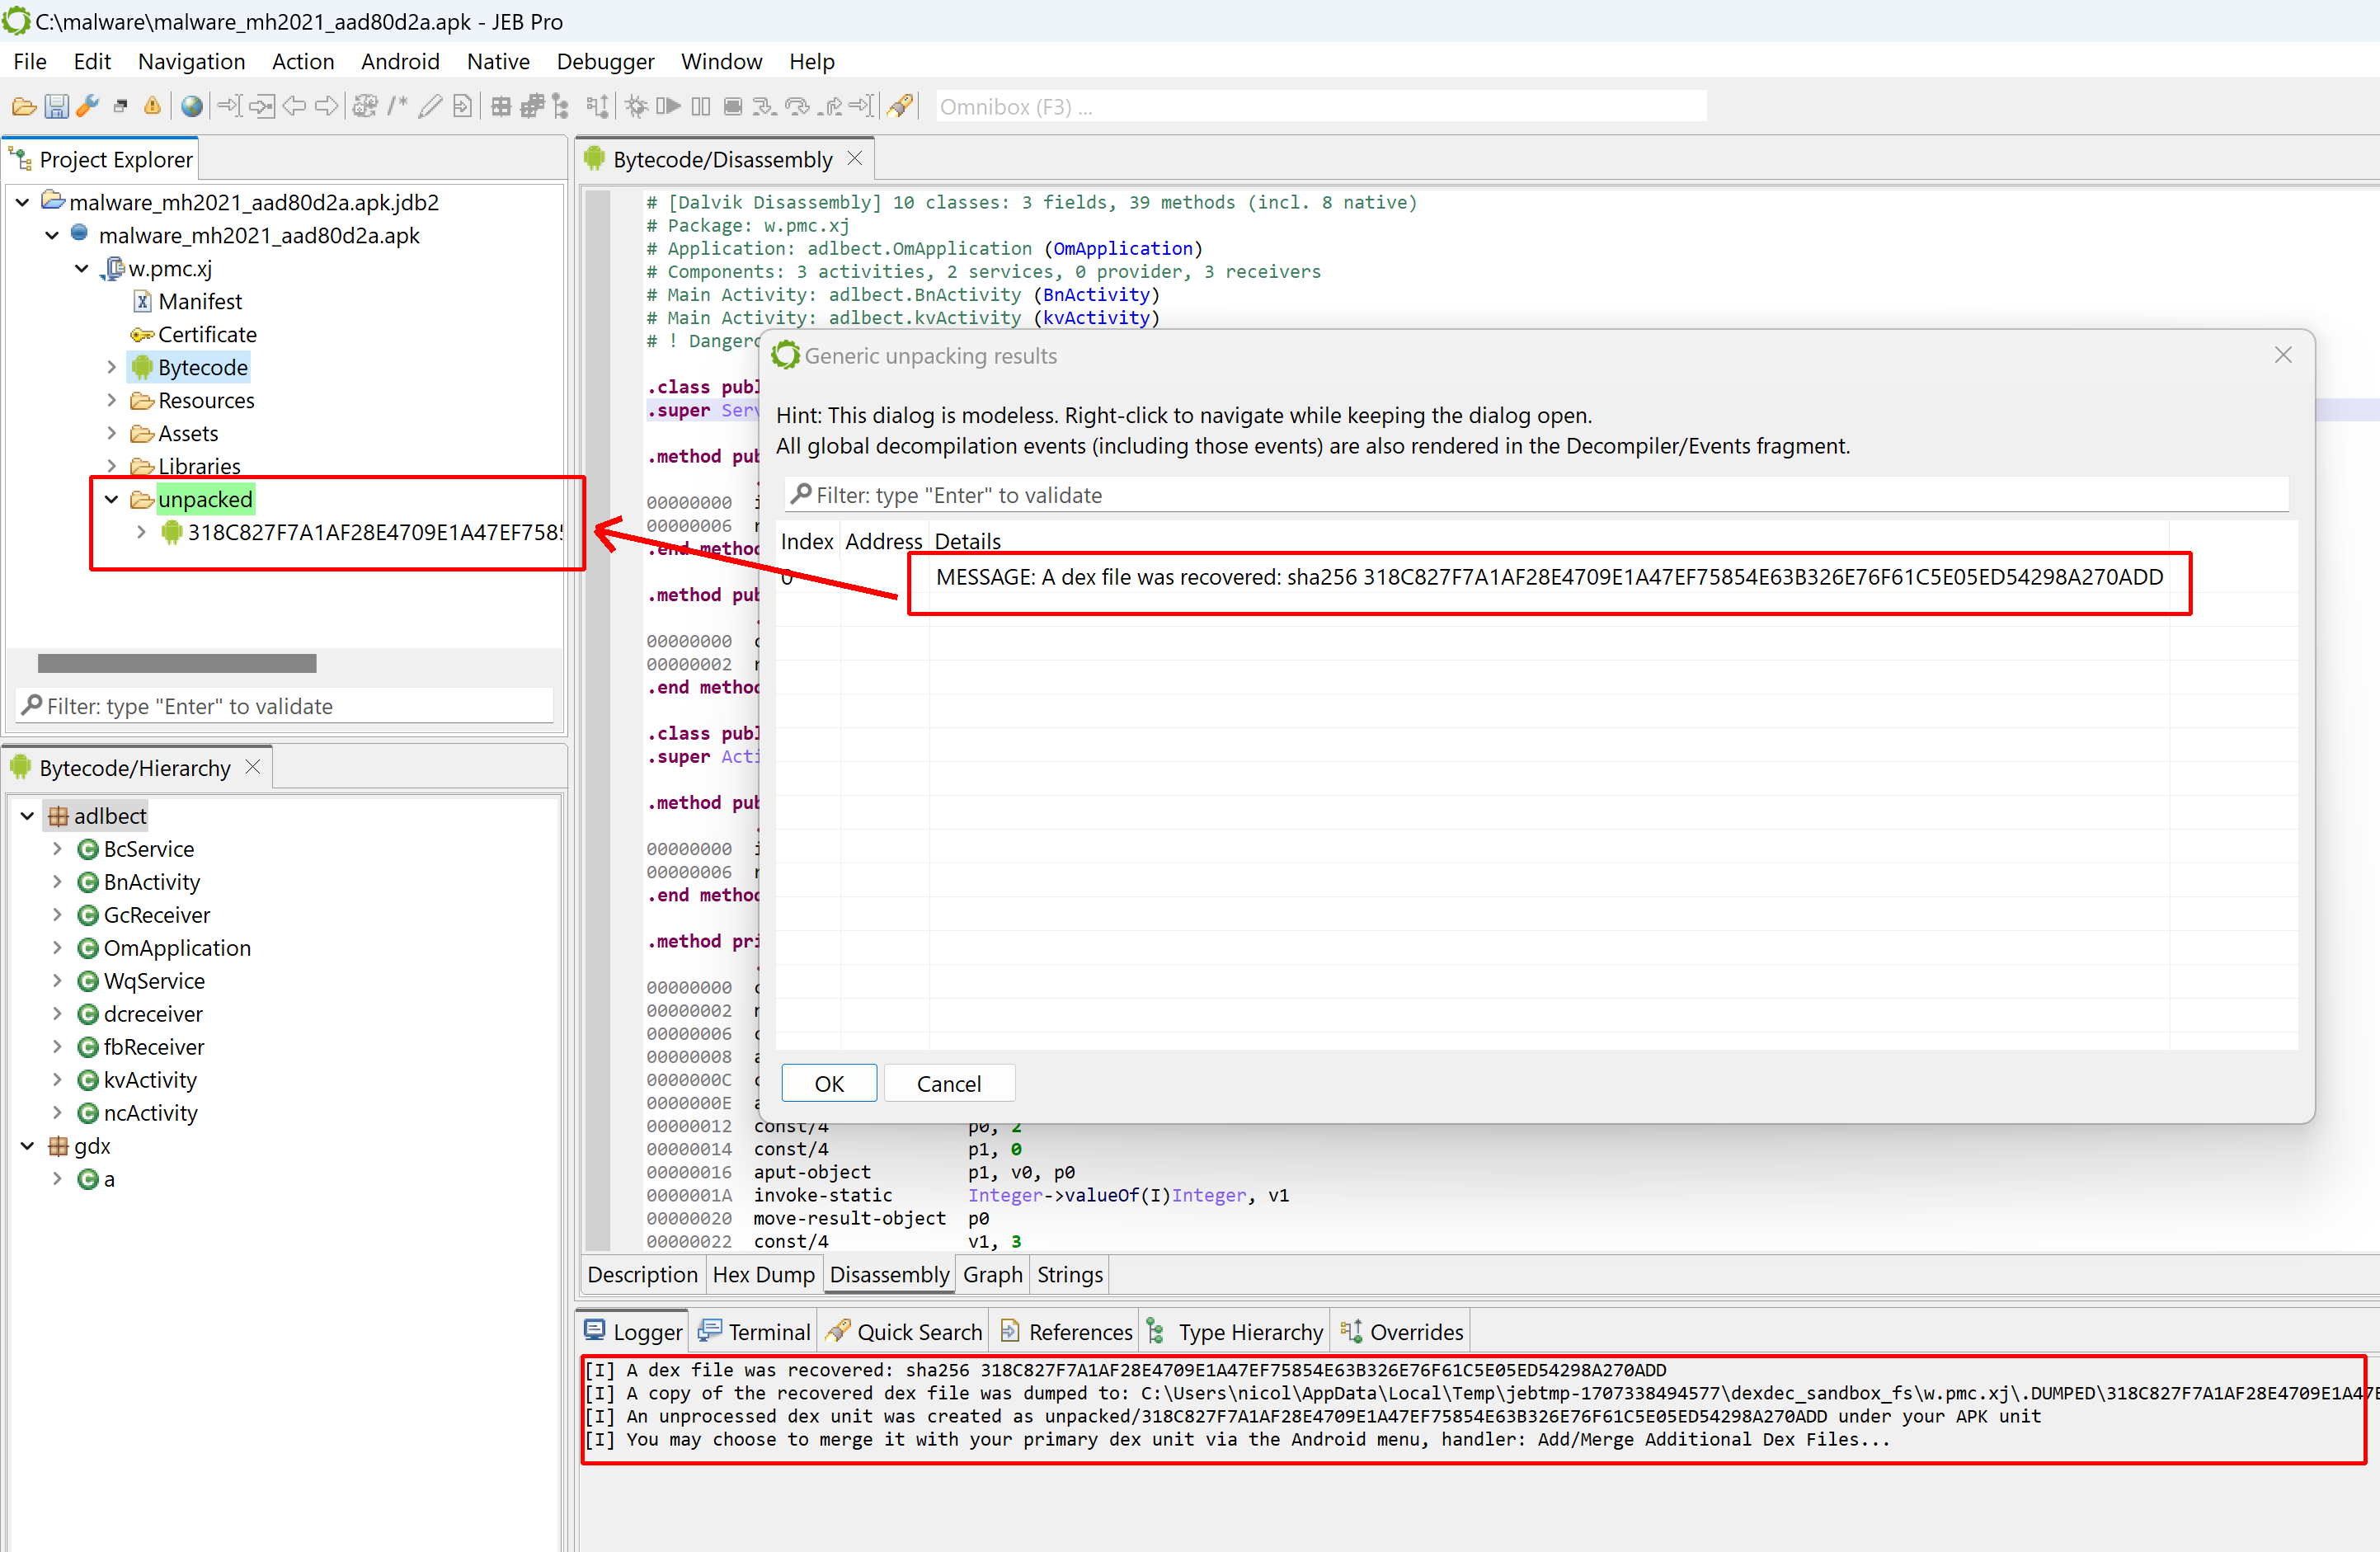
After it’s done, a frame dialog will list the unpacker results, consisting of dexdec MESSAGE notifications indicating which dex files were recovered, and where. The logger will display similar information. If the option was selected, the unpacker will also generate and display a report.
For each recovered dex and native library, a corresponding unit will be created under a sub-folder named “unpacked” (highlighted in green, located under the APK unit).
The unpacker has completed and is displaying its results (one dex file was recovered)
Analyzing the collected files
At this point, you may decide to analyze the recovered dex and so files(s) separately. In this case, simply open up the dex/elf unit(s) under “unpacked”, and proceed as normal (another code hierarchy, disassembly view, etc. will be opened).
Dex files integration
You may want to integrate the recovered dex with the already existing bytecode. If you ticked the options “Auto-integrate unpacked dex code to main dex unit”, the integration is automatic (and in many cases, it will allow the unpacker to proceed even further). Else, to do it manually, follow these steps:
Right-click on the recovered dex unit, select Extract to… and save the dex to a location of your choice
Navigate to the primary dex unit (generally named “Bytecode”), to which you want to integrate that saved dex to, and open it with a double-click
Go to the Android menu, select Add/Merge additional Dex files… and select the file previously saved
The collected dex will be integrated with the existing bytecode unit, and the bytecode hierarchy will reflect that update
Native libs analysis
The recovered arm64 library files may be analyzed separately. If the option “Allow use of unpacked libraries” was ticked, the recovered so files will be used by the unpacker, during unpacking. As was mentioned for dex above, in many cases, it will allow the unpacker to proceed further than normal.
Unpacking report
If the corresponding option was enabled before unpacking, a report will be generated after unpacking. It contains a detailed event trace of what happened, as well as a useful list of the most important unpacking events, that reverse engineers may view as a high-level “signature” of the unpacking code itself. A few examples follow.
Note that the full reports were trimmed, only their first section (“interesting records”) is displayed. The first colon indicates the emulation counter when the event occured, prefixed with either ‘j’ (java) or ‘n’ (native). The second item is the record type. Record specific strings follow, such as the method signature, string-marshalled parameters, program counter, memory addresses, register values, etc.
Report sample 1
This packer does not employ native code. The malware was provided by one of our users. The records indicate that:
the custom app’s attachBaseContext() was called
an asset was retrieved
from it, a custom jar was written
that jar (containing a dex, accessible in “upacked”) was loaded into the app’s process via DexClassLoader
To create an APK unpacker, you may use the IApkUnit.createGenericUnpacker() method. (To retrieve an APK unit from a JEB project, use the project’s findUnit method, or any other IUnit search related method — please refer to sample scripts for example).
Limitations
The unpacker will not be able to handle all cases. Please report any problem or bug you are encountering, we will see if anything can be done to support most cases.
In an upcoming update, the IGenericUnpacker API will offer a way for users to write plugins in the form of dex-emulator and native-emulated hooks to do whatever is needed to perform an unpacking task that the built-in code would fail at.
Until next time!
Nicolas
—
The unpacker was introduced in JEB 5.9; it received significant upgrades in versions 5.10, 5.11. ↩
This is the second entry in our series showing how to use JEB and its well-known and lesser-known features to reverse engineer malware more efficiently. Part 1 is here.
Today, we’re having a look at an interesting portion of a x86-64 Windows malware that carries encrypted strings. Those strings happen to be decrypted on the fly, the first time they’re required by some calling routine.
SHA256: 056cba26f07ab6eebca61a7921163229a3469da32c81be93c7ee35ddec6260f1. The file is not packed, it was compiled for Intel x86 64-bit processors, using an unknown version of Visual Studio. The file is dropped by another malware and its purpose is reconnaissance and information gathering. Let’s load it in JEB 5.8 and do a standard analysis (default settings).
Initial decompilations
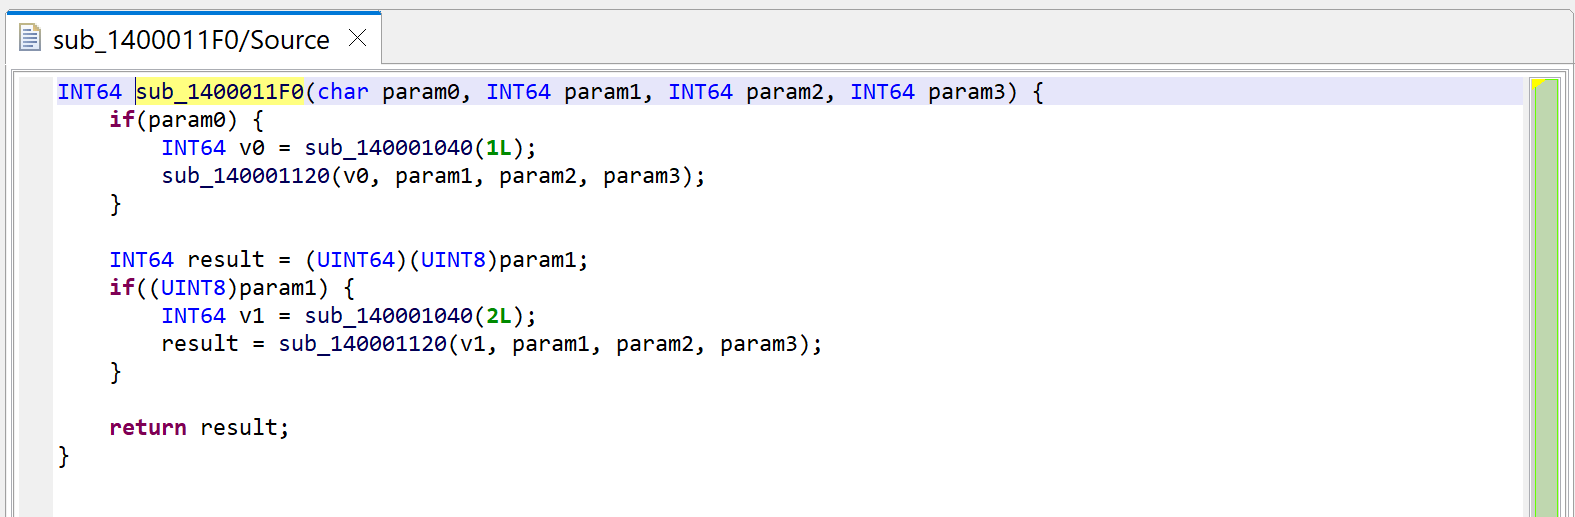
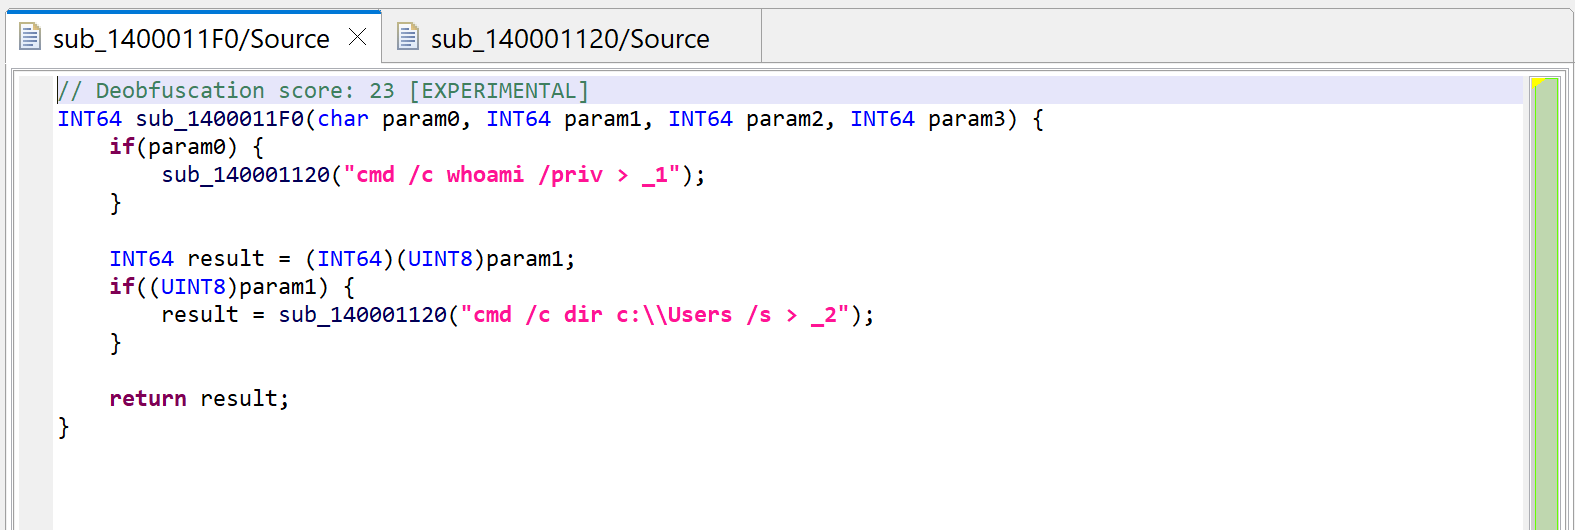
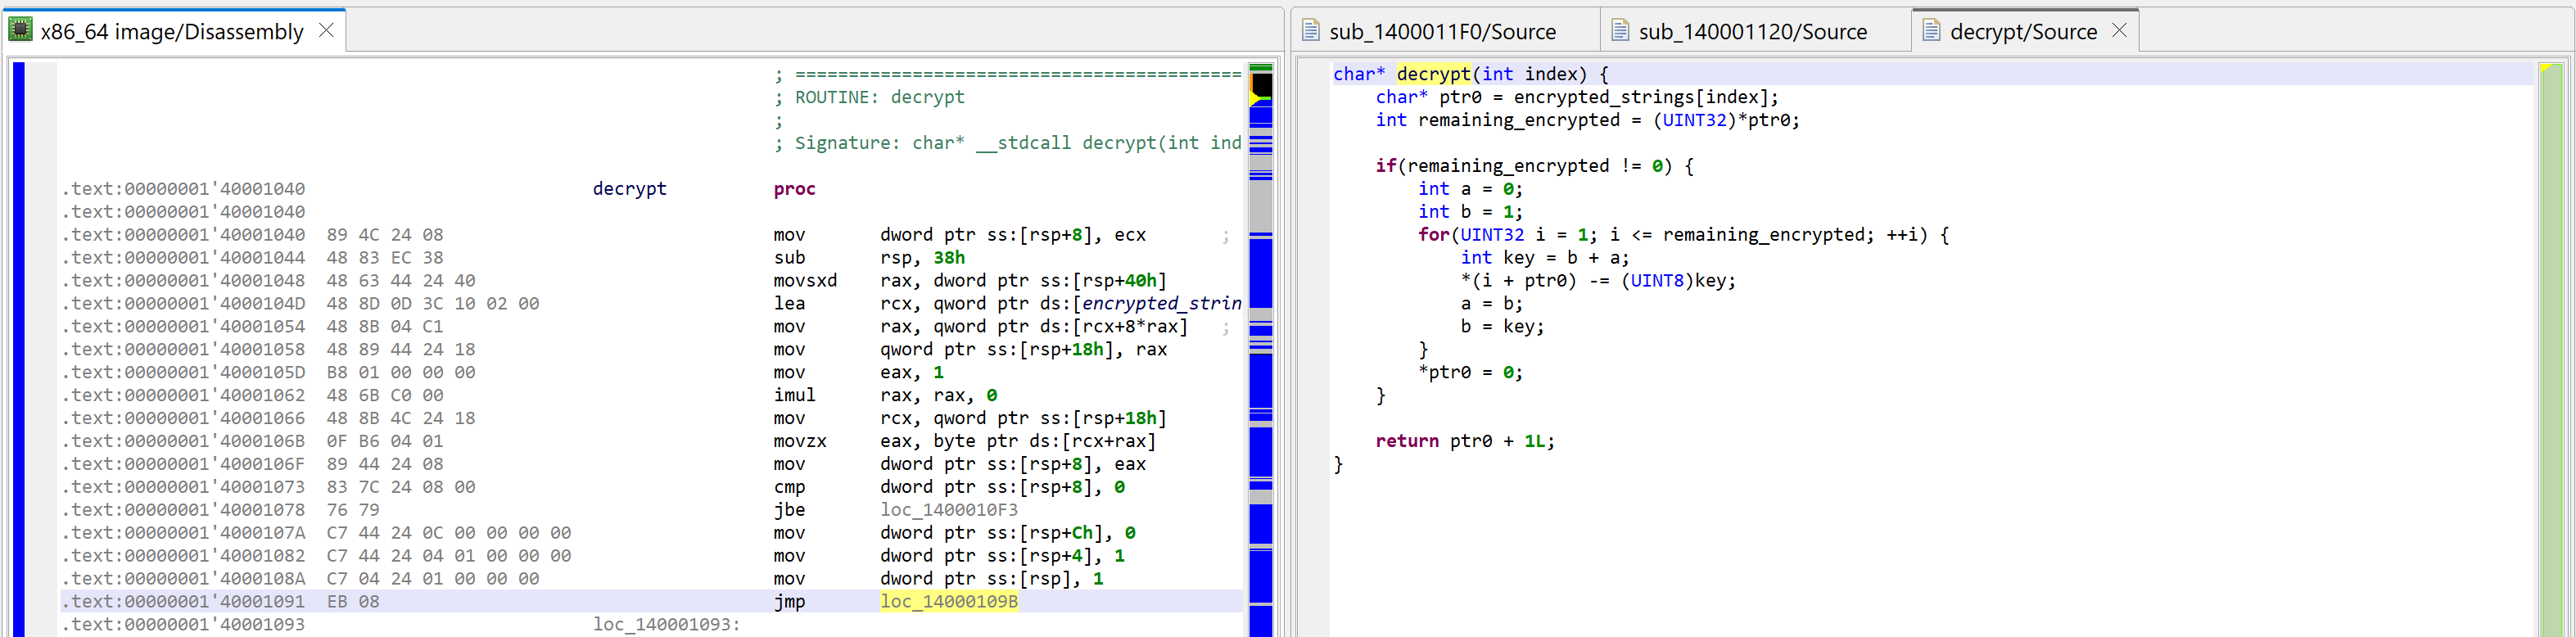
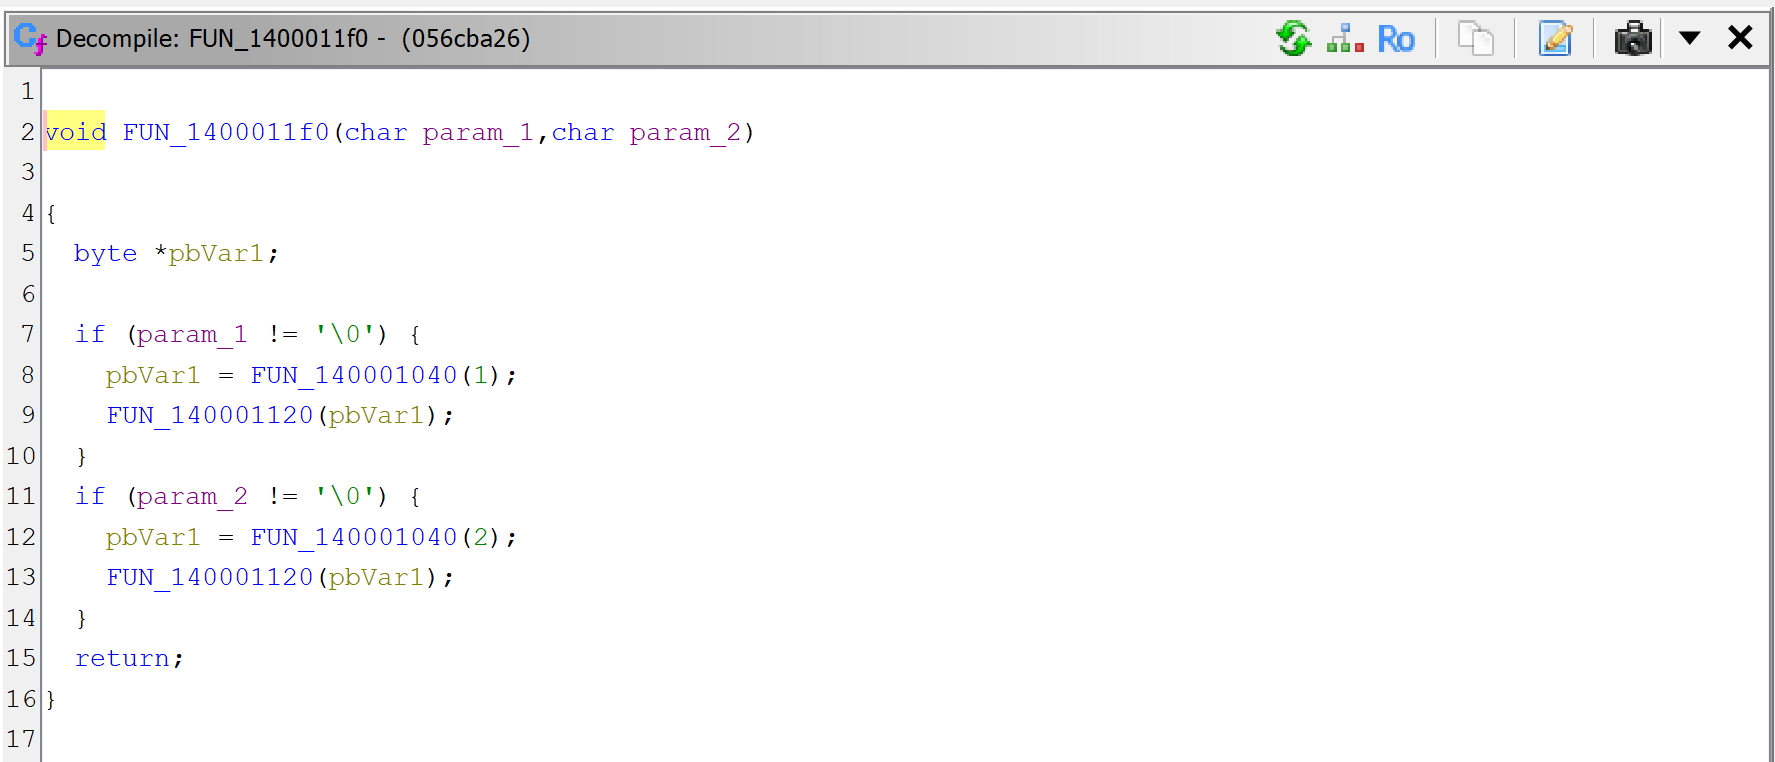
For the sake of showing what mechanism is at play, we’re first looking at sub_1400011F0. Let’s decompile it by pressing the TAB key (menu: Action, Decompile…).
Raw decompilation of sub_1400011F0, before examining its callees.
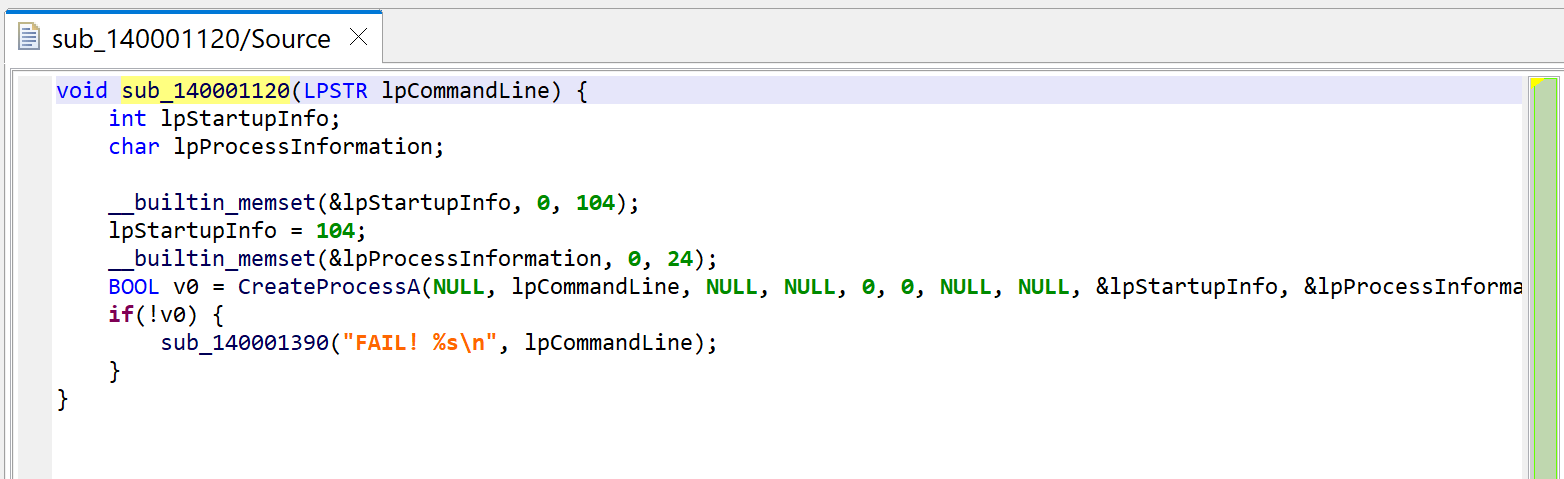
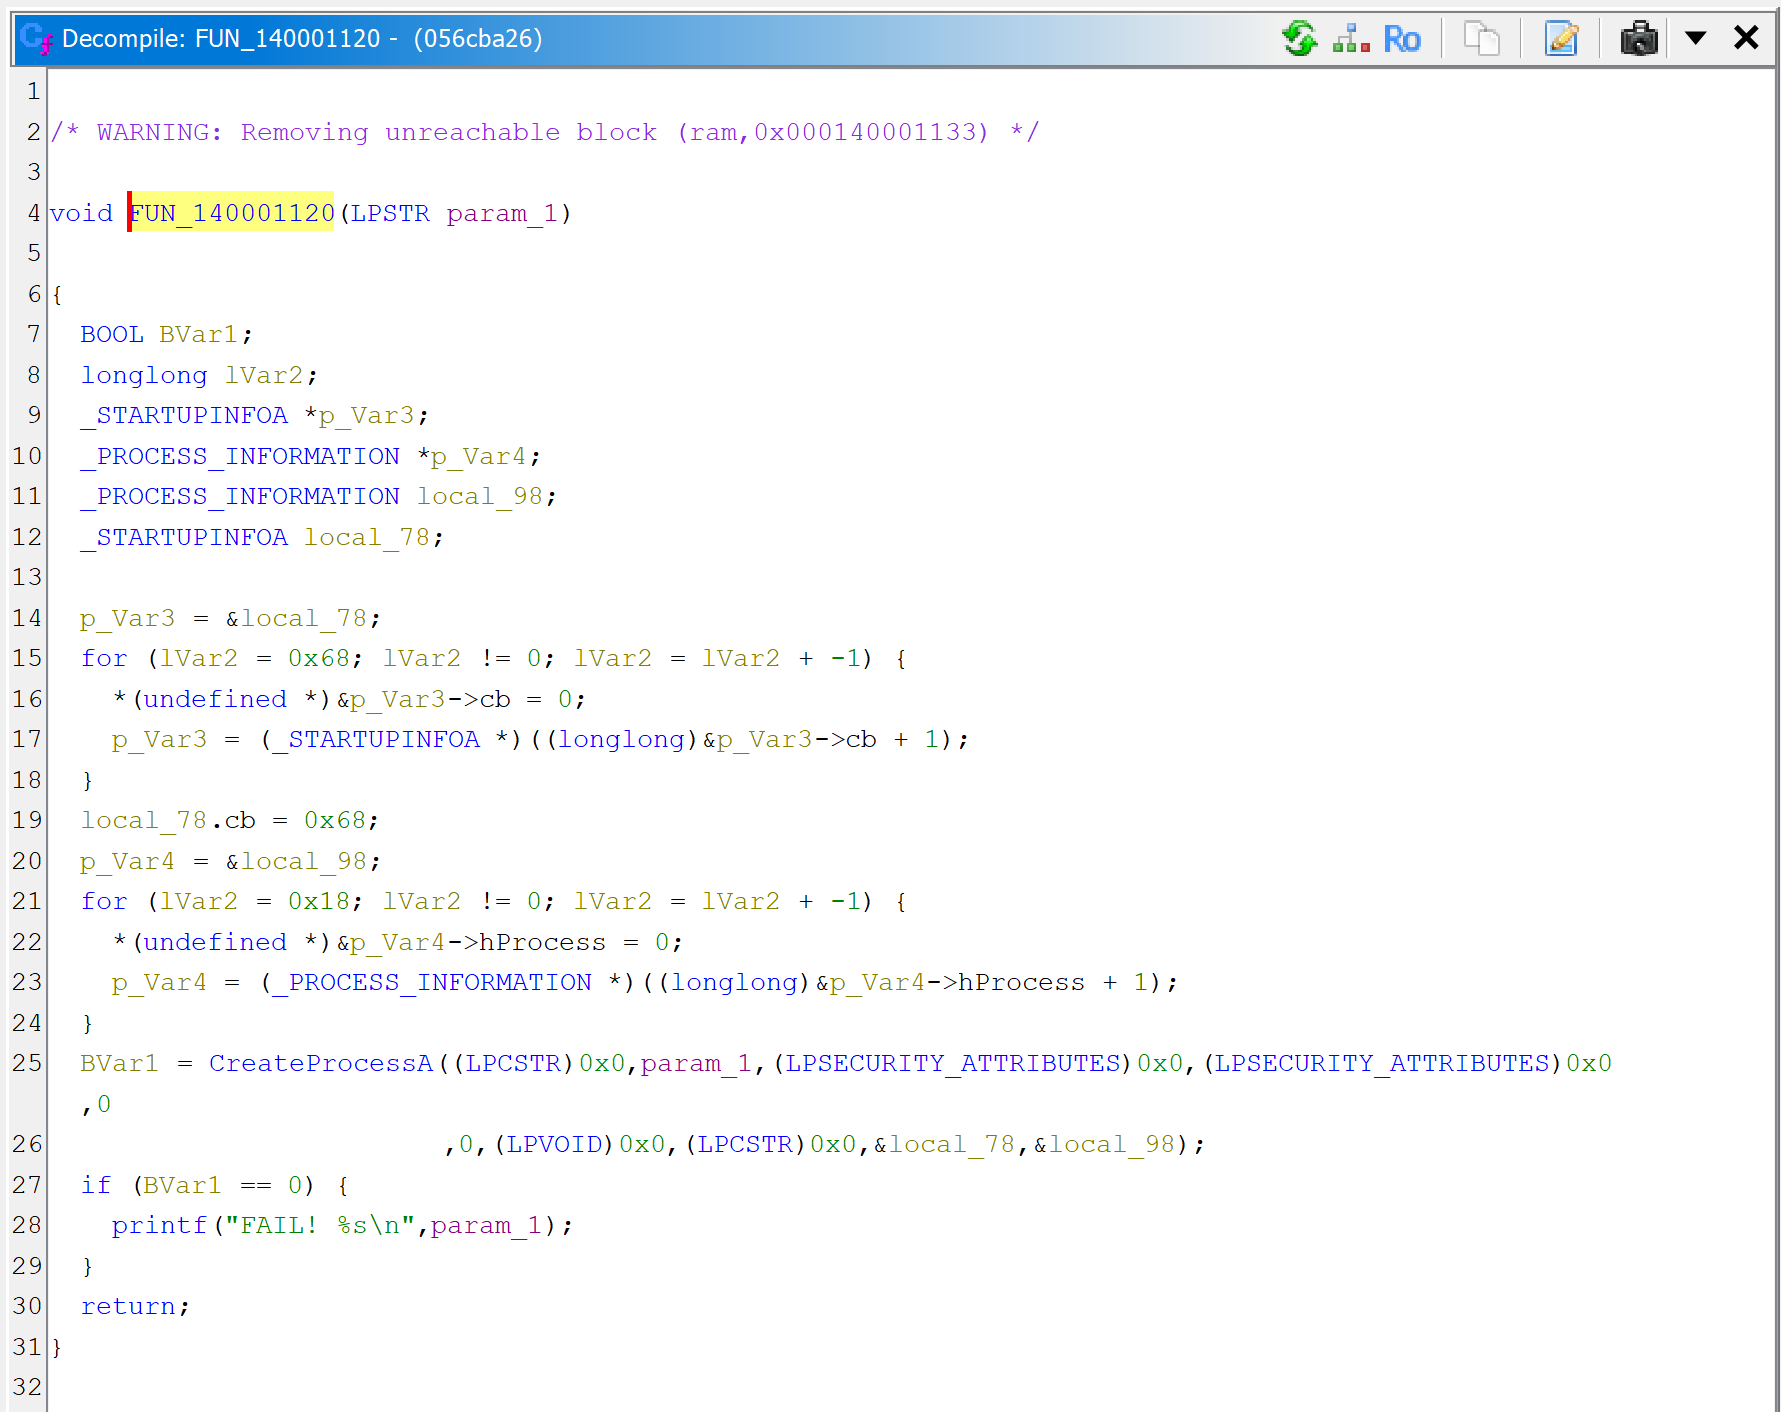
Then, let’s decompile the callee sub_140001120.
JEB can now thoroughly look at the routine and refines the initial prototype that was applied earlier, when the caller sub_1400011F0 was decompiled. It is now set to: void(LPSTR).
The code itself is a wrapper around CreateProcess; it executes the command line provided as argument.
sub_140001120 executes a command-line with CreateProcess. Note the refined prototype, void(LPSTR).
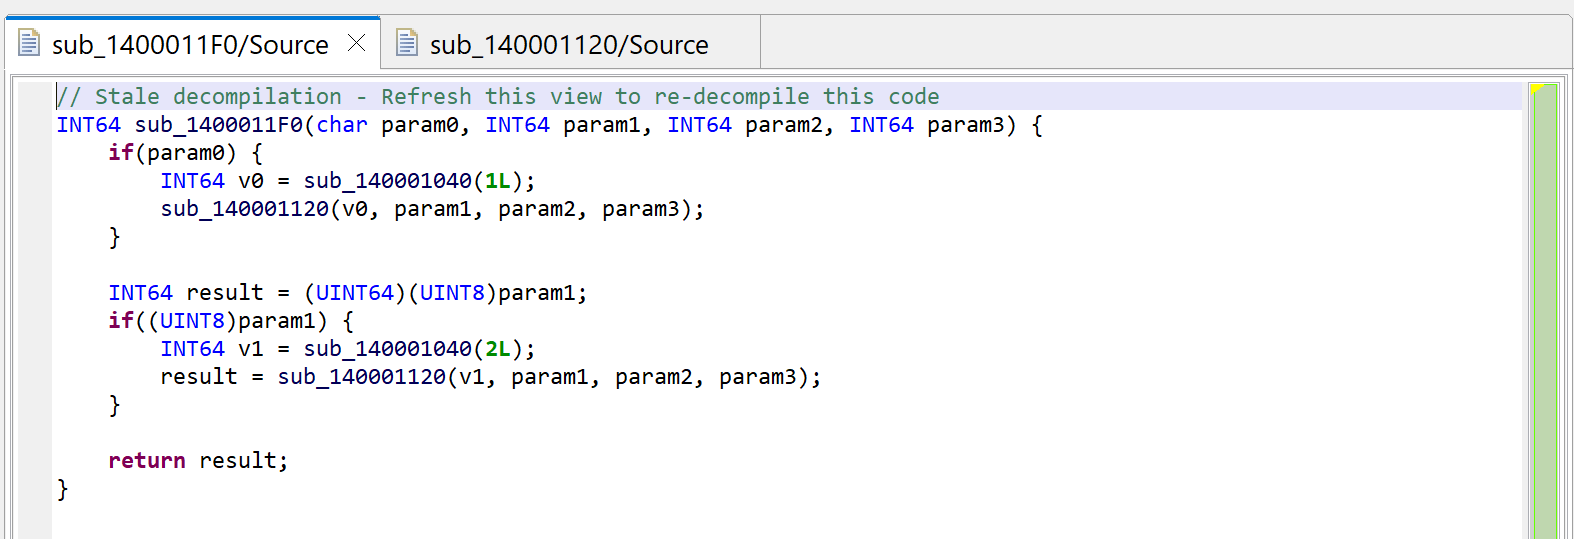
Press escape to navigate back to the caller, or alternatively, examine the callers by pressing X (menu: Action, Cross-references…) and select sub_1400011F0. You will notice that JEB is now warning us that the decompilation is “stale”.
The initial decompilation of sub_1400011F0 is stale after the decompilation of sub_140001120 yielded a better prototype.
Second decompilation
The reason is that the prototype of sub_140001120 was refined by the second decompilation (to void(LSPTR)), and the method can be re-decompiled to a more accurate version.
Let’s redecompile it: press F5 (menu: Window, Refresh). You can see that second decompilation below. What happened to the calls to sub_140001040?
Second decompilation of sub_1400011F0, showing some decrypted strings instead of calls to sub_140001040.
String auto-decryption
Notice the following:
A “deobfuscation score” note was added as a method comment (refer to part 1 of the series)
The calls to sub_140001040 are gone, they have been replaced by dark-pink strings
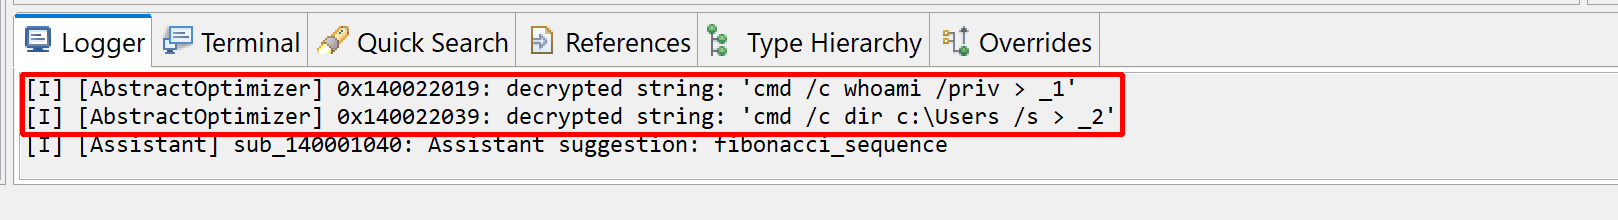
JEB also notified us in the console:
Notifications about decrypted strings replace in decompiled code.
Dark-pink strings represent synthetic strings not present in the binary itself. Here, they are the result of JEB auto-decrypting buffers by emulating the calls to routine sub_140001040, which was identified as a string provider. Indeed, the decompilation of sub_140001120 helped, since the inferred parameter LPSTR was back-propagated to the callers, which in that case, was the return value of sub_140001040.
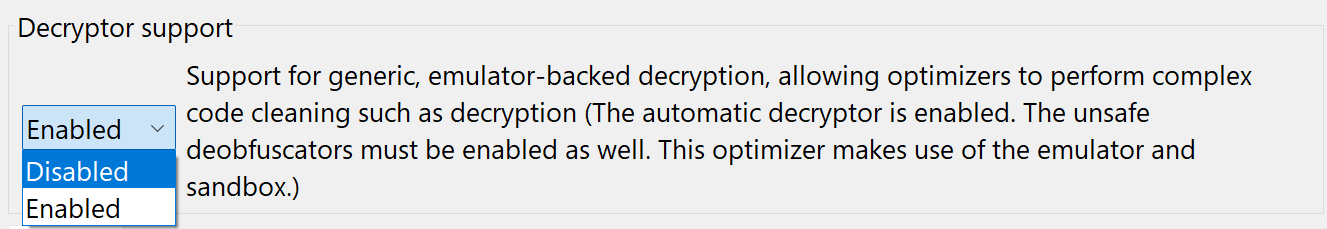
Auto-decryption can be very handy. In the case of this malware, we can immediately see what will be executed by CreateProcess: shells executing whoami and dir and redirecting outputs to files in the local folder. However, if necessary, this feature can be disabled via the “Decryptor Options” in the decompiler properties:
Menu: Options, Back-end properties… to globally disable this in the future, except for your current project
Menu: Options, Specific Project properties… for the current project only
Or you may simply redecompile the method with CTRL+TAB (menu: Action, Decompile with options…) and disable string decryptor for specific code
The string auto-decryptor may be enabled or disabled in the options
The decryptor routine
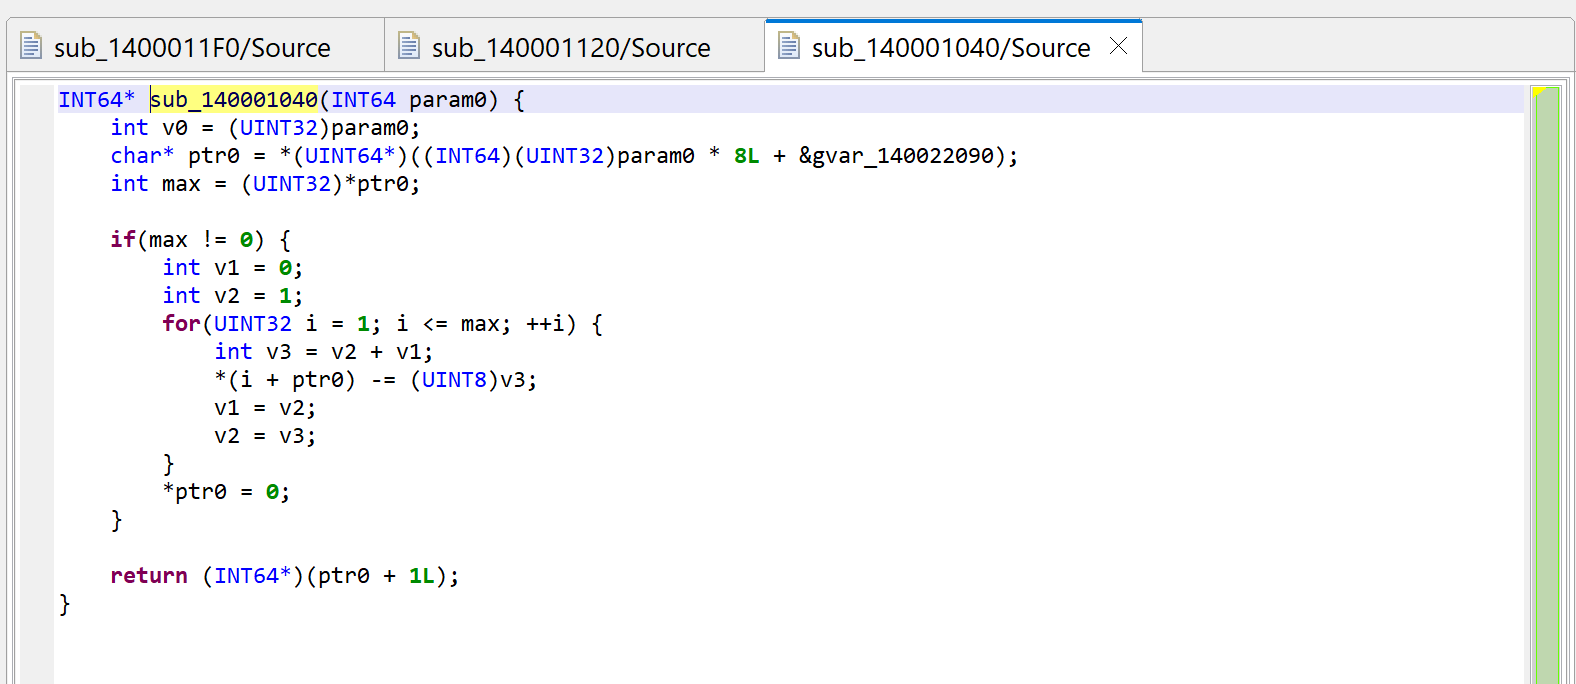
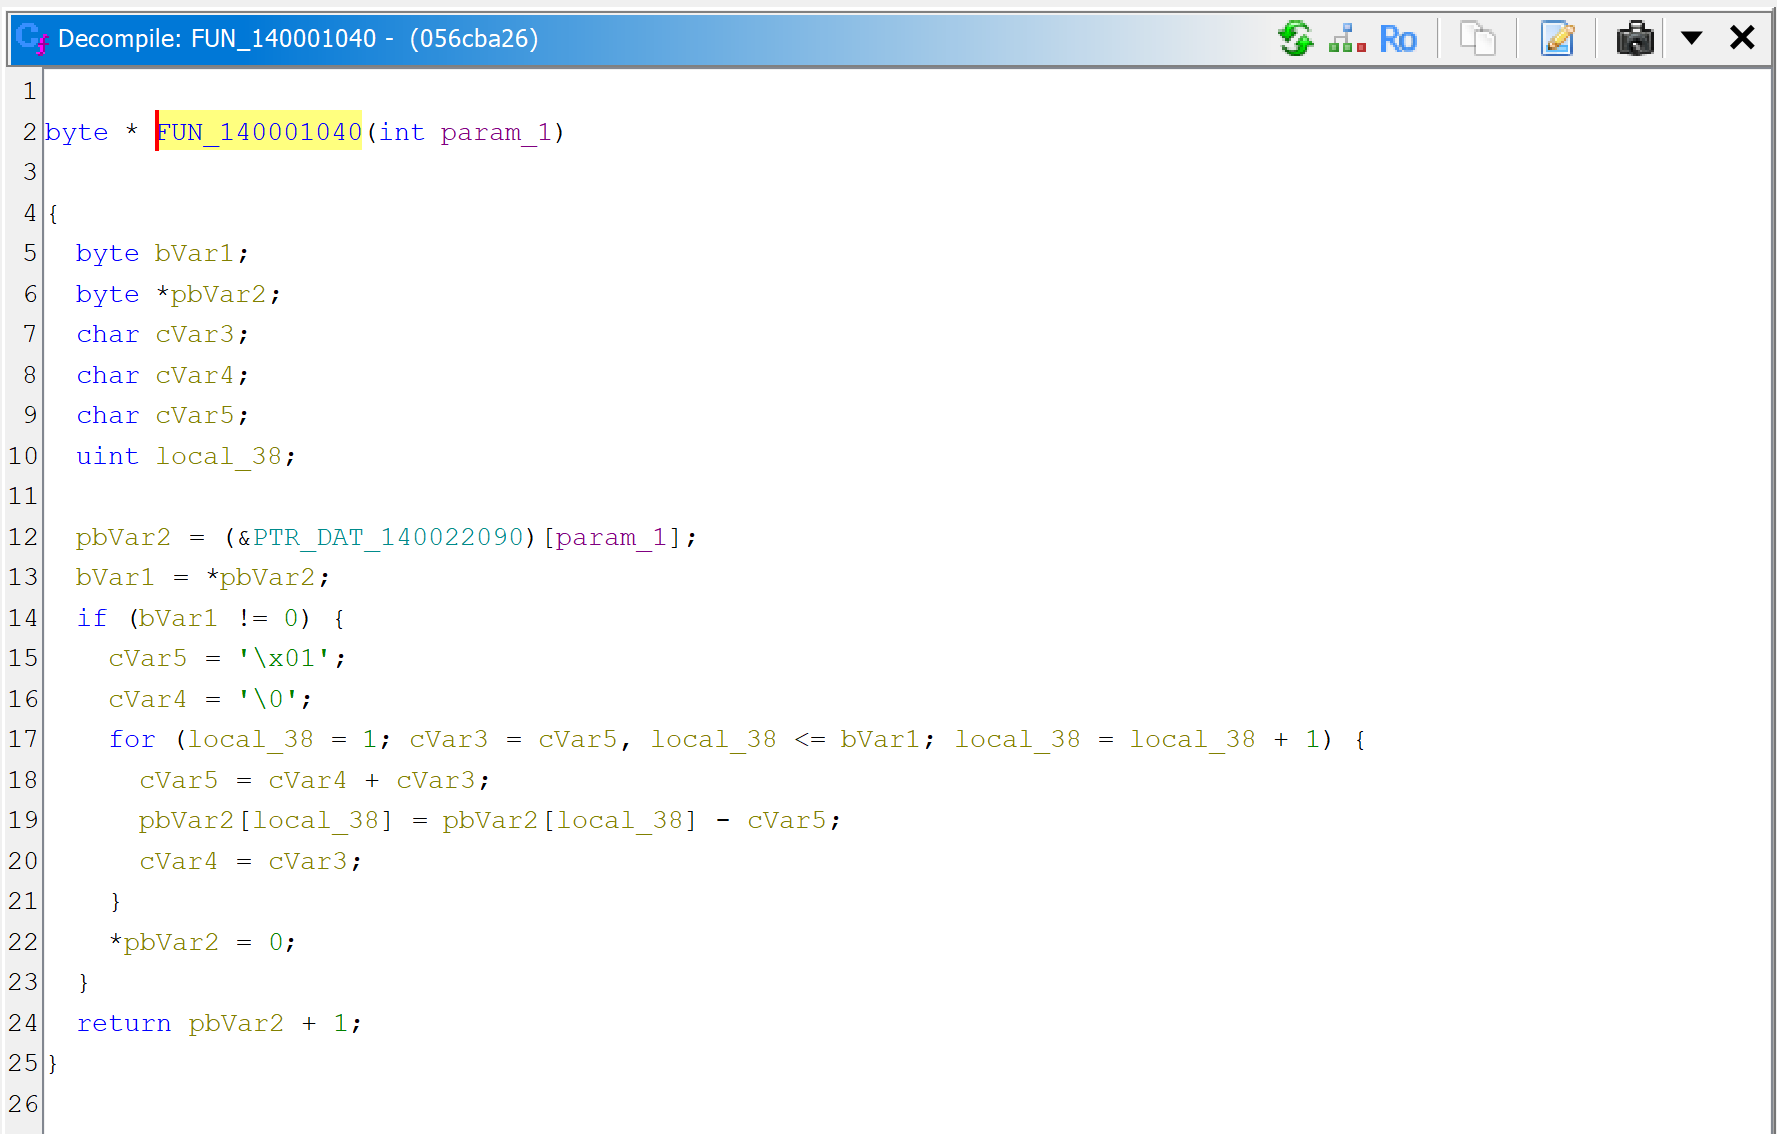
What is sub_140001040 anyway? Let’s navigate to the routine in the disassembly and decompile it.
A raw decompilation of the decryptor code, sub_140001040
After examination of the code, we can adjust things slightly:
The global gvar_140022090 is an array of PCHAR (double-click on the item; rename it with N; change the type to a PCHAR using Y; create an array from that using the * key).
The prototype is really PCHAR(int), we can adjust that with Y.
The first byte of an entry into encrypted_strings is the number of encrypted bytes remaining in the string; if 0, it is fully decrypted and subsequent calls will not attempt to decrypt bytes again.
The key variable is v3 is the key; let’s rename it with N. Note that the key at (i) is the sum of the previous two keys used by indices (i-1), (i-2); the initial tuple is (0, 1). This looks like a Fibonacci sequence.1
The decryptor (sub_140001040) after analysis.
Comparison with GHIDRA
For comparison sake, here are GHIDRA 11 decompilations.
The caller (sub_1400011F0) decompiled by GHIDRA 11.0.The decryptor (sub_140001040) decompiled by GHIDRA 11.0.The CreateProcess wrapper (sub_140001120) decompiled by GHIDRA 11.0. Notice that the low-level structure initialization code adds quite a bit of confusion.
Conclusion
JEB decompilers2 do their best to clean-up and restore code, and that includes decrypting strings when it is deemed reasonable and safe.
That concludes our second entry in this “How to use JEB” series. In the next episodes, we will look at other features and how to write interesting IR and AST plugins to help us further deobfuscate and beautify decompiled code.
As always, thank you for your support, and happy new year 2024 to All 😊 – Nicolas
–
Interestingly, the JEB assistant (call it with the BACKTICK key, or menu: Action, Request Assistant…) would like to rename this method to “fibonacci_sequence“! Not quite it, but that’s a relevant hint!) ↩
Note the plural: dexdec – the Dex decompiler – has had string auto-decryption via emulation for a while; its users are well-accustomed to seeing dark-pink strings in deobfuscated code! ↩
We’re kicking off a malware analysis series explaining how to use JEB Decompiler to perform reverse engineering tasks ranging from out-of-the-box actions to complex use cases requiring scripts or custom plugins.
In this first entry, we look at a Windows malware compiled for x86 32-bit targets. The malware is an Ethereum cryptocurrency stealer. It monitors and intercepts clipboard activity to find and replace wallet addresses by an address of its own — presumably, one controlled by the malware authors to collect stolen ether.
Quick look at the malware
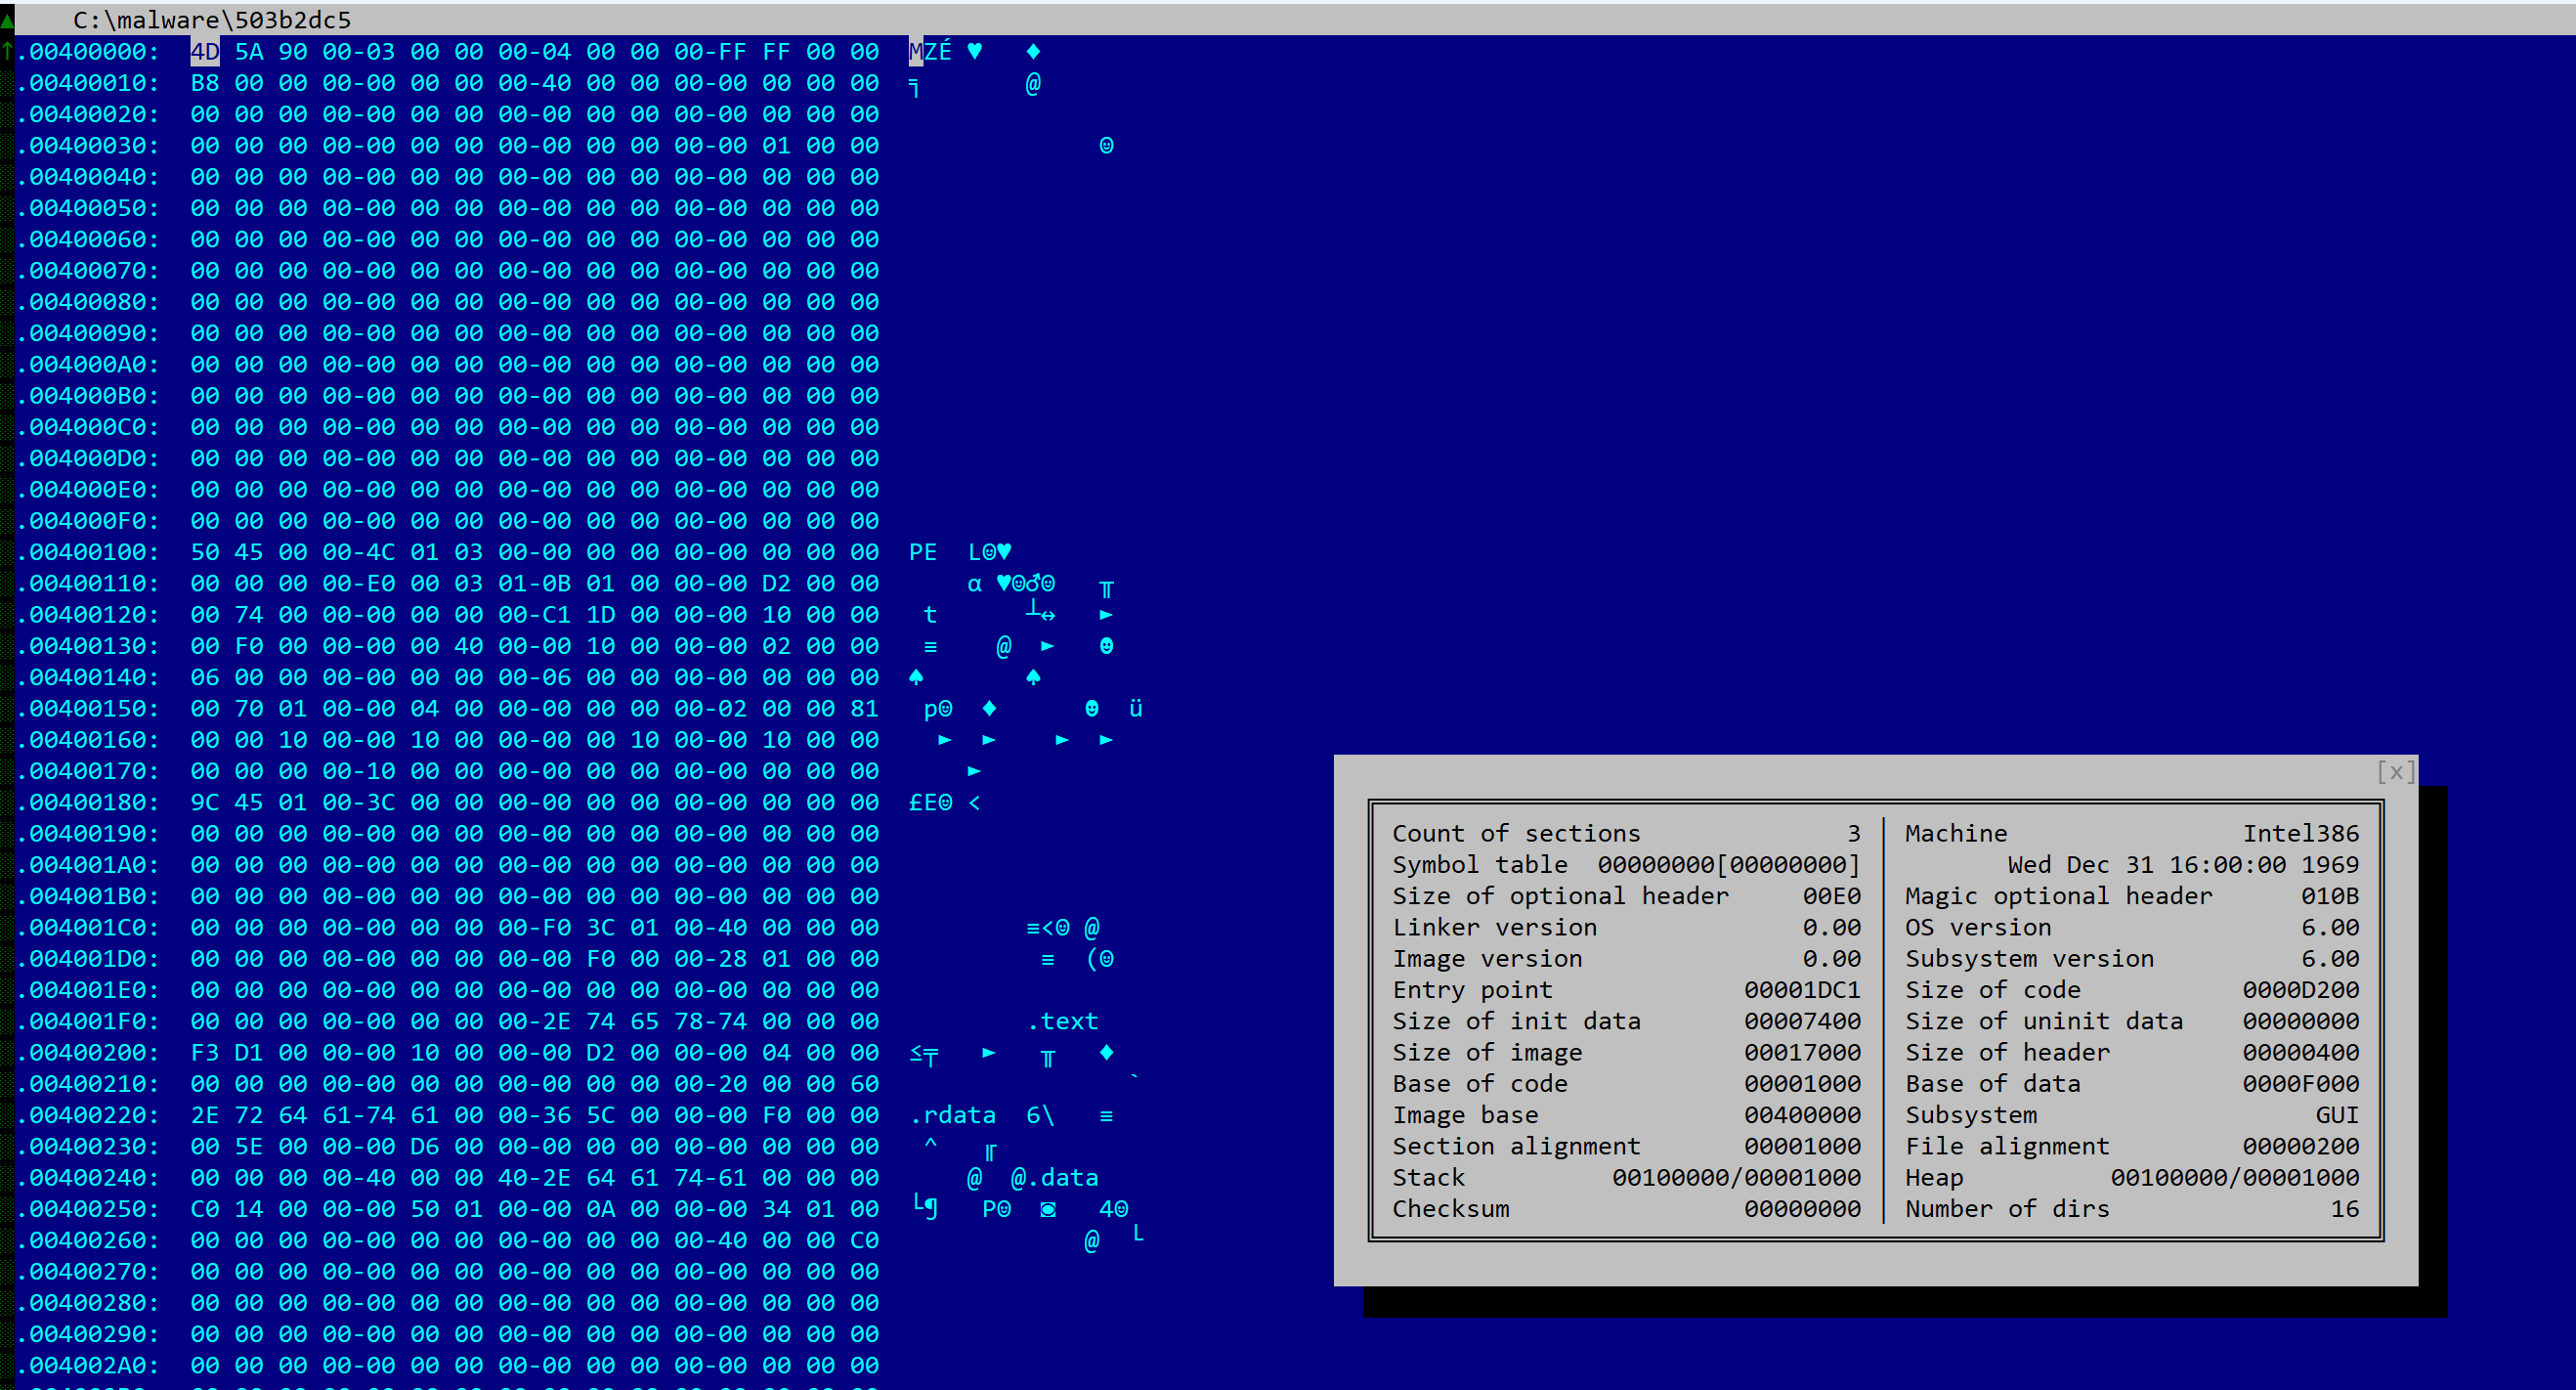
The file has a size of 81Kb, is compiled for x86 platforms. Although it does not appear to be packed, most metadata elements of the PE header were scraped. There is no rich data or timestamp.
If you are familiar with JEB, its terminology, and the organization of its UI elements, you may skip the next section and go directly to “Examining the code”.
Opening the file in JEB
Let’s fire up JEB. Any recent build (5.7+) with the x86 analysis modules and decompiler will do, i.e. JEB Community Edition or JEB Pro.
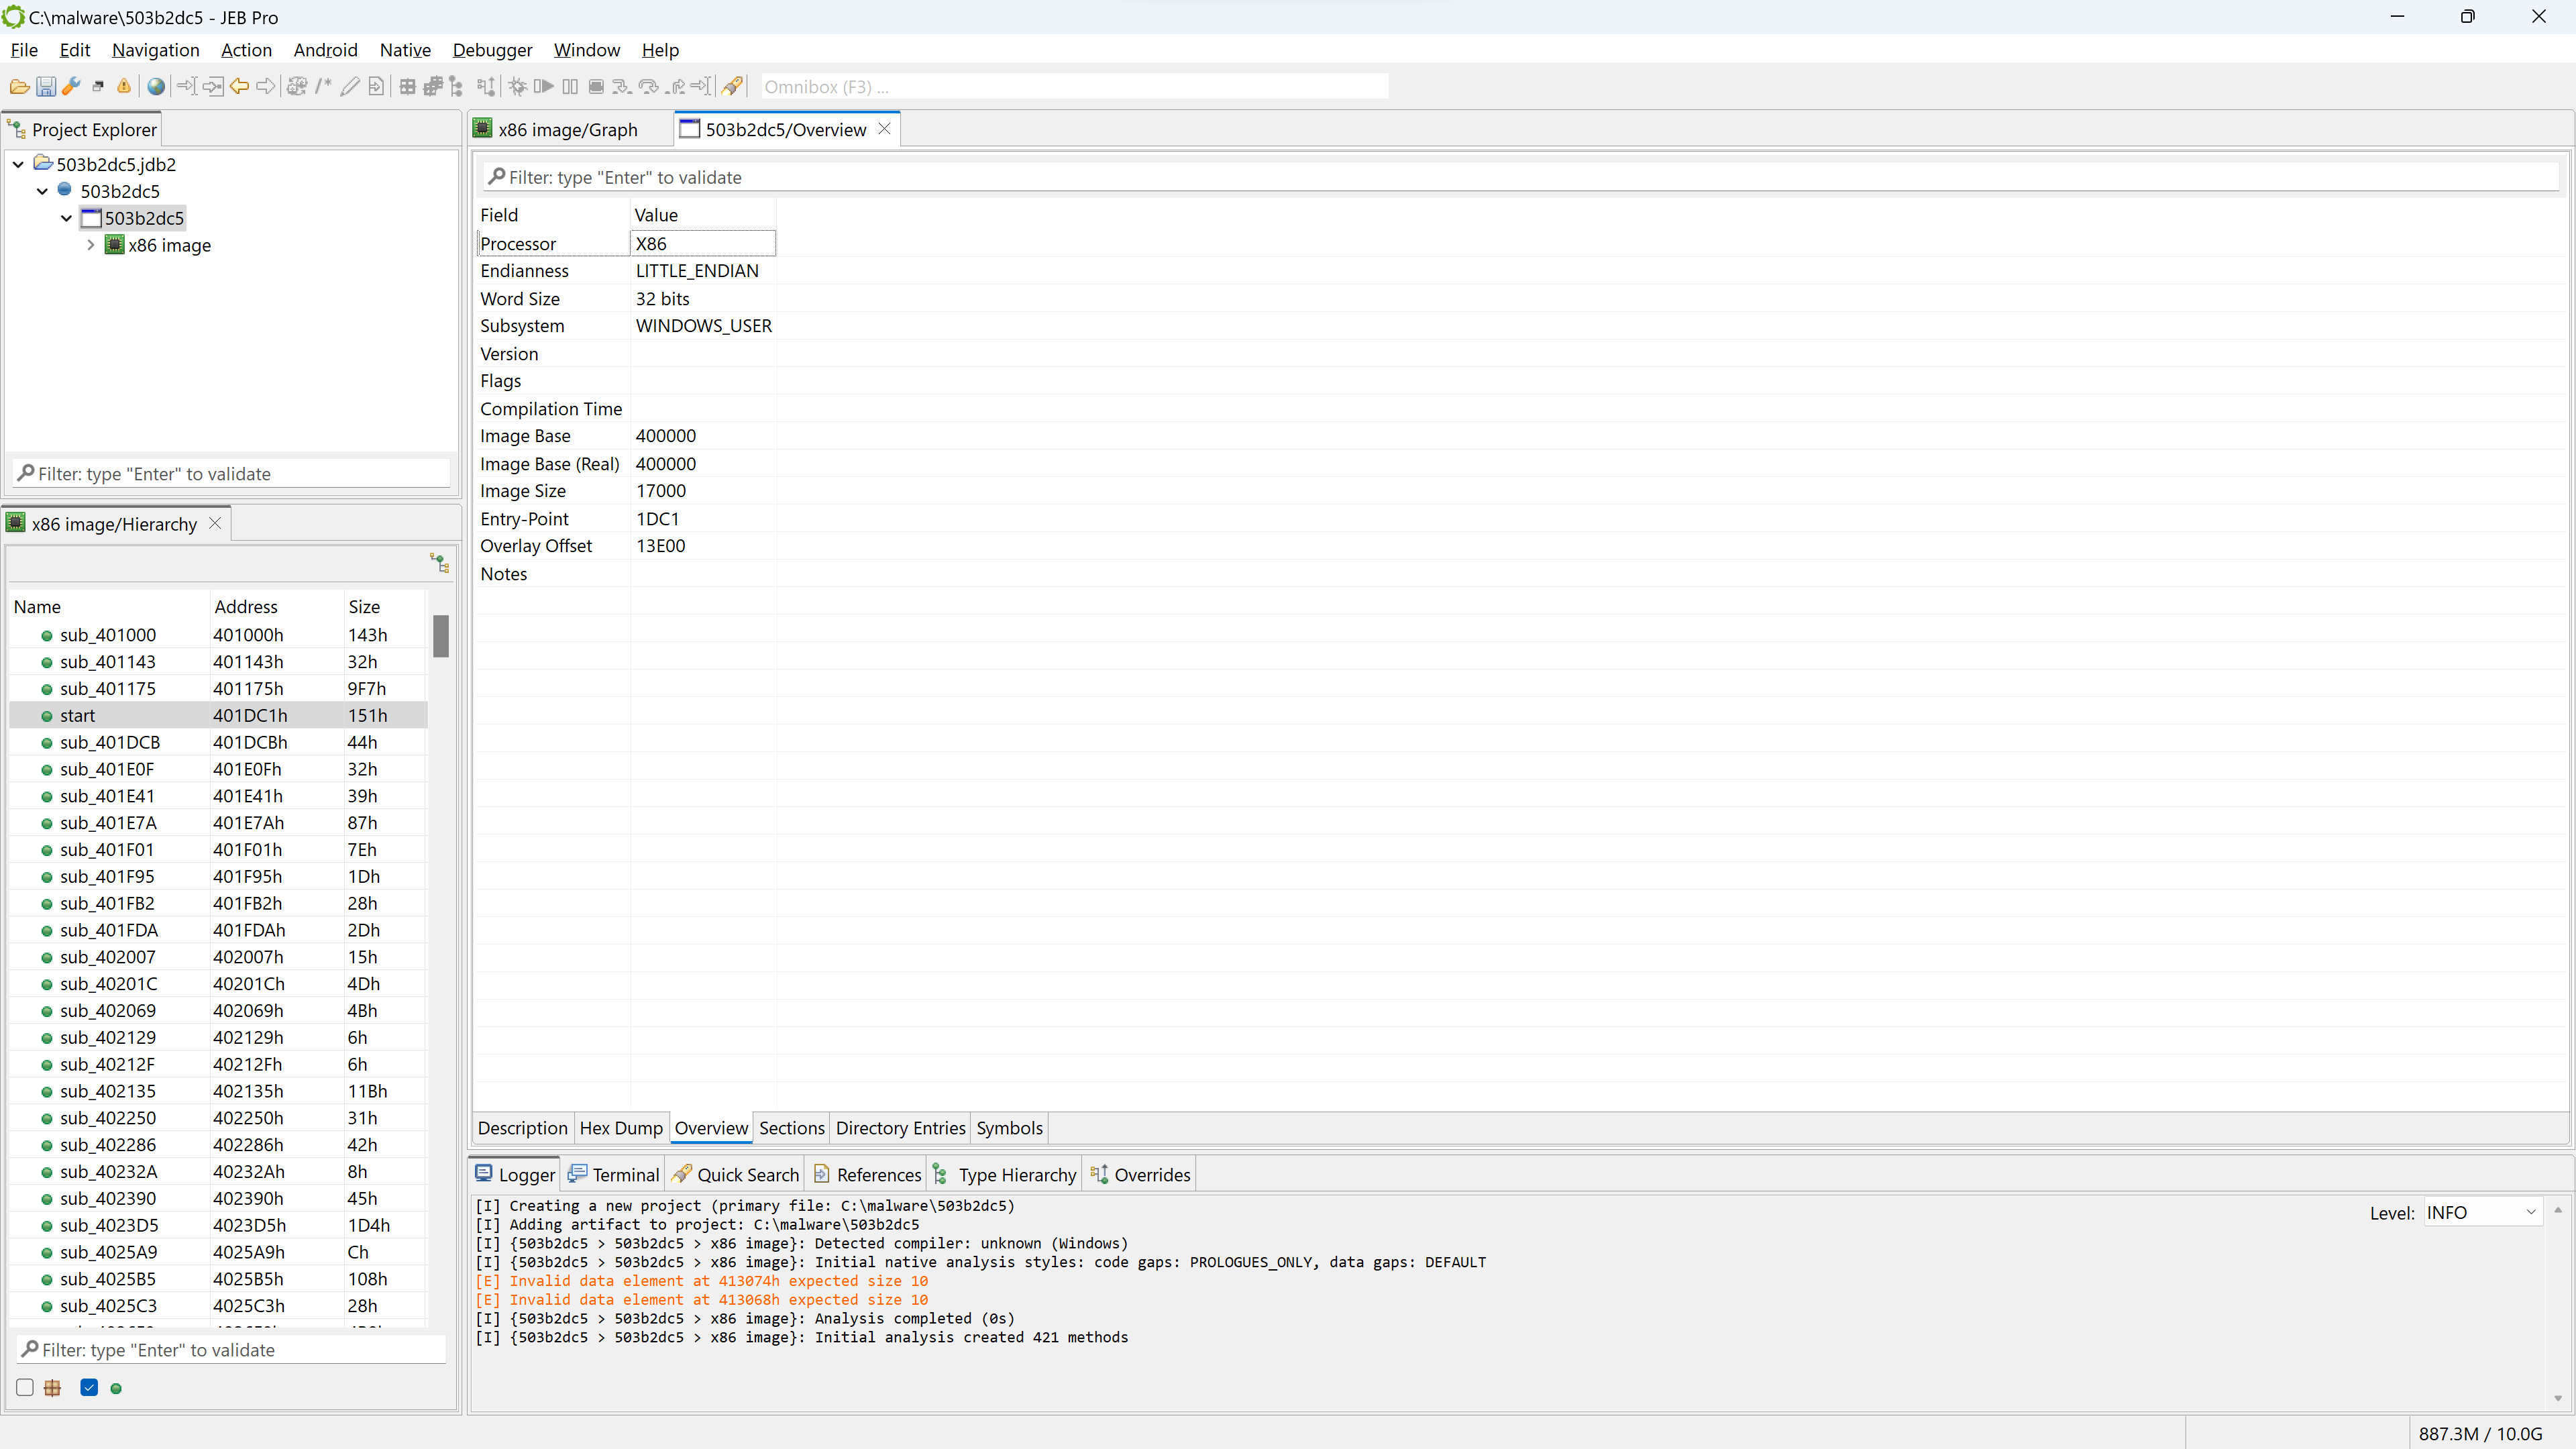
We open the file and keep the default settingsA view of the GUI after the initial analysis (from top-left, clockwise: project explorer, main workspace, and code hierarchy)
Project and units
The top-left view shows the project, along with a single artifact (the input file) and the analysis units created by JEB:
The artifact file has a blue-round icon
The top-level unit is a winpe unit
It has one child unit at the moment, named “x86 image”, of type x86.
The bottom-left view shows a list of code routines resulting from the analysis of the file.
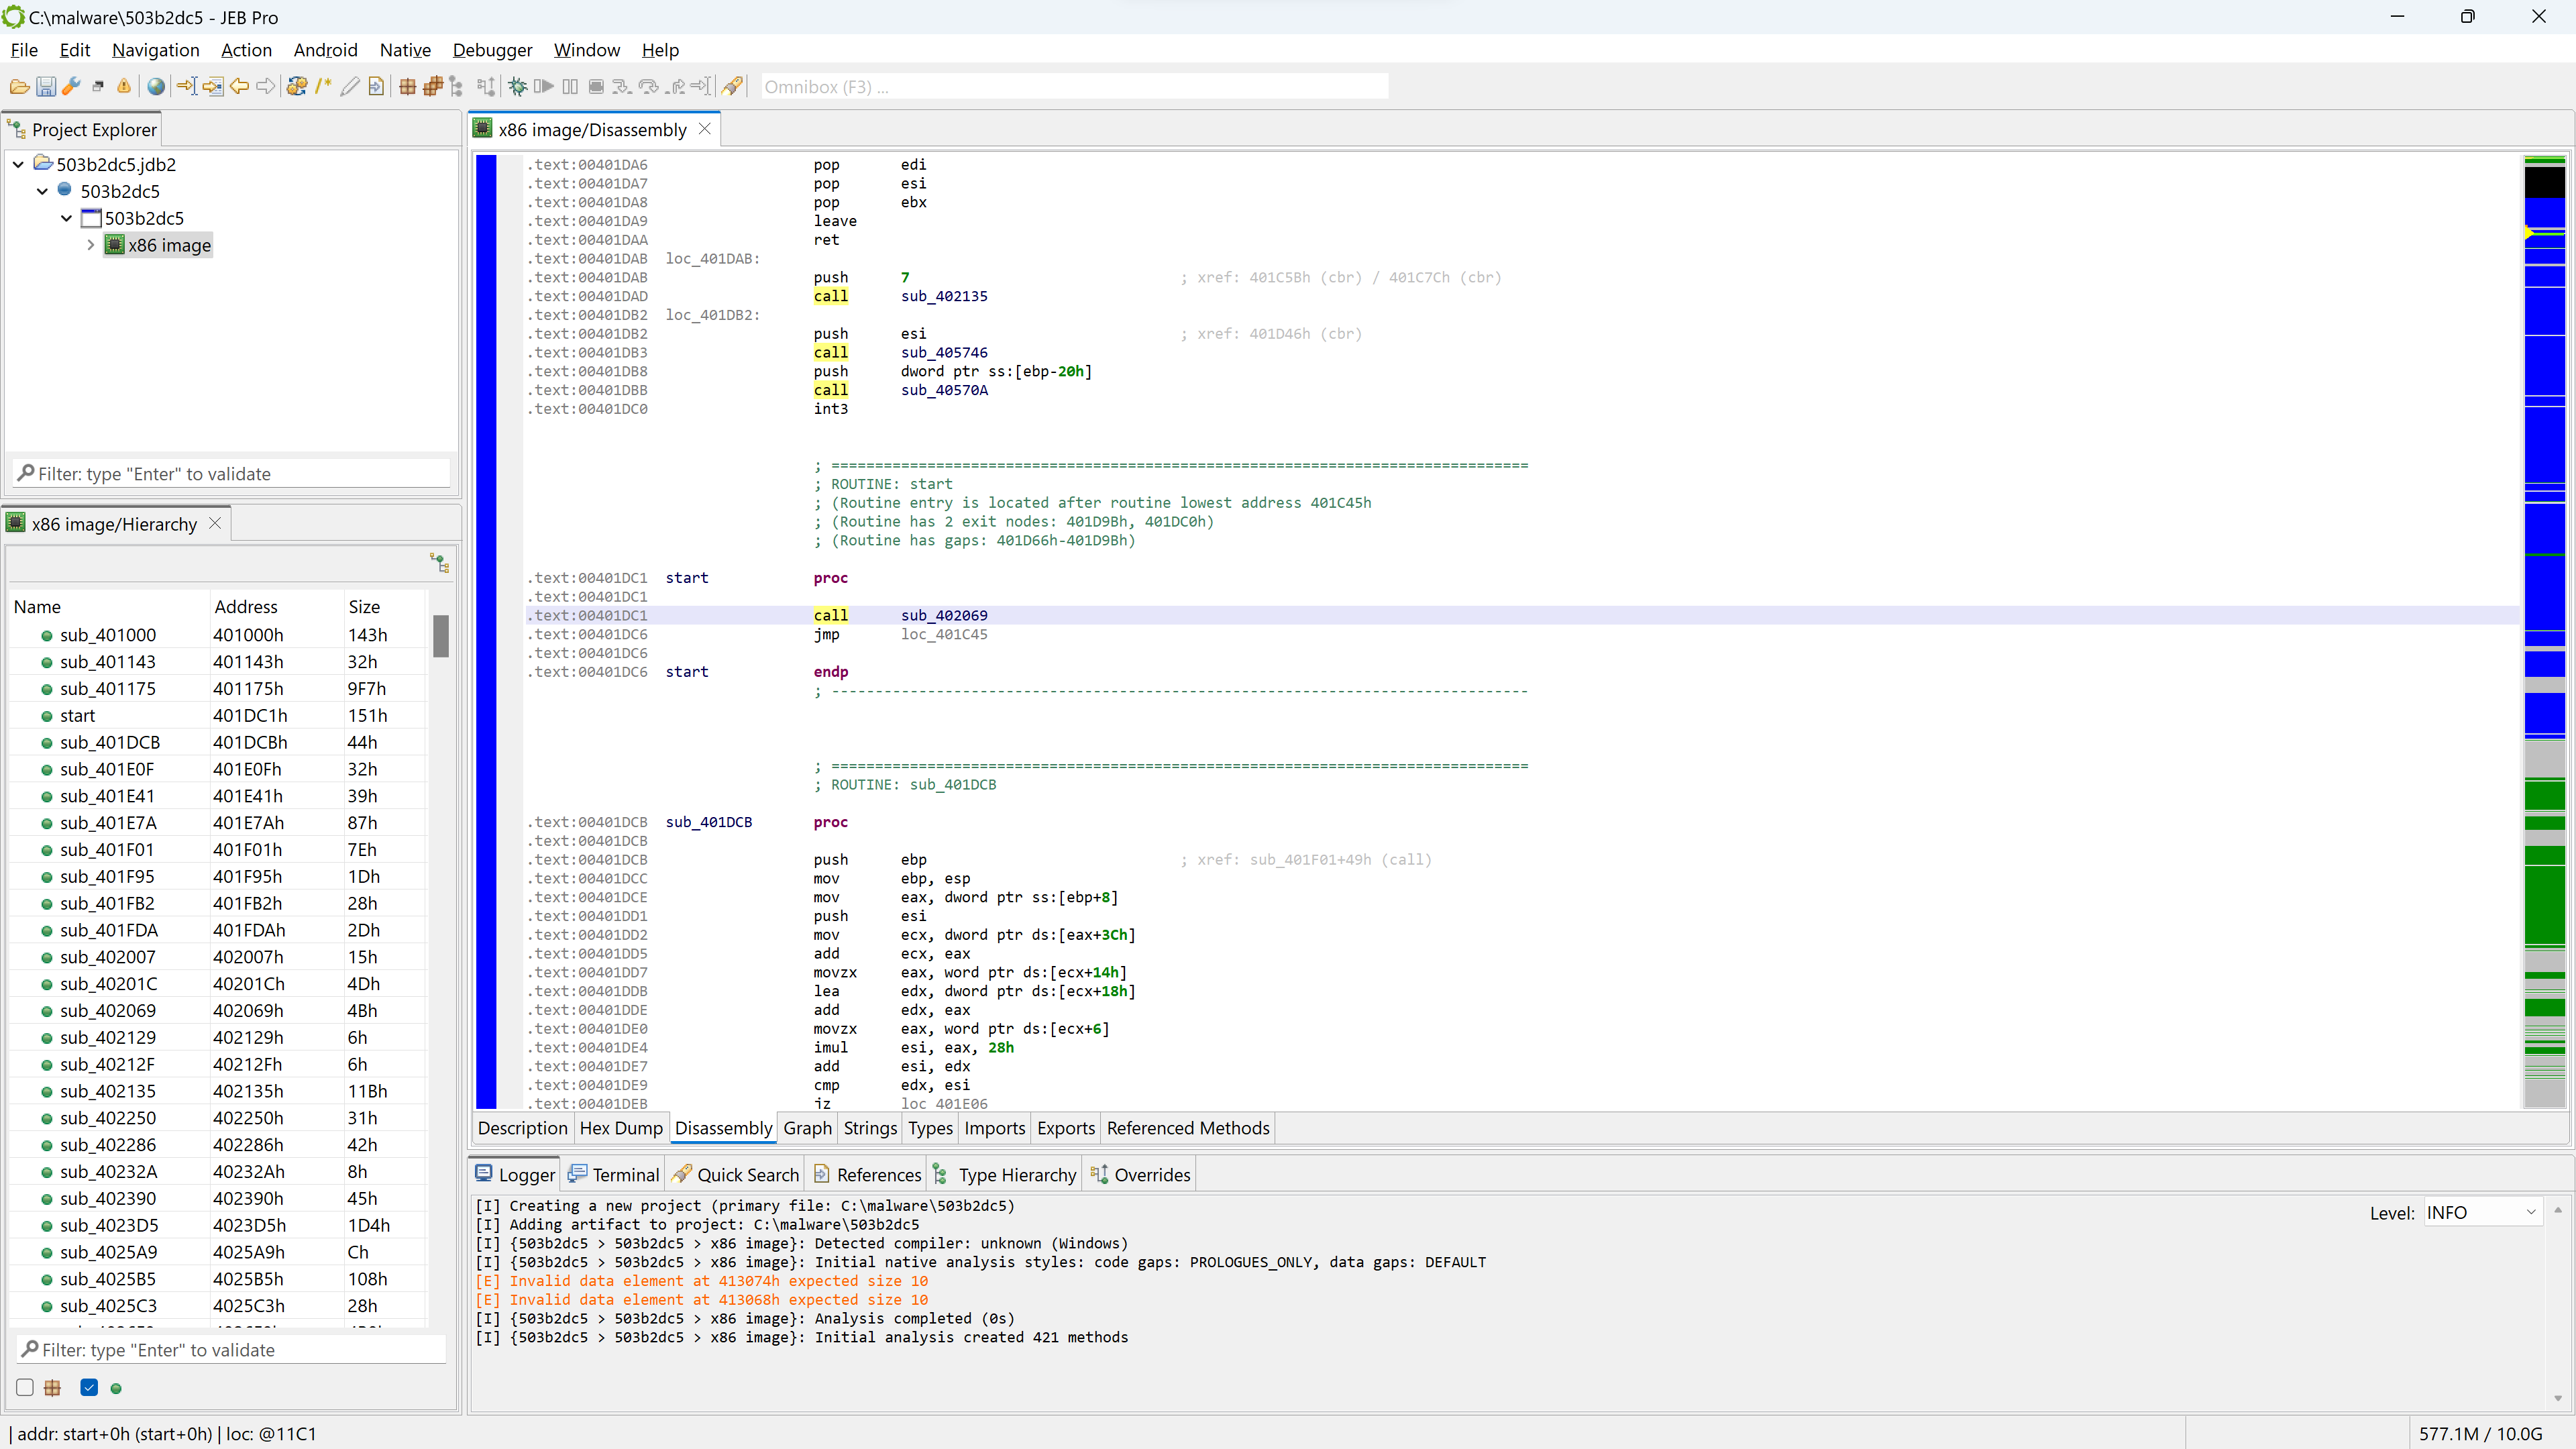
Disassembly
By default, the main panel shows the disassembly window.
You may press the SPACE bar to switch to a graph view of the code (menu: Action, Graph…). In the graph view, only a single method is rendered at a time.
CFG (control flow graph) view of a disassembled routine
PE unit
If you wish to have a look at the PE file in more details, open the winpe unit. Double-click the corresponding node in the project hierarchy.
View of a winpe unit’s “Overview” fragment
The winpe unit view provides several information, organized in fragments that can be seen below the unit view: Description, Hex Dump, Overview (the default fragment), Sections, Directory Entries, Symbols, etc.
Note that if the PE had not been stripped, we would probably see a compilation timestamp as well as additional sub-units detailing the Rich Header data. For Windows executables, that data is important to perform fine-grained compiler identification.
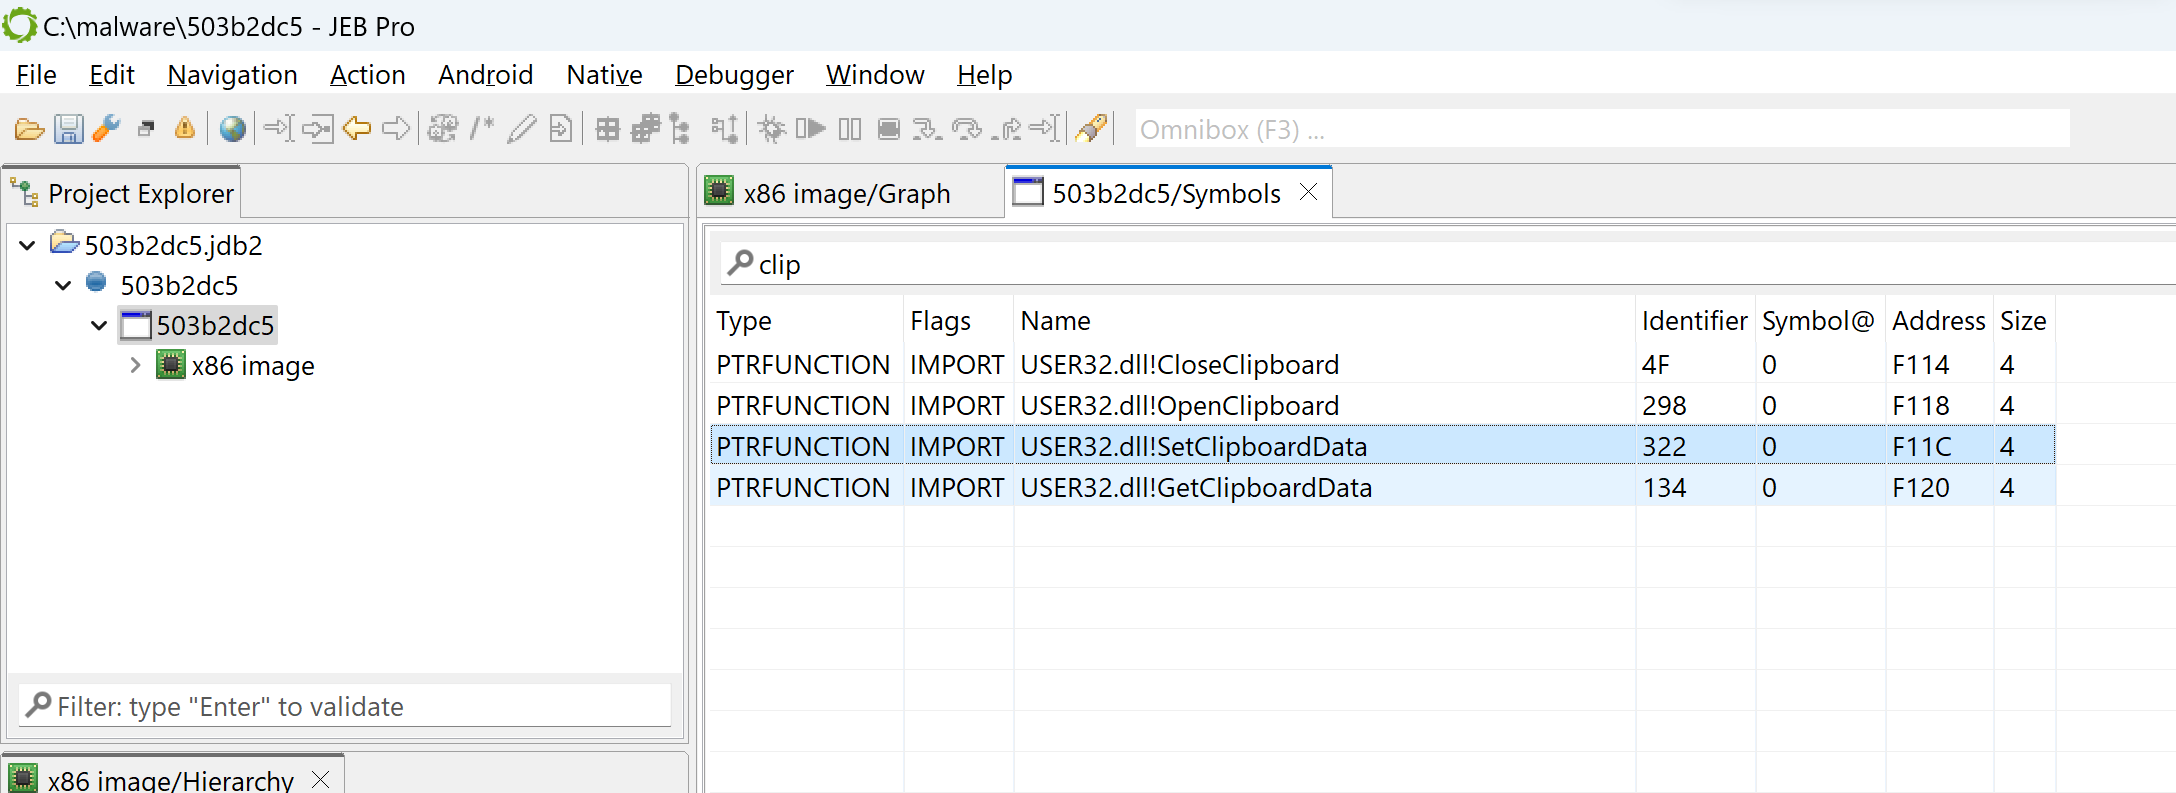
The Symbols tab lists all symbols advertised by the PE, including imported and exported routines. For example, if you filter on “clip”, you can see multiple win32 routines relating to clipboard access, such as OpenClipboard or SetClipboardData:
The Symbols fragment of the winpe unit view, with a filter applied (“clip”)
Examining the code
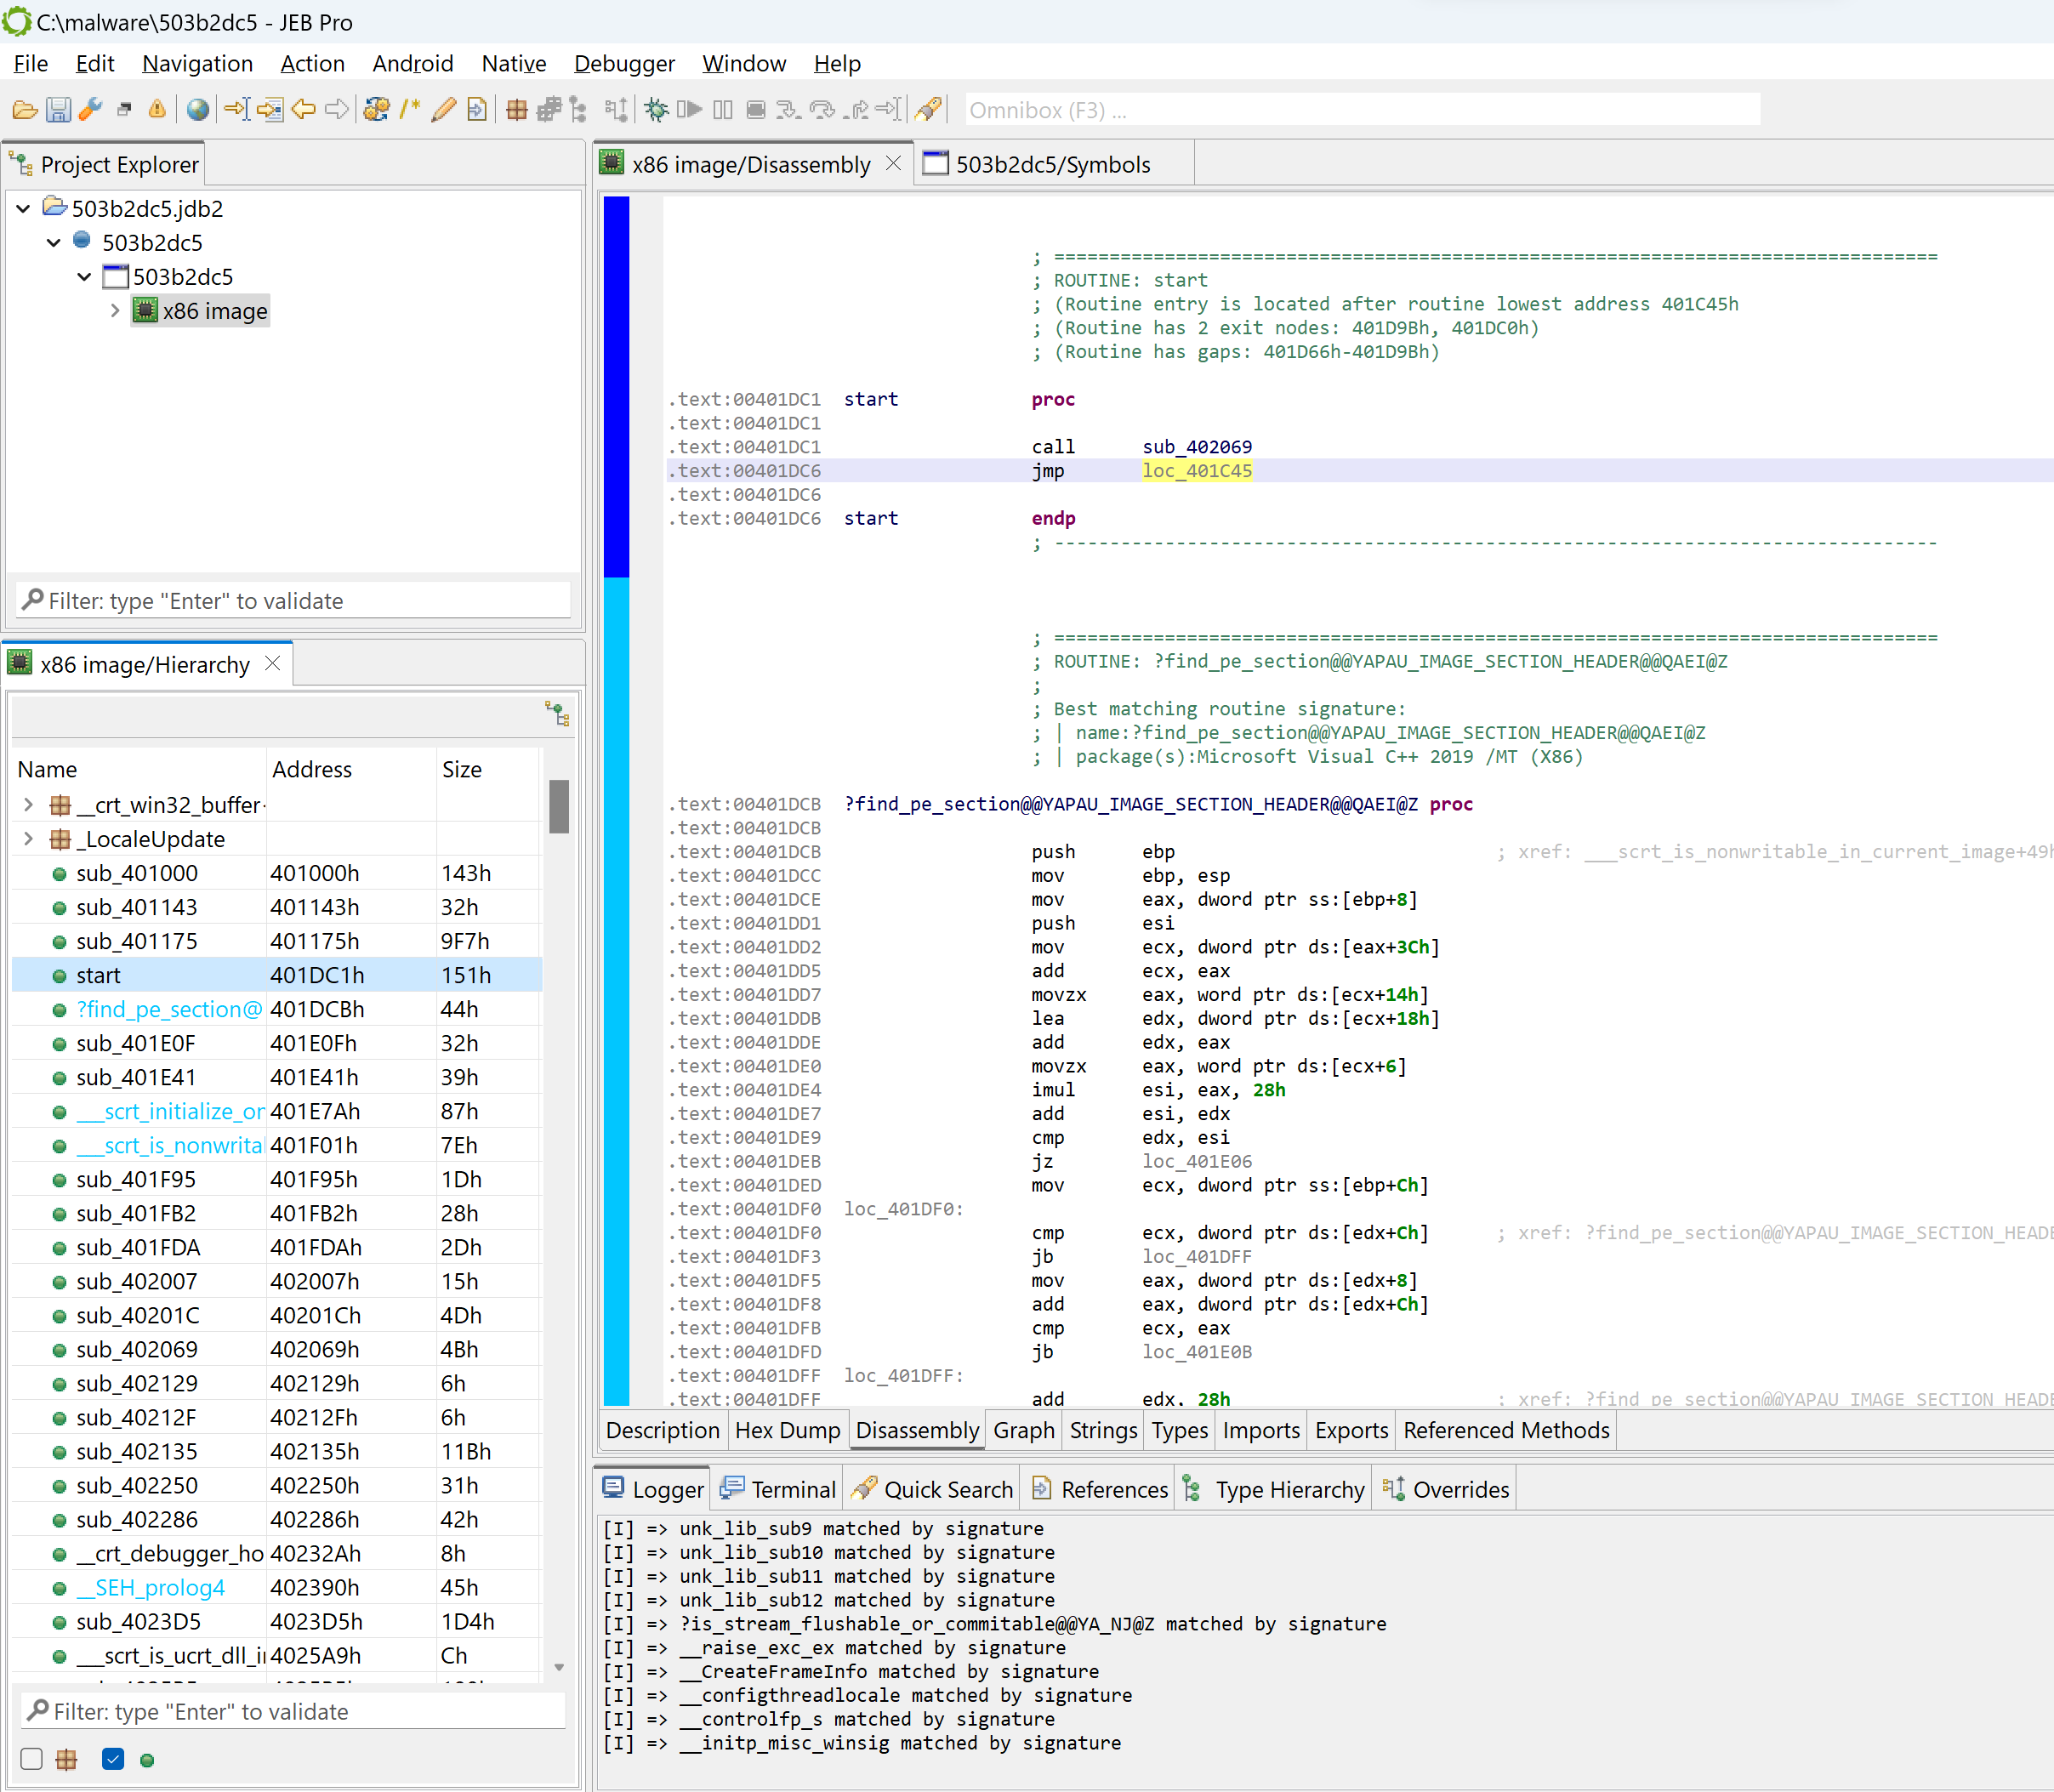
Let’s go back to the disassembly offered by the x86 unit. First, notice that the code hierarchy view does not seem to contain well-known methods (static code), typically standard library routines linked at compile-time.
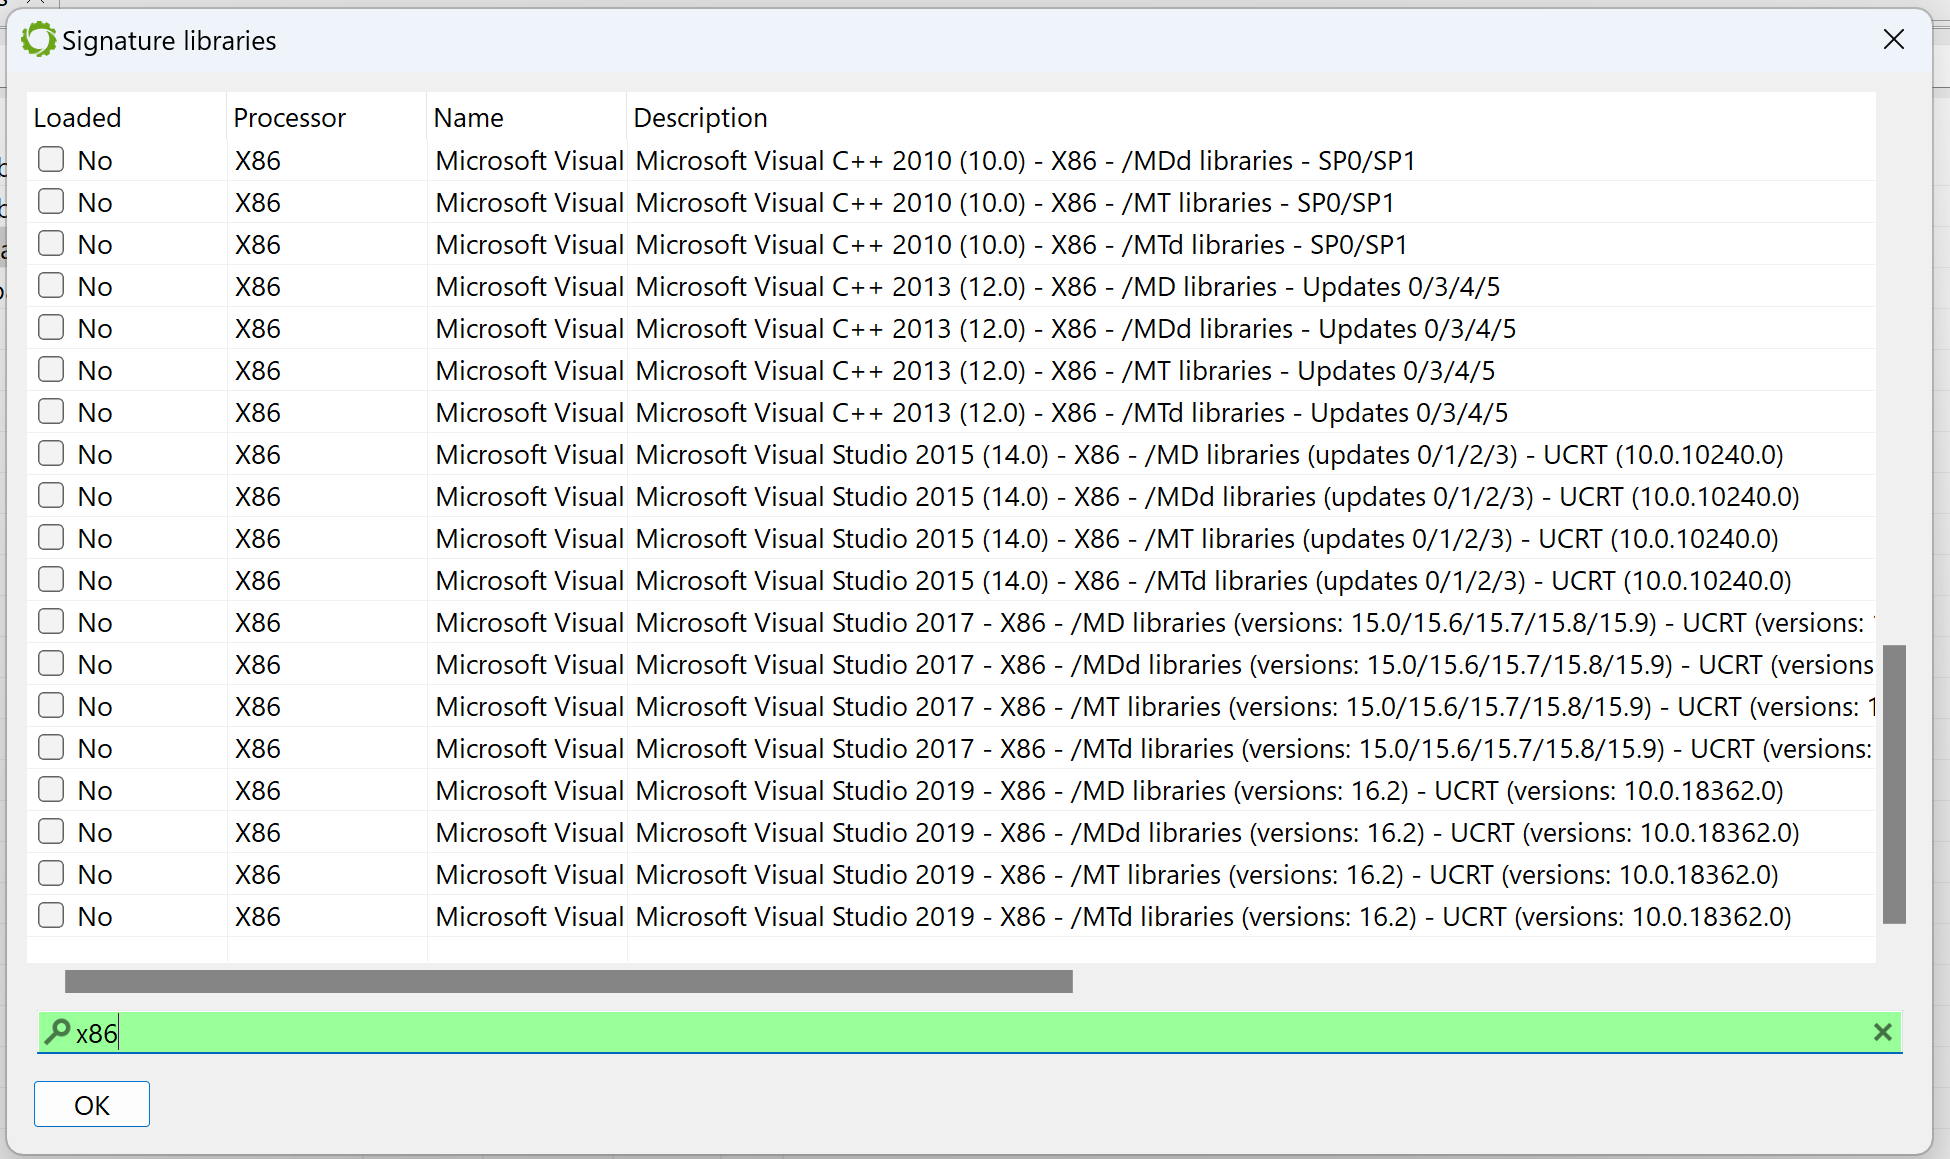
Let’s see why by looking at which siglibs (signature libraries) were applied during the initial analysis (menu: Native, Signature Libraries…). It looks like none were loaded:
The Signatures Libraries dialog
Library code identification
Normally, when JEB performs the initial auto-analysis of the code, compiler identification is used to determine whether well-known signature libraries of static code (siglibs) should be loaded and applied to the binary. In this case, compiler identification failed because all header data had been discarded. JEB decided to not load and apply signatures.
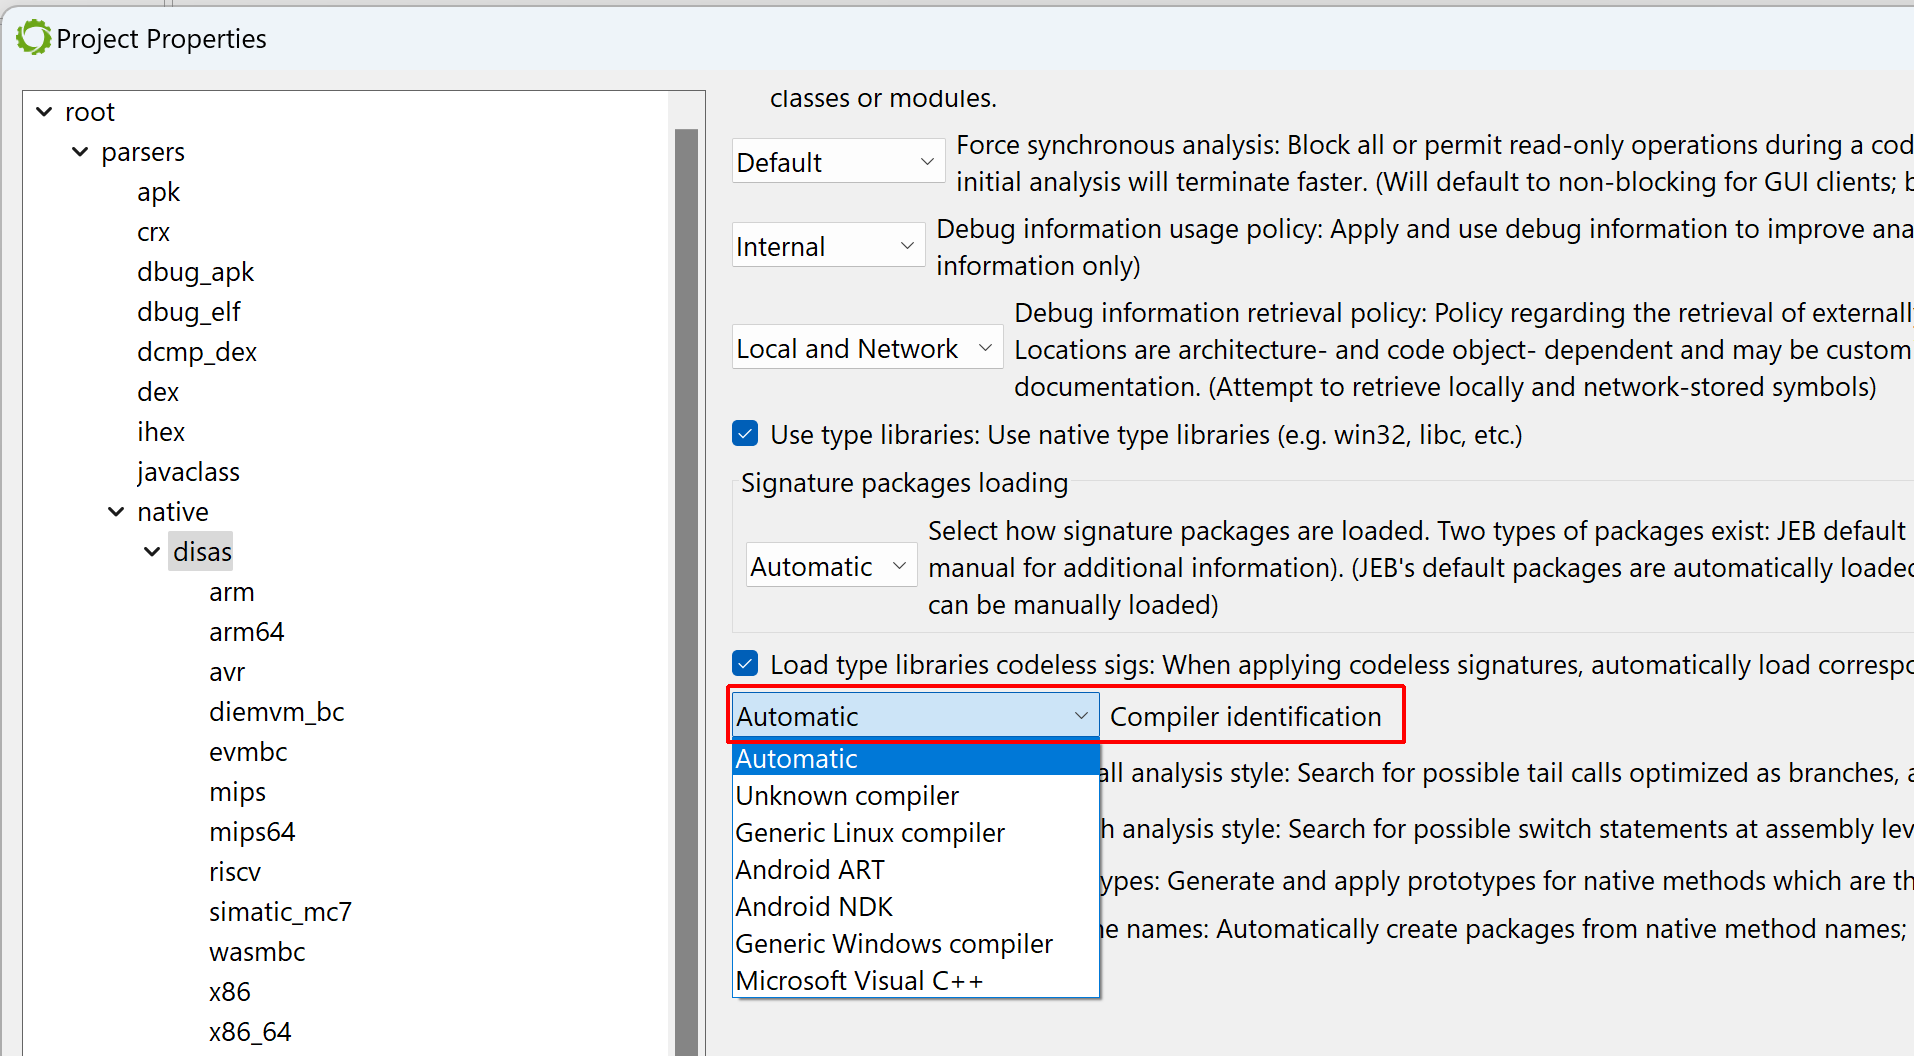
To apply them manually, tick the “MSVC x86” boxes. (An alternative is to let JEB know that the file was compiled with MSVC before the analysis starts: when opening the artifact, when the Options panel is displayed, the user may decide to force the compiler to a set-value.)
Forcing a compiler setting before the initial analysis
After doing either of the above ((a) file re-analysis with a compiler identification pre-set; or (b) manual siglibs application), several methods are identified as MSVC code:
Light-blue areas mean the code was matched against well-known signatures
Entry-point and WinMain
Navigate to the executable entry-point (menu: Native, Go to entry-point…).
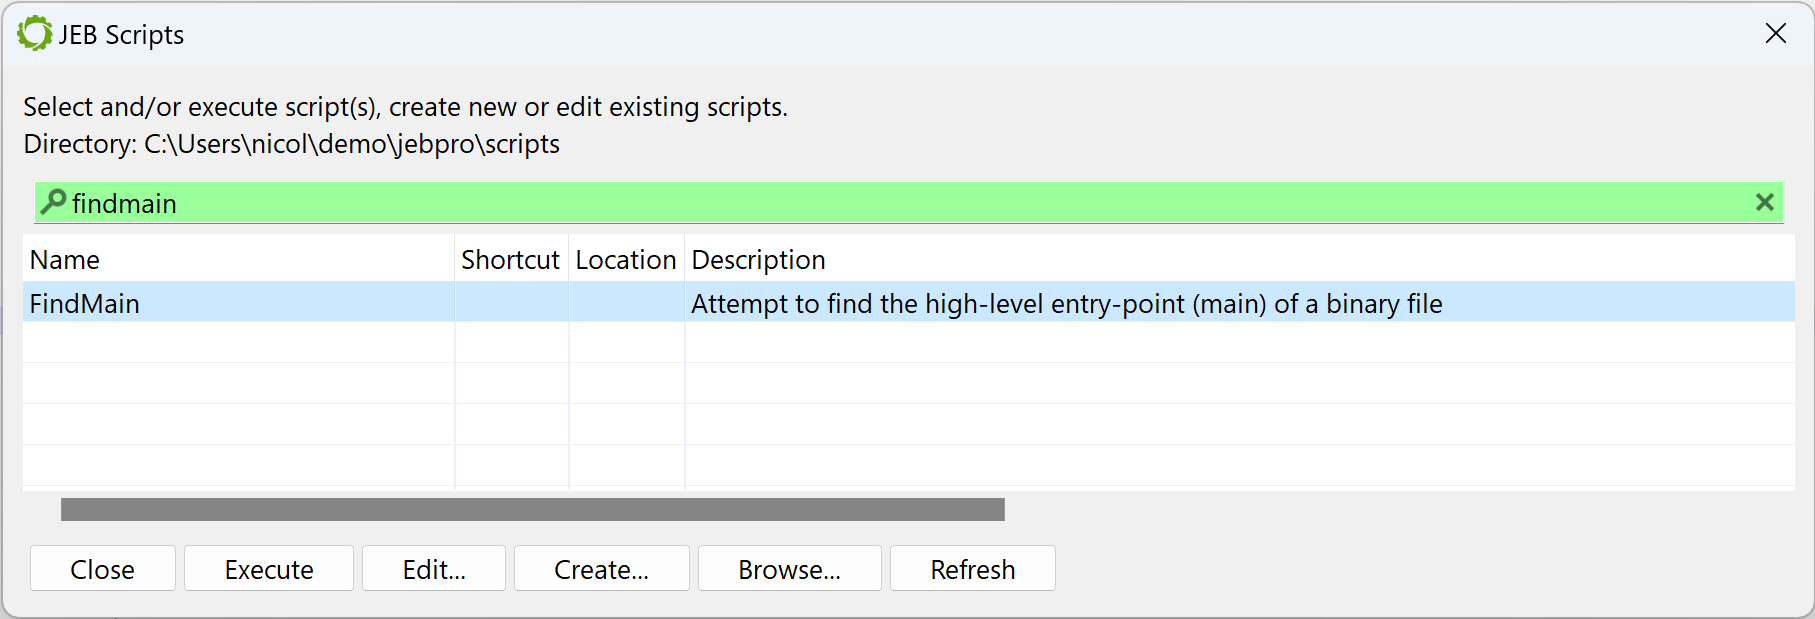
In the general case, the entry-point of a Windows PE compiled with MSVC is not the high-level entry-point that will contain meaningful code. Although it is relatively easy to find WinMain with a bit of experience, there is a JEB script to help you as well, FindMain.py (available in the samples-script folder, also available on GitHub). Open up the script selector with F2 (menu: File, Scripts, Script selector…).
Run a JEB Python script inside the GUI client
Select the desired script and execute it. The result is displayed in the console:
...
Found high-level entry-point at 0x401175 (branched from 0x401D38)
Renaming entry-point to 'winmain'
...
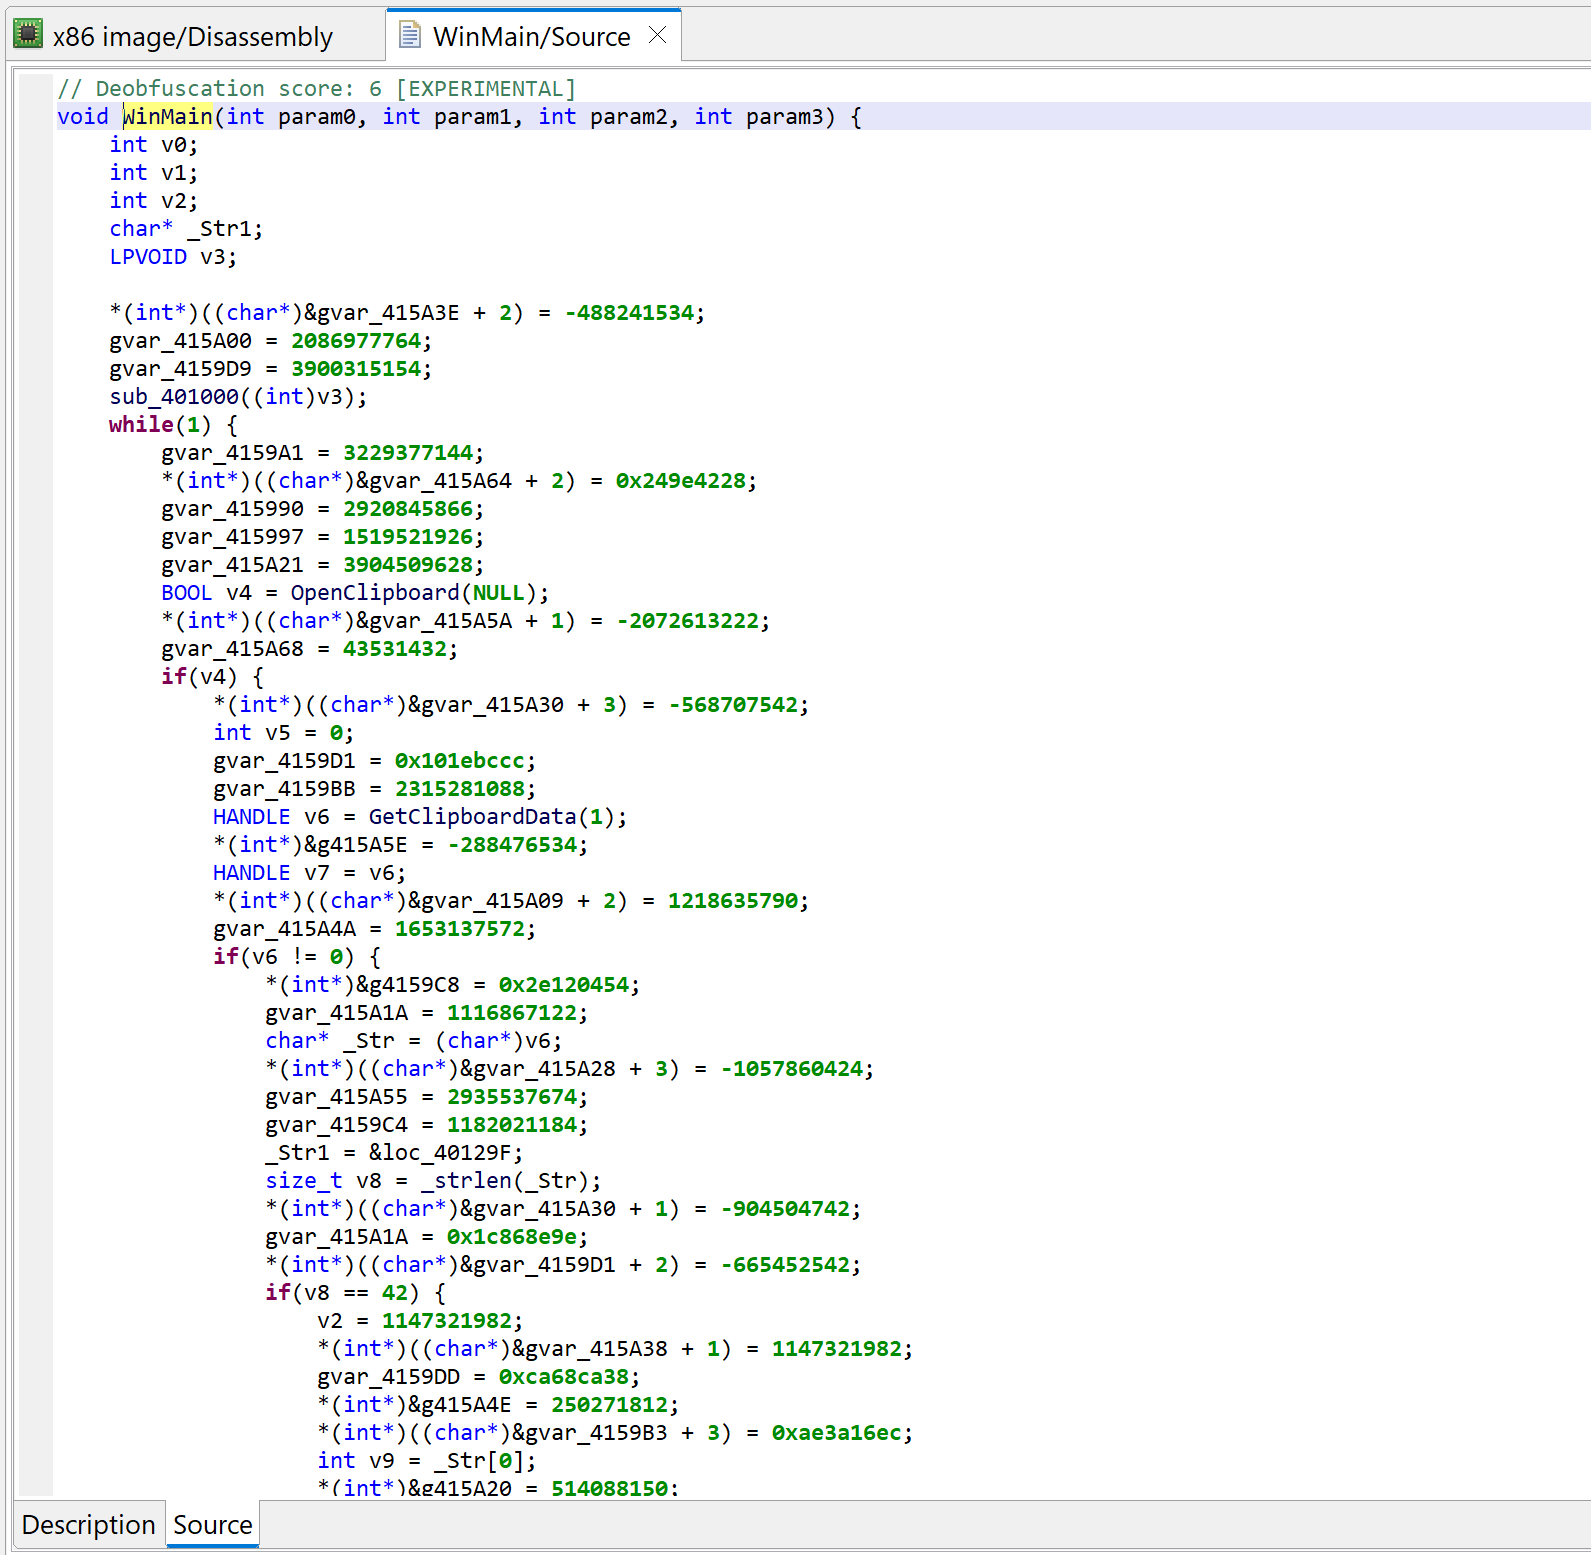
The code at 0x401175 was auto-renamed to winmain (menu: Action, Rename…).
Initial decompilation
Let’s decompile that method by pressing the TAB key (menu: Action, Decompile…).
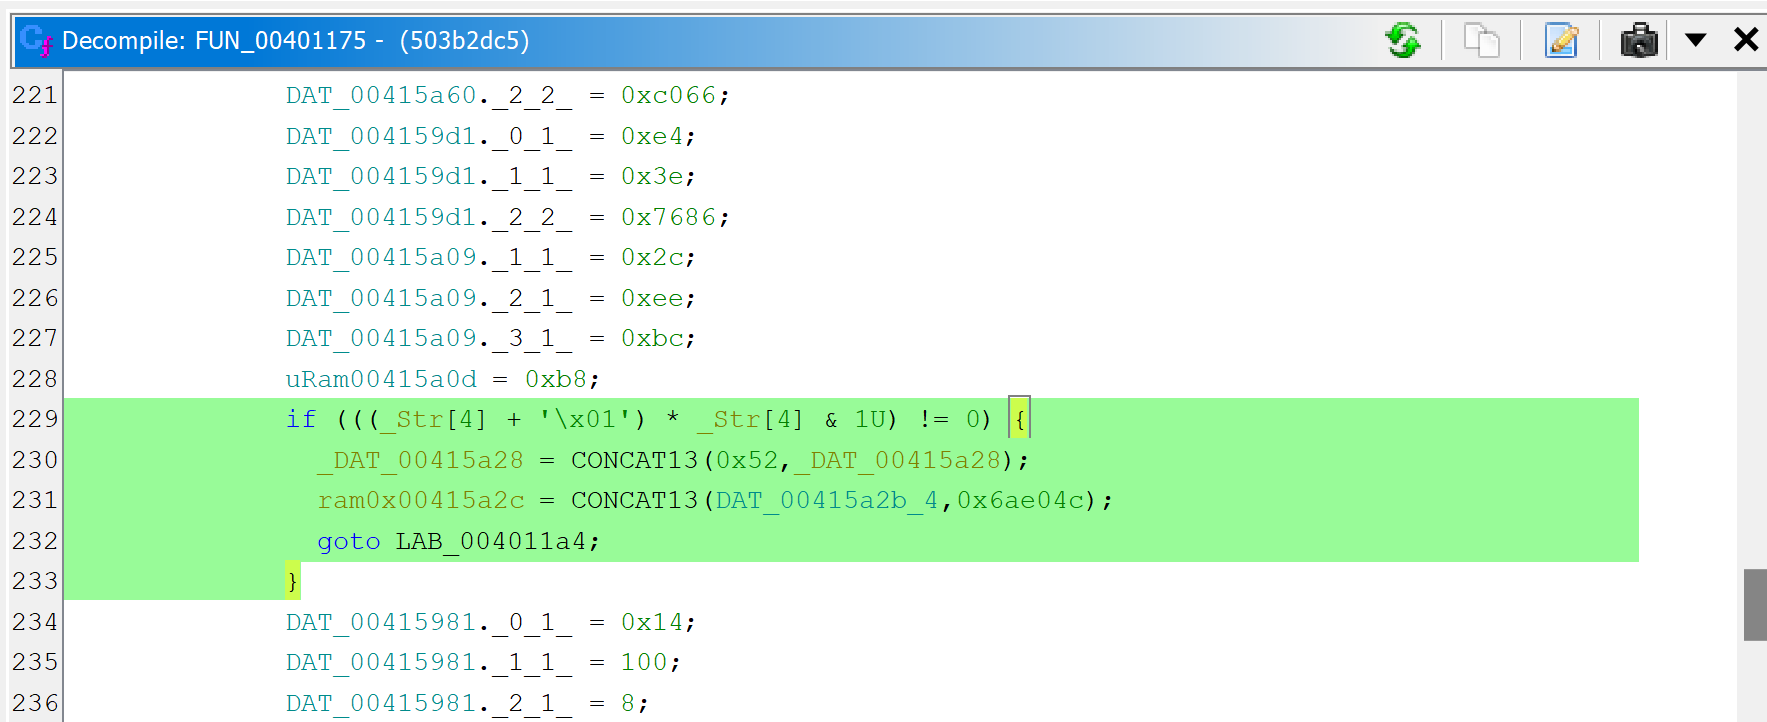
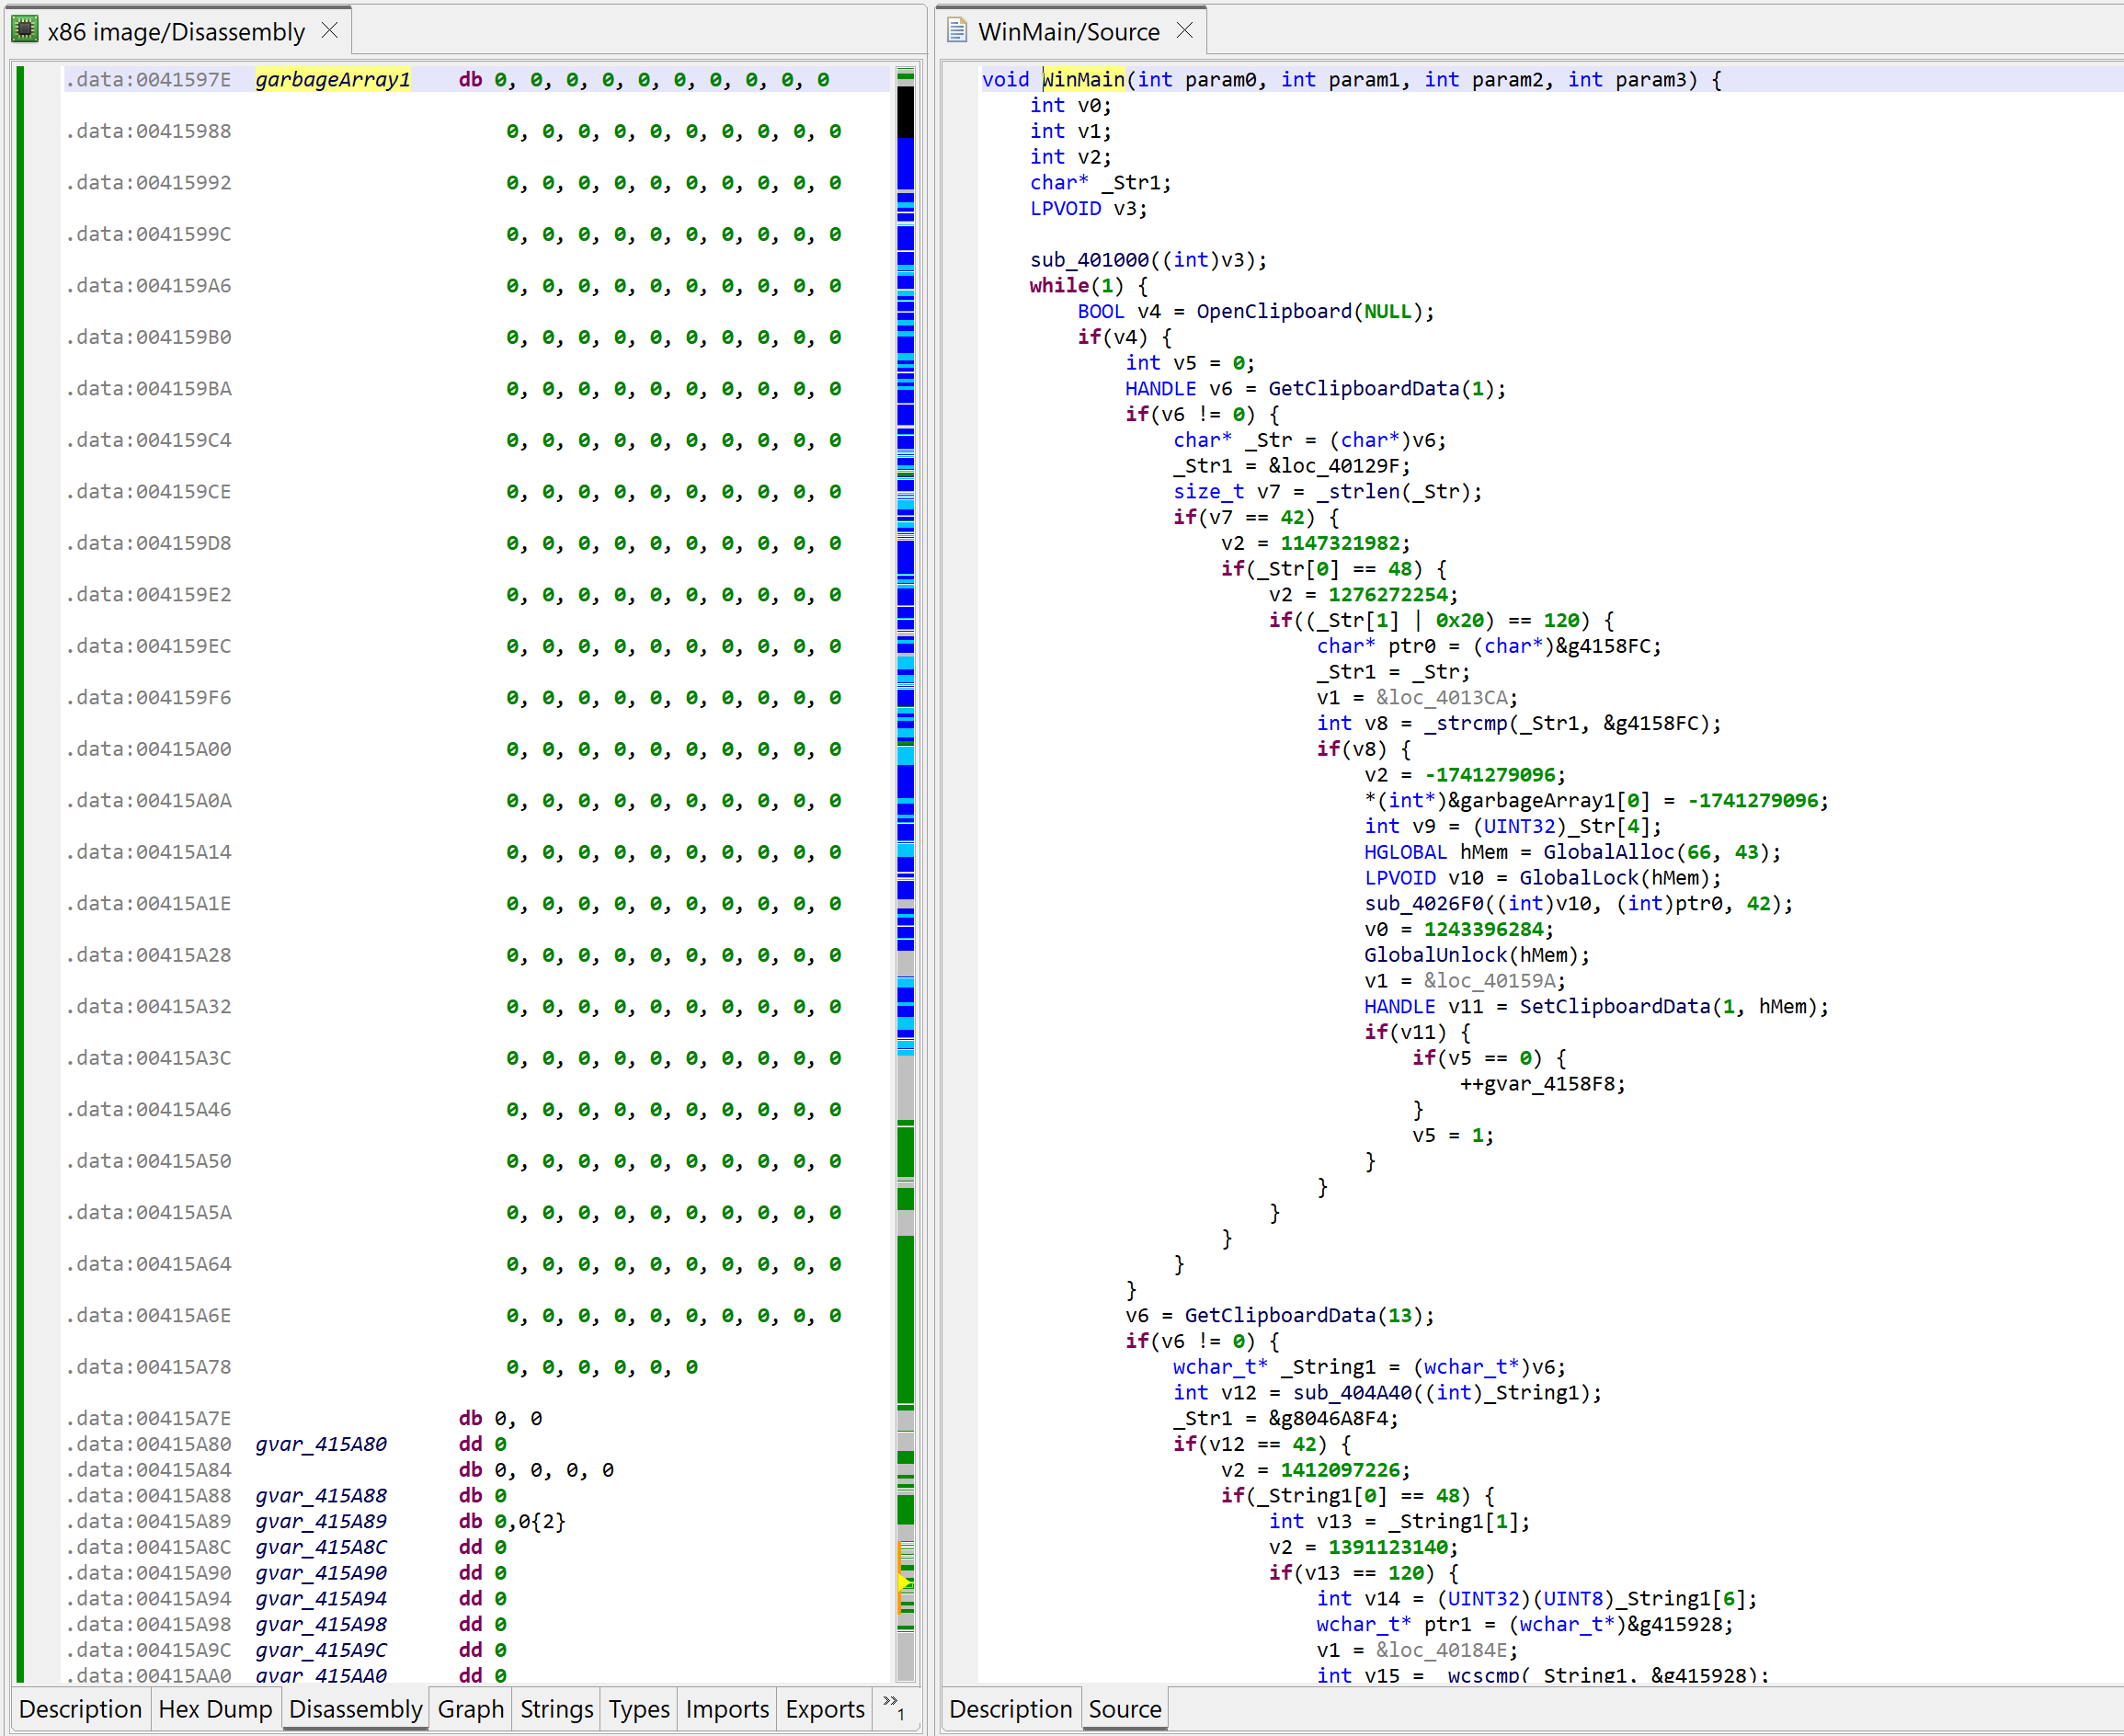
Initial decompilation of WinMain
Two items of interest to note at this point:
There is lots of code that appears to be junk or garbage
There is a note about some “deobfuscation score”
Junk code
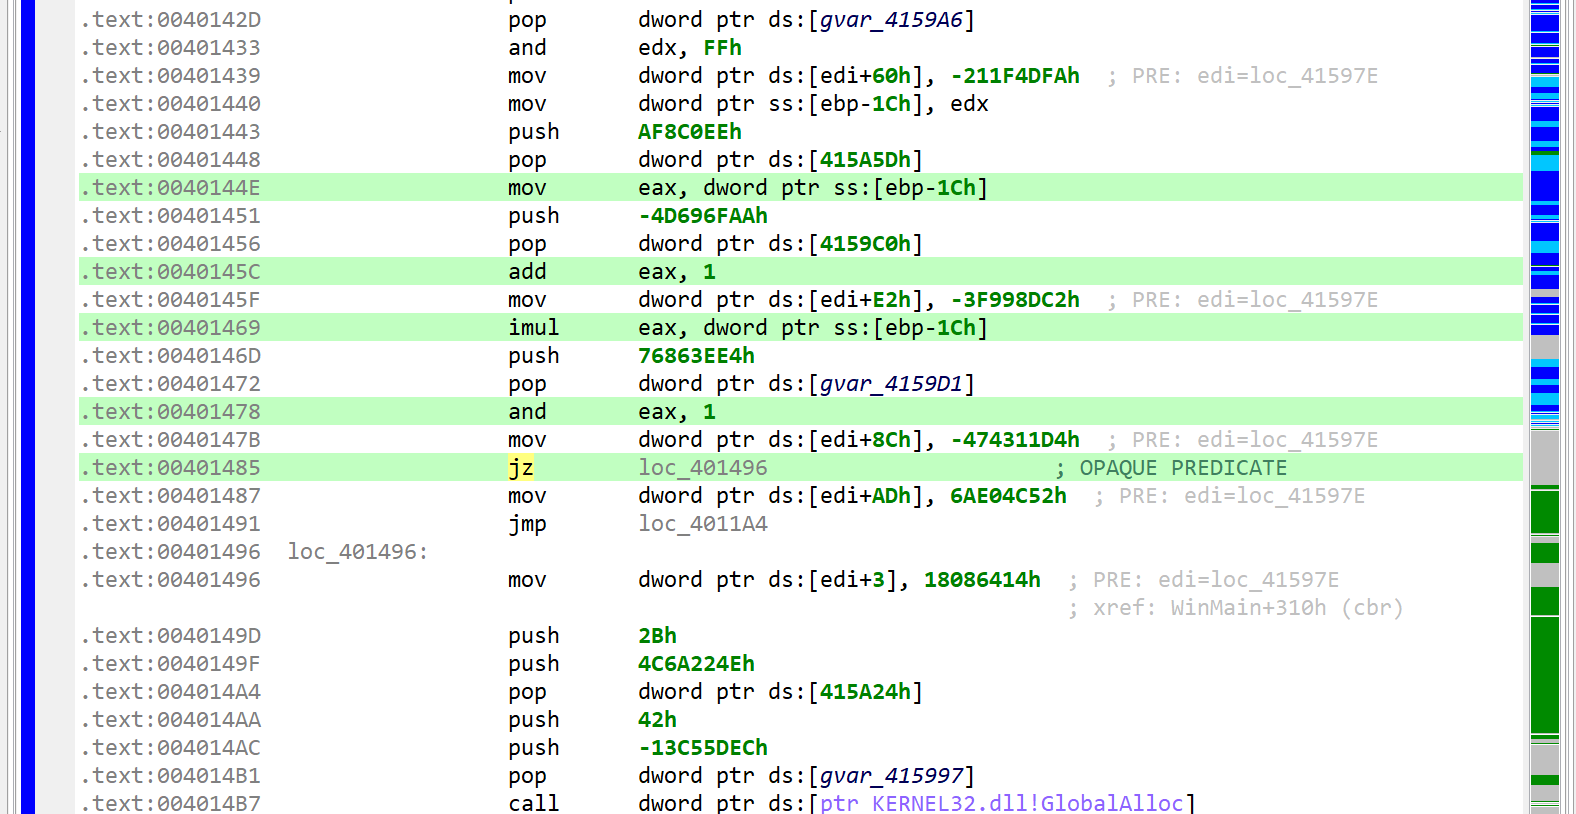
The decompiled WinMain method is about 300 lines of C code. A lot of it are assignments writing to program globals. At first glance, it looks like it could be some sort of obfuscation. Let’s look at the corresponding assembly code:
Press TAB to go back from a decompilation to the closest matching machine code disassembly line
The snippets have the following structure: push GARBAGE / pop dword [gXXX]
Or that, assuming edi is callee-saved: mov edi, gXXX / ... / mov dword [edi+offset], GARBABE
Later on, we will see how to remove this clutter to make the analysis more pleasant.
Deobfuscation score
A note “deobfuscation score: 6” was inserted as a method comment. That score indicates that some “advanced” clean-up was performed. In this case, a careful examination (as well as a comparison against a decompilation with UNSAFE optimizers turned off, which you can do by redecompiling the method with CTRL+TAB (menu: Action, Decompile with Options…)) will point to this area of code:
The opaque predicate calculation is highlighted in green using CTRL+M (menu: Action, Toggle Highlight…)
This predicate looks like the following: if(X*(X+1) % 2 == 0) goto LABEL.
With X being an integer, X*(X+1) is always even. Therefore, the predicate will always evaluate to true. JEB cleaned this up automatically. (While this particular predicate is trivial, truly opaque predicates will also be attempted to be broken up by JEB, using the Z3 SMT solver.)
Comparison with GHIDRA
For a point of comparison, you may have a look at the same method decompiled by GHIDRA 10.4 here (default settings were used, just like we did with JEB). The predicate is not cleaned-up adequately, extra control-flow edges are left over, leading to AST structuring confusion.
Cleaning up the code
Let’s start with decluttering this code. First of all, why couldn’t the decompiler clean it up on its own? If the globals written to are never read with meaningful intent, then they could be discarded.
The issue is that this is very hard to ensure in the general case. However, in specific cases, sometimes involving manual review, some global written-to memory range may be deemed useless, as it is the case here. How do we provide this information to the decompiler? Well, as of version 5.7, we cannot! 1 What we can do though is write a decompiler plugin to clean-up the offending IR, and in the process, generate clean(er) code.
IR cleaner plugin
The decompiler accept several types of plugins, including IR Optimizers (they work on the Intermediate Representation of a routine, as it moves up the decompilation pipeline), and AST optimizers (to clean-up or reformat the generated abstract syntax tree of the pseudo-code). In most cases, IR optimizers are well-suited to perform code clean-up or deobfuscation tasks (refer to this blog post for a detailed comparison).
We will write the plugin in Java (we could also write it in Python). It will do the following:
Examine each IR statement of a CFG
Check if the statement is writing an immediate to some global array: *(array + offset) = value
If so, check the array name. If it starts with the prefix “garbage”, consider the statement useless and replace it by a Nop statement
Writing IR plugins is out-of-scope in this post; we will go over that in details in a future entry. In the meantime, you can download the plugin code here. Dump the Java file in your JEB’s coreplugins/scripts/ folder. There is no need to close and re-open JEB; it will be picked up at the next decompilation.
public class GarbageCleaner extends AbstractEOptimizer {

	@Override
	public int perform() {
		int cnt = 0;

		for (BasicBlock<IEStatement> b : cfg) {
			for (int i = 0; i < b.size(); i++) {
				IEStatement stm = b.get(i);
				if (stm instanceof IEAssign && stm.asAssign().getDstOperand() instanceof IEMem
						&& stm.asAssign().getSrcOperand() instanceof IEImm) {
					IEMem dst = stm.asAssign().getDstOperand().asMem();
					IEGeneric e = dst.getReference();
					// [xxx + offset] = immediate
					if (e.isOperation(OperationType.ADD)) {
						IEOperation op = e.asOperation();
						if (op.getOperand1().isVar() && op.getOperand2().isImm()) {
							IEVar v = op.getOperand1().asVar();
							IEImm off = op.getOperand2().asImm();
							if (v.isGlobalReference()) {
								long addr = v.getAddress();
								INativeContinuousItem item = ectx.getNativeContext().getNativeItemAt(addr);
								// logger.info("FOUND ITEM %s", item.getName());
								if (item != null && item.getName().startsWith("garbage")) {
									long itemsize = item.getMemorySize();
									if (off.canReadAsLong() && off.getValueAsLong() + dst.getBitsize() / 8 < itemsize) {
										logger.info("FOUND GARBAGE CODE");
										b.set(i, ectx.createNop(stm));
										cnt++;
									}
								}
							}
						}
					}
				}
			}
		}

		if (cnt > 0) {
			cfg.invalidateDataFlowAnalysis();
		}
		return cnt;
	}
}
Note that by design, the plugin is not specific to this malware. We will be able to re-use it in future analyses: all global arrays prefixed with “garbage” will be treated by the decompiler as junk recipients, and cleaned-up accordingly!
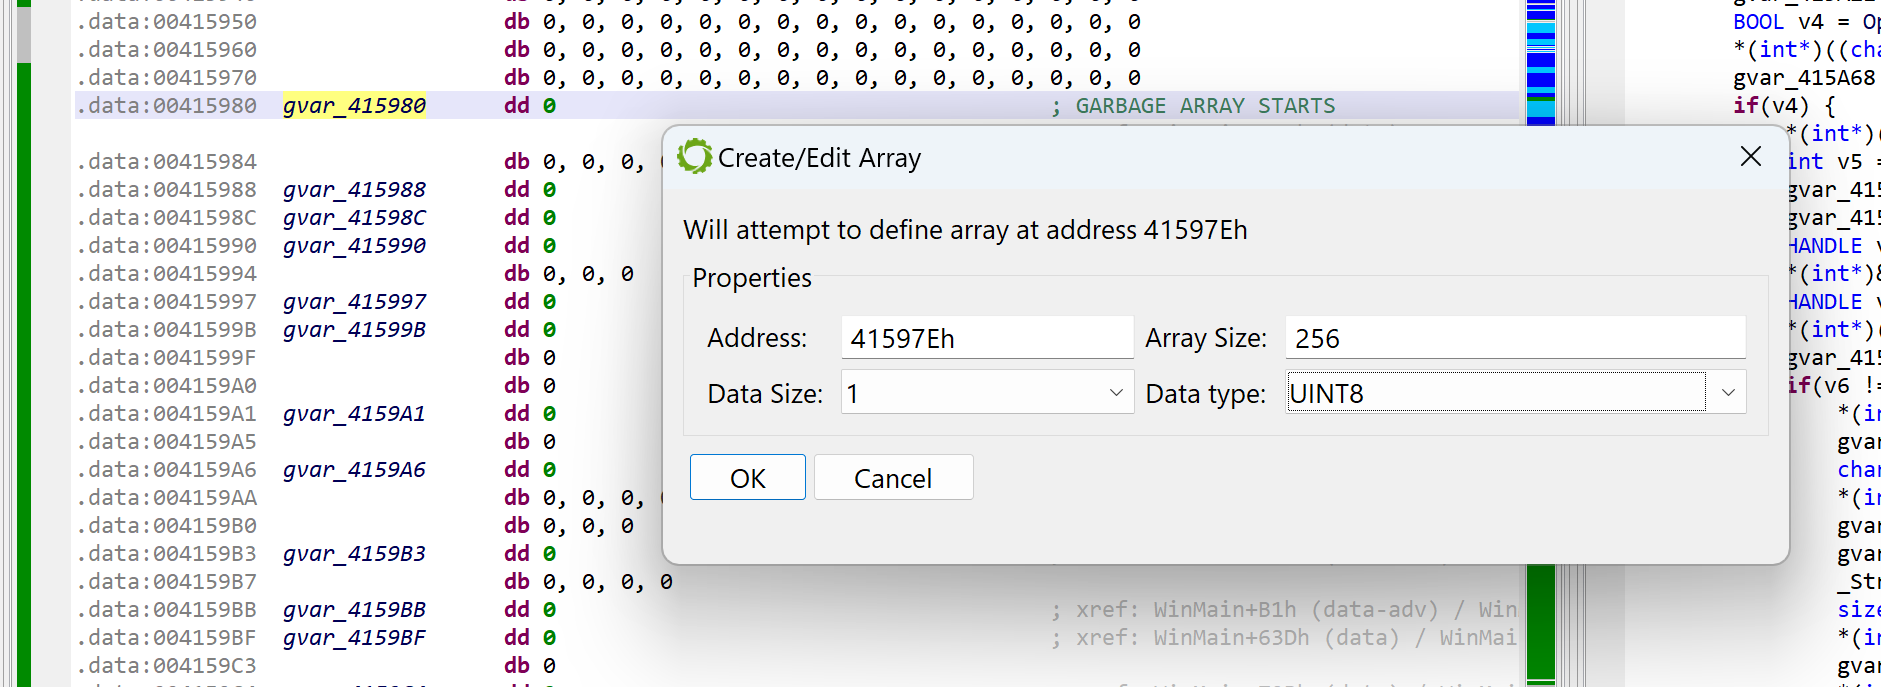
Defining the garbage array
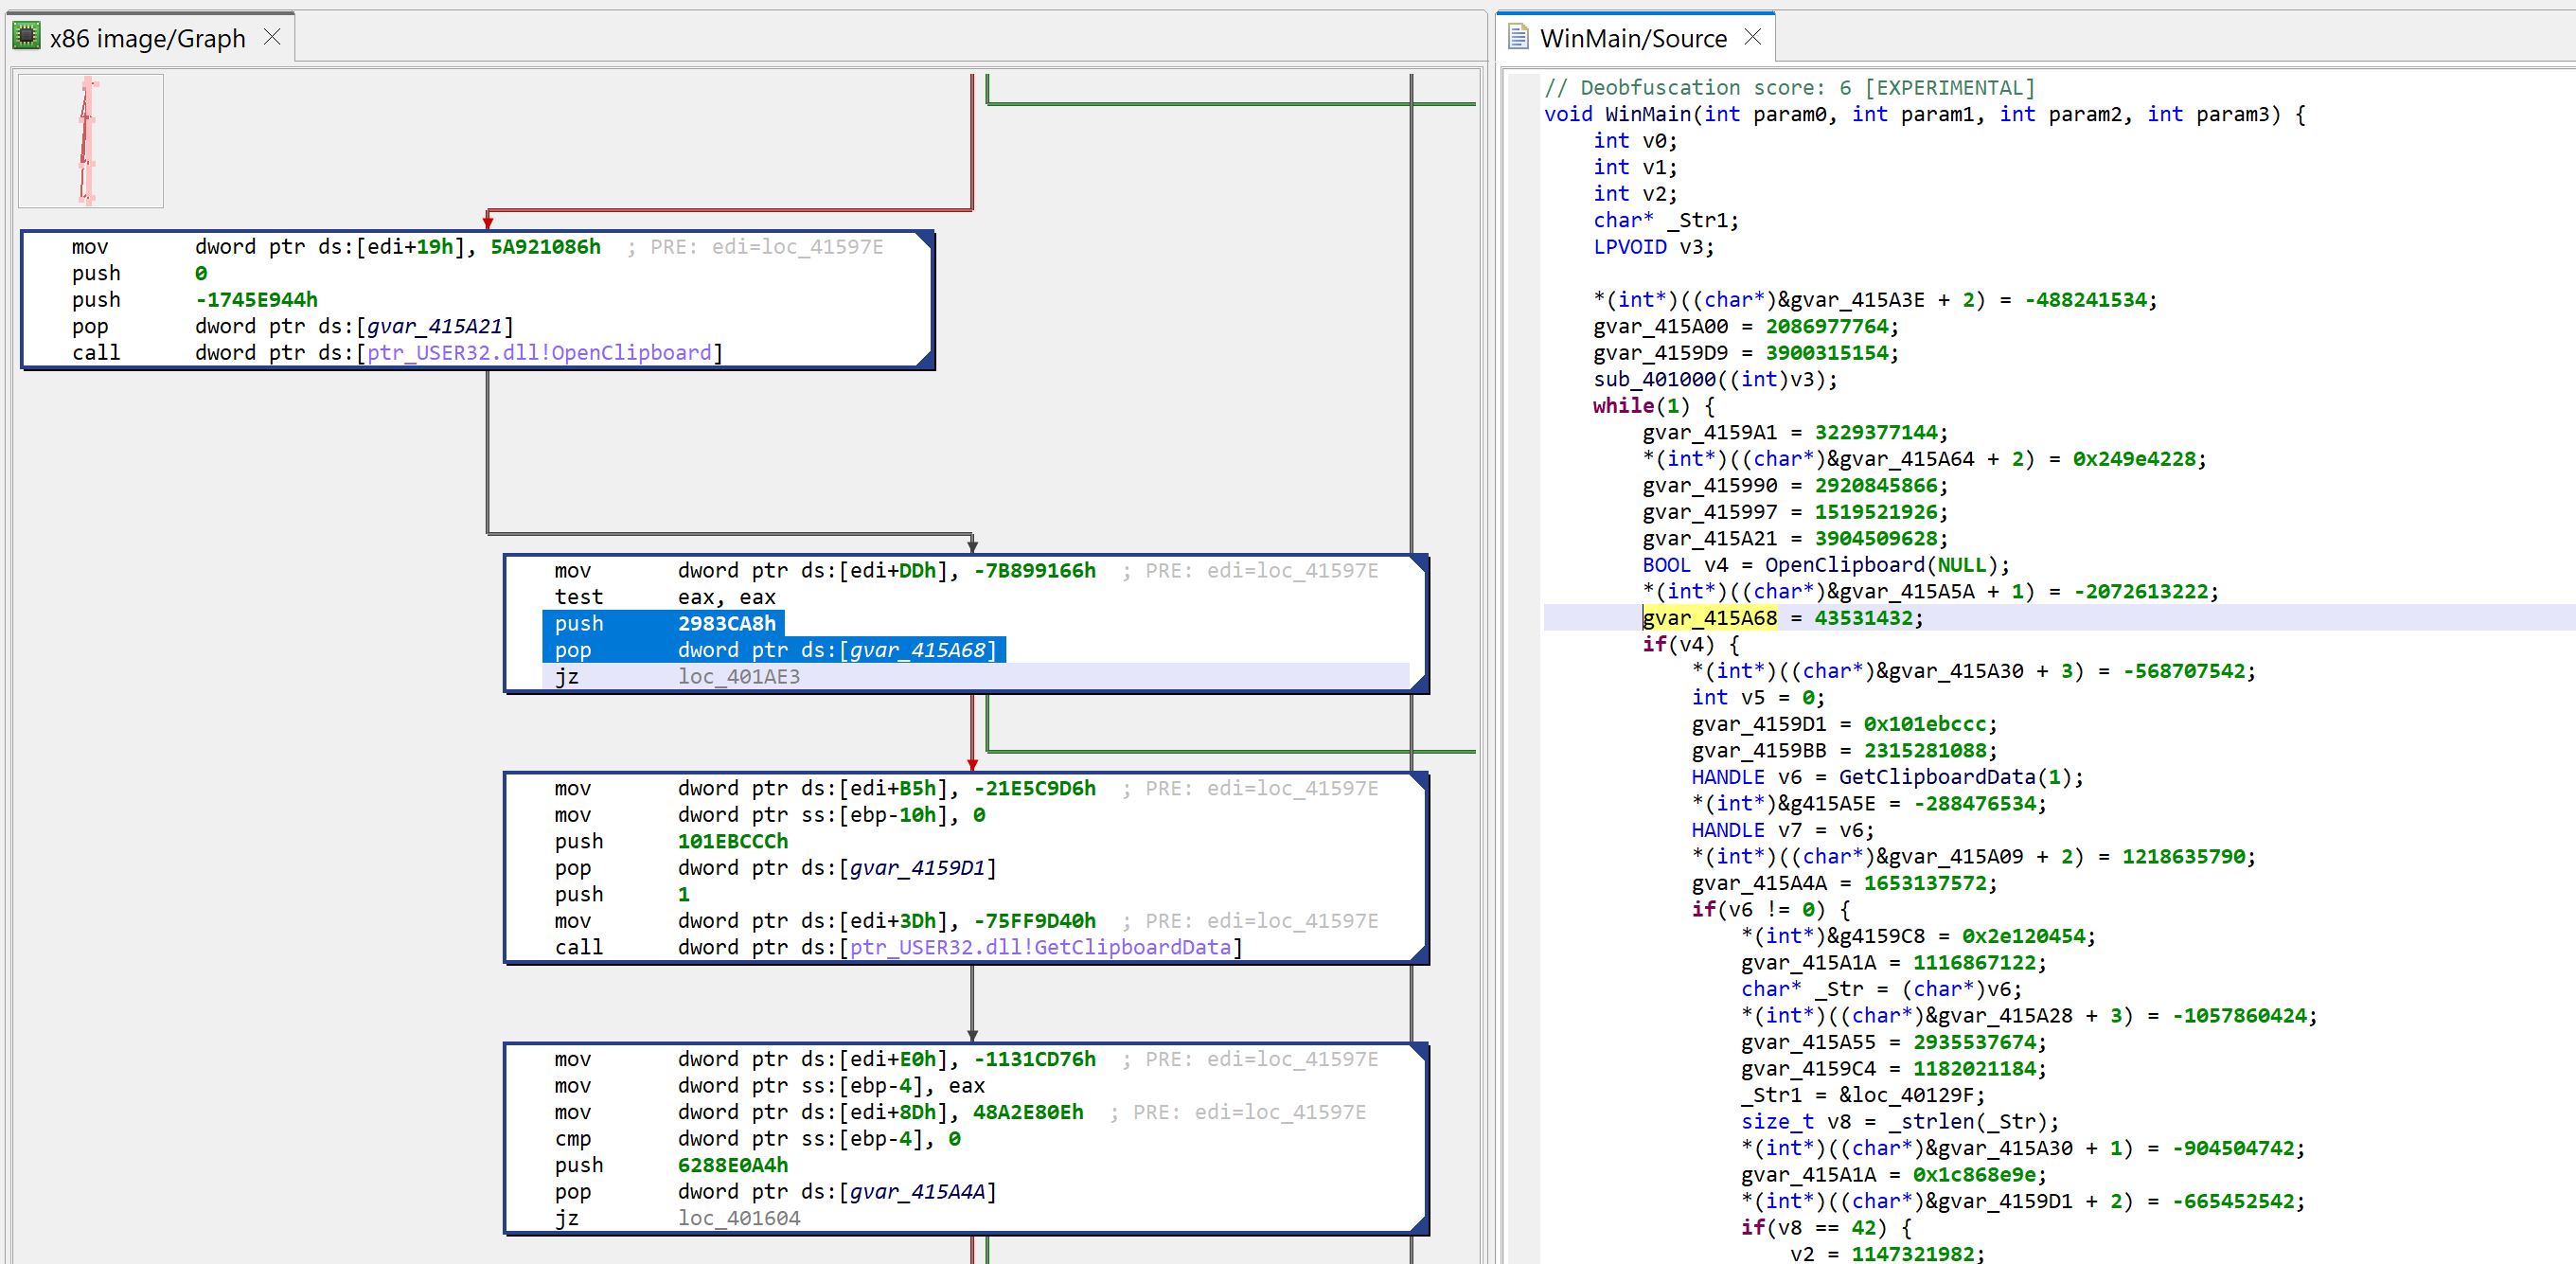
At this point, we need to determine where that array is. Some examination of the code leads to the following boundaries (roughly): start at 0x41597E, spans over 0x100 bytes. Navigate to the disassembly; create an array using the STAR key (menu: Native, Create/Edit Array…); specify its characteristics.
Creating a global array of 0x100 bytes. This is the garbage array.
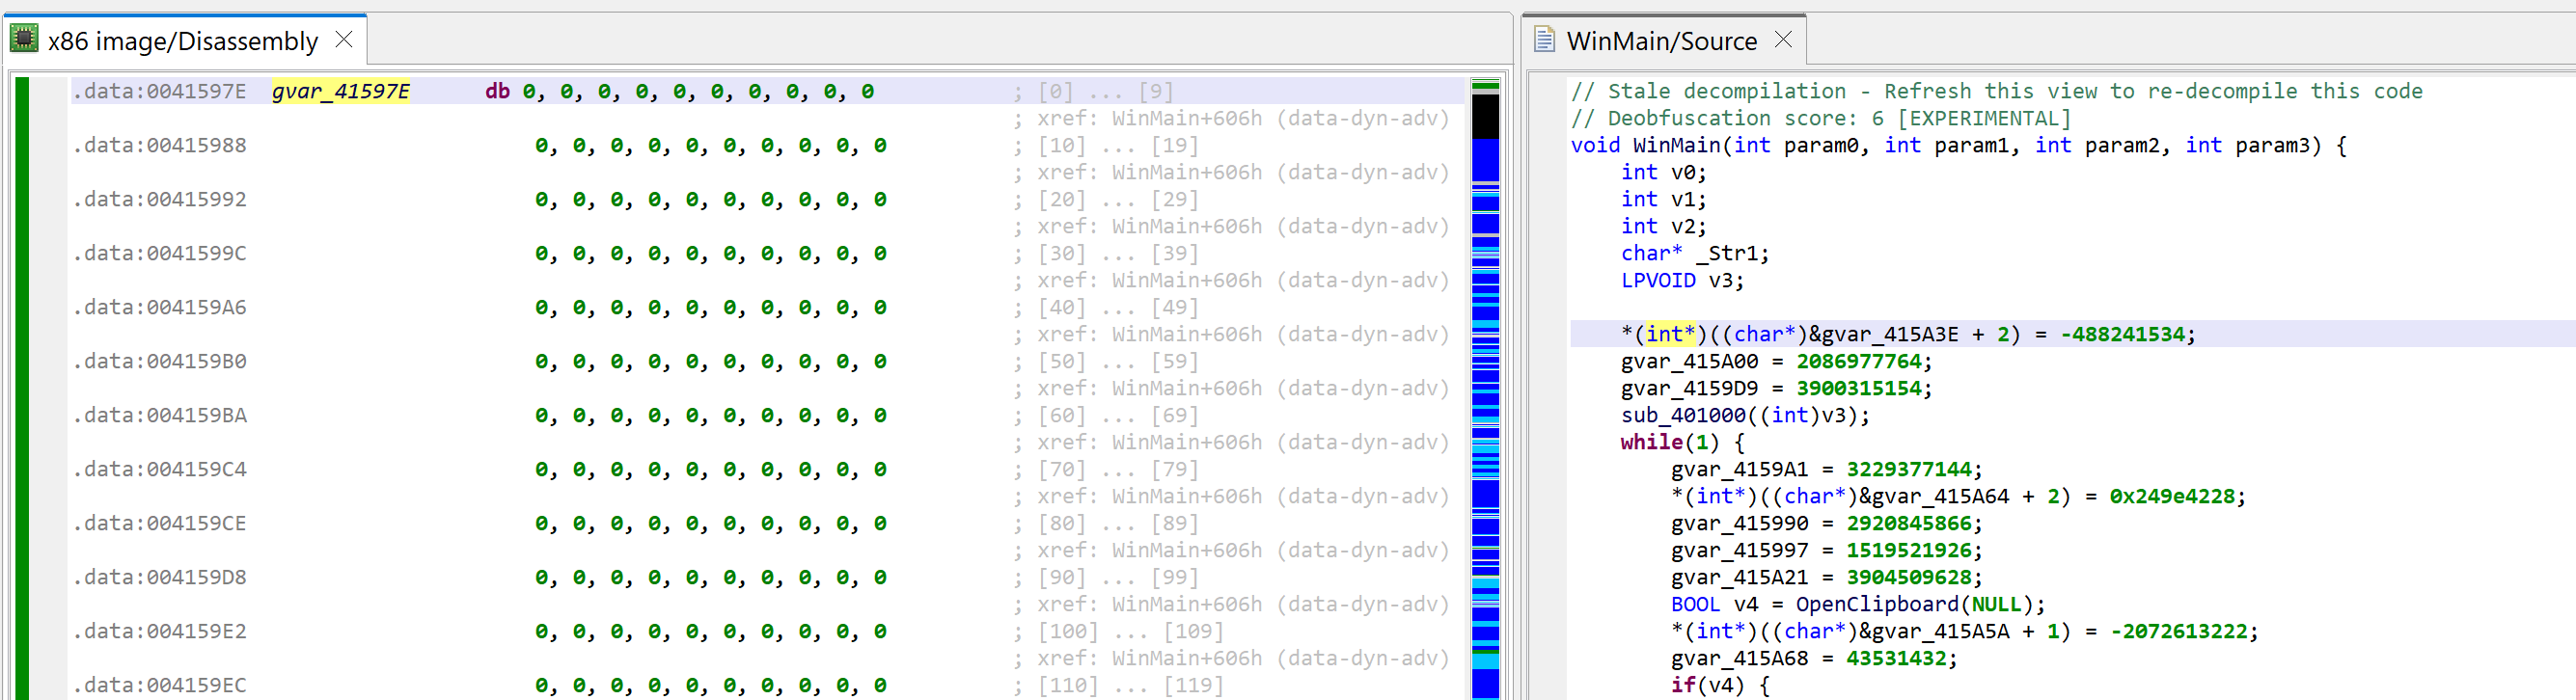
As soon as the array is created, the disassembly will change to what can be seen below. At the same time, the decompilations using that array will be invalidated; that is the case for WinMain. You may see that another extra-comment was added by the decompiler: “Stale decompilation – Refresh this view to re-decompile this code”. Such decompilations are read-only until a new one is generated.
The array is now created. The decompilation of WinMain becomes stale.
Before redecompiling, remember we need to rename our array with a label starting with “garbage”. Set the caret on the array, hit the key N (menu: Actions, Rename…) and set your new name, e.g., garbageArray1.
Now you may go back to the decompilation view of WinMain and hit F5 (menu: Windows, Refresh…) to regenerate a decompilation.
Decompiled WinMain after the garbage array-assigns were cleaned-up by the plugin
The code above is much nicer to look at – and much easier to work on!
Quick analysis
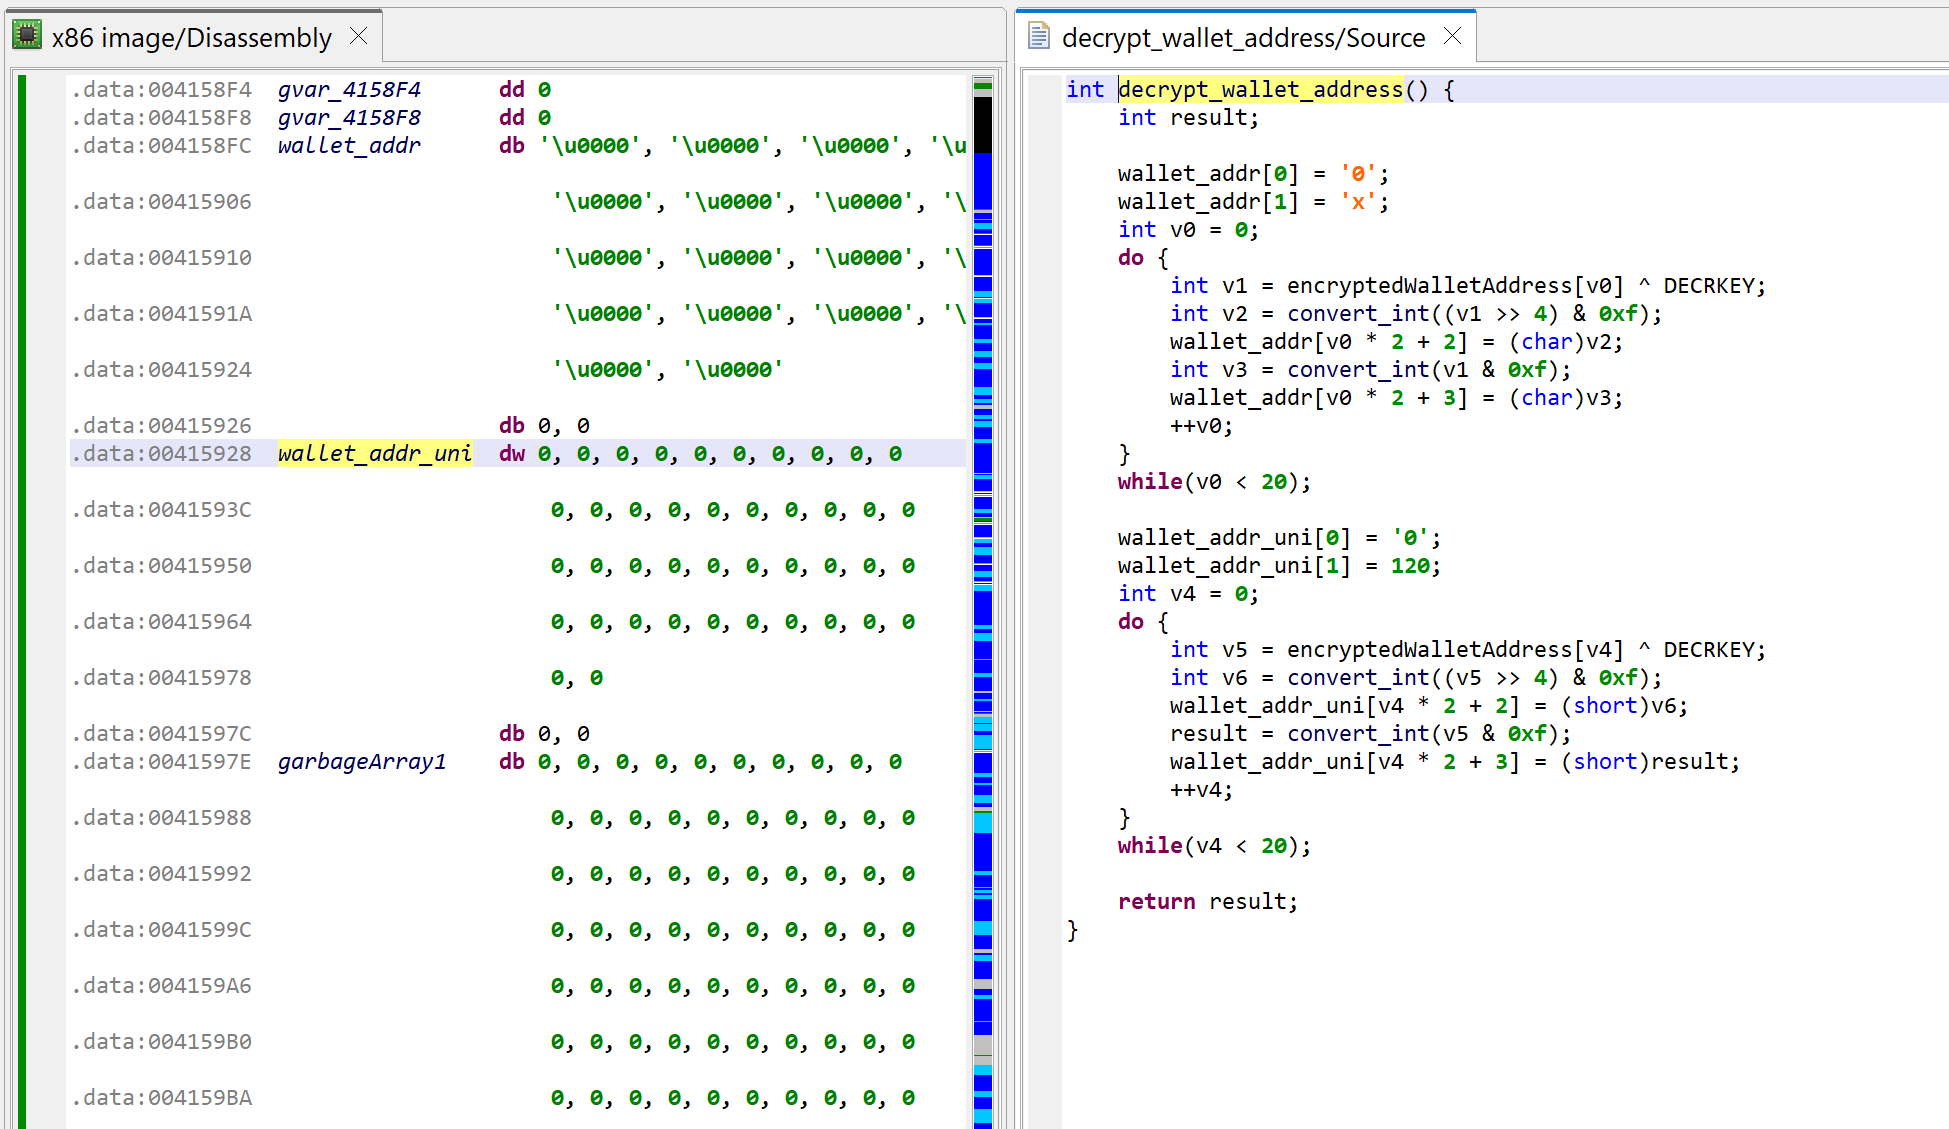
The method at 0x401000, called by WinMain, is decrypting the thief’s wallet address, and generating two hexstring versions of it (ascii and unicode).
Decrypting the target wallet address. The decompilation is shown after proper types were applied on the data structures accessed (encrypted wallet address, hexstrings, etc.) and better names given to those vars
The loop in WinMain is doing the following:
Every second, it queries the Windows clipboard with OpenClipboard
It checks if it contains text strings or unicode strings
If the string is 42 characters in length and starts with “0x”, it proceeds (an Ethereum wallet address is 20 bytes, therefore its hexadecimal representation would be 40 characters)
It checks if the string is not the attacker’s wallet address
If not, it replaces the contents of the clipboard data by the attacker’s wallet address using SetClipboardData
Finally, the other contents found in the clipboard is discarded
Well-known literals
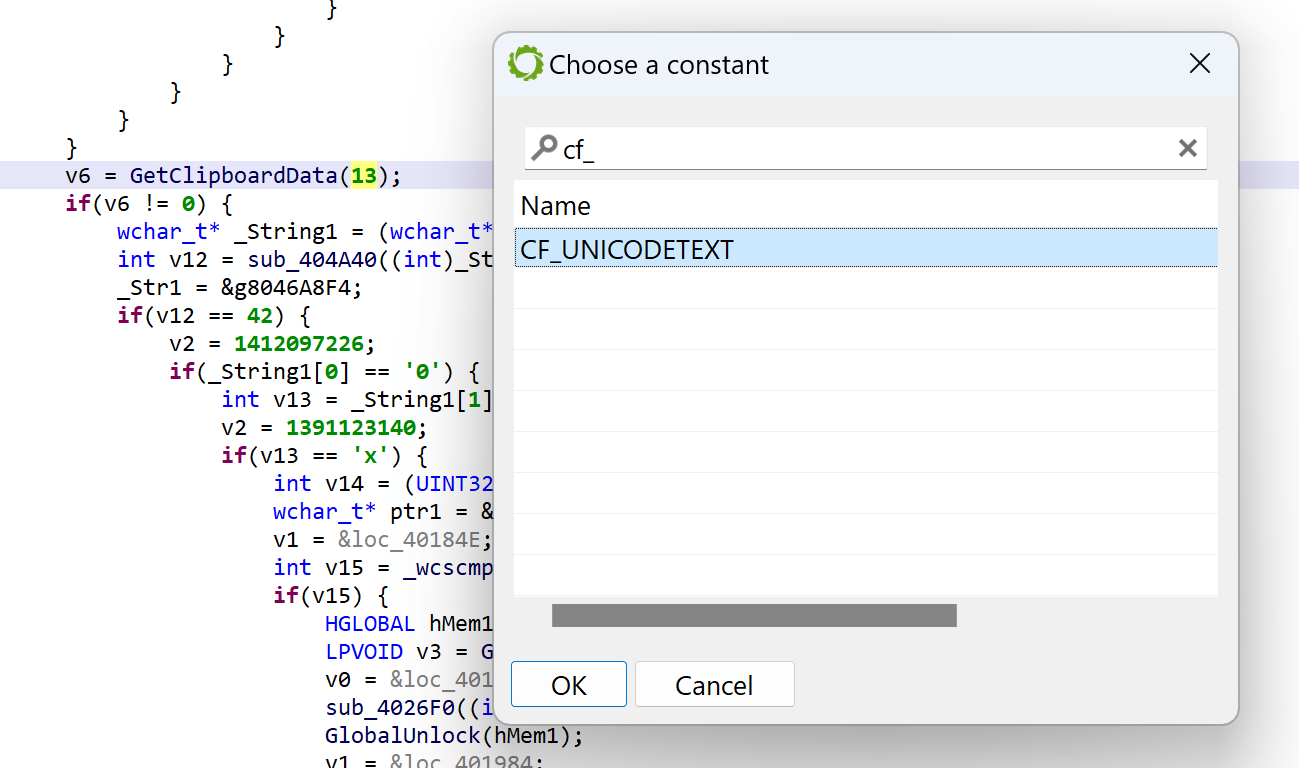
In JEB, you may replace immediates by well-known literals found in type libraries (aka typelibs, such as the win32 typelibs, which were automatically loaded when the analysis of the PE file started). To do that, select the immediate, then hit CTRL+N (menu: Action, Replace…), and select the desired literal 2
For example, per the MSDN, GetClipboardData uses CF_xxx constants to indicate the type of data. We can ask JEB to replace GetClipboardData(13) by GetClipboardData(CF_UNICODETEXT) using the Action/Replace handler:
Replacing 13 by CF_UNICODE in a call to GetClipboardData
Conclusion
That concludes the first blog in this “How to use JEB” series. In the next episodes, we will look at other features, dig deeper into writing IR plugins, look into types and types creation, and reverse other architectures, including exotic code.
To learn more, we encourage you to:
Explore this blog, as it contains many technical entries and how-to’s.
Look at the sample code (scripts and plugins) shipping with JEB, it will get you started on using the API to write your own extensions.
Join our Slack channel to engage with other users in the community and ask questions if you’re stuck on anything.
Thank you very much & Stay tuned 🙂 Happy Holiday to All 🎄
–
The plugin written to analyze this malware may ship in some upcoming version of JEB. ↩
In many cases, JEB will do that automatically, and it should be the case here. ↩
Update (2025/09/10): The legacy assistant is superseded by VIBRE, a full-blown conversational AI agent available in JEB 5.32+. Read more here!
Update (2025/08/17): The assistant was updated for the release of JEB 5.31. Restrictions in terms of decompiled code size were loosened; back-end language models were upgraded to provide better suggestions.
Update (2023/12/06): Several restrictions are lifted in JEB 5.6 to make the Assistant available for Java decompiled output generated by dexdec (it is currently limited to C output generated by gendec).
Starting from JEB 5.2, you may use the experimental “JEB Assistant” to infer names for decompiled classes, fields, methods and method parameters.
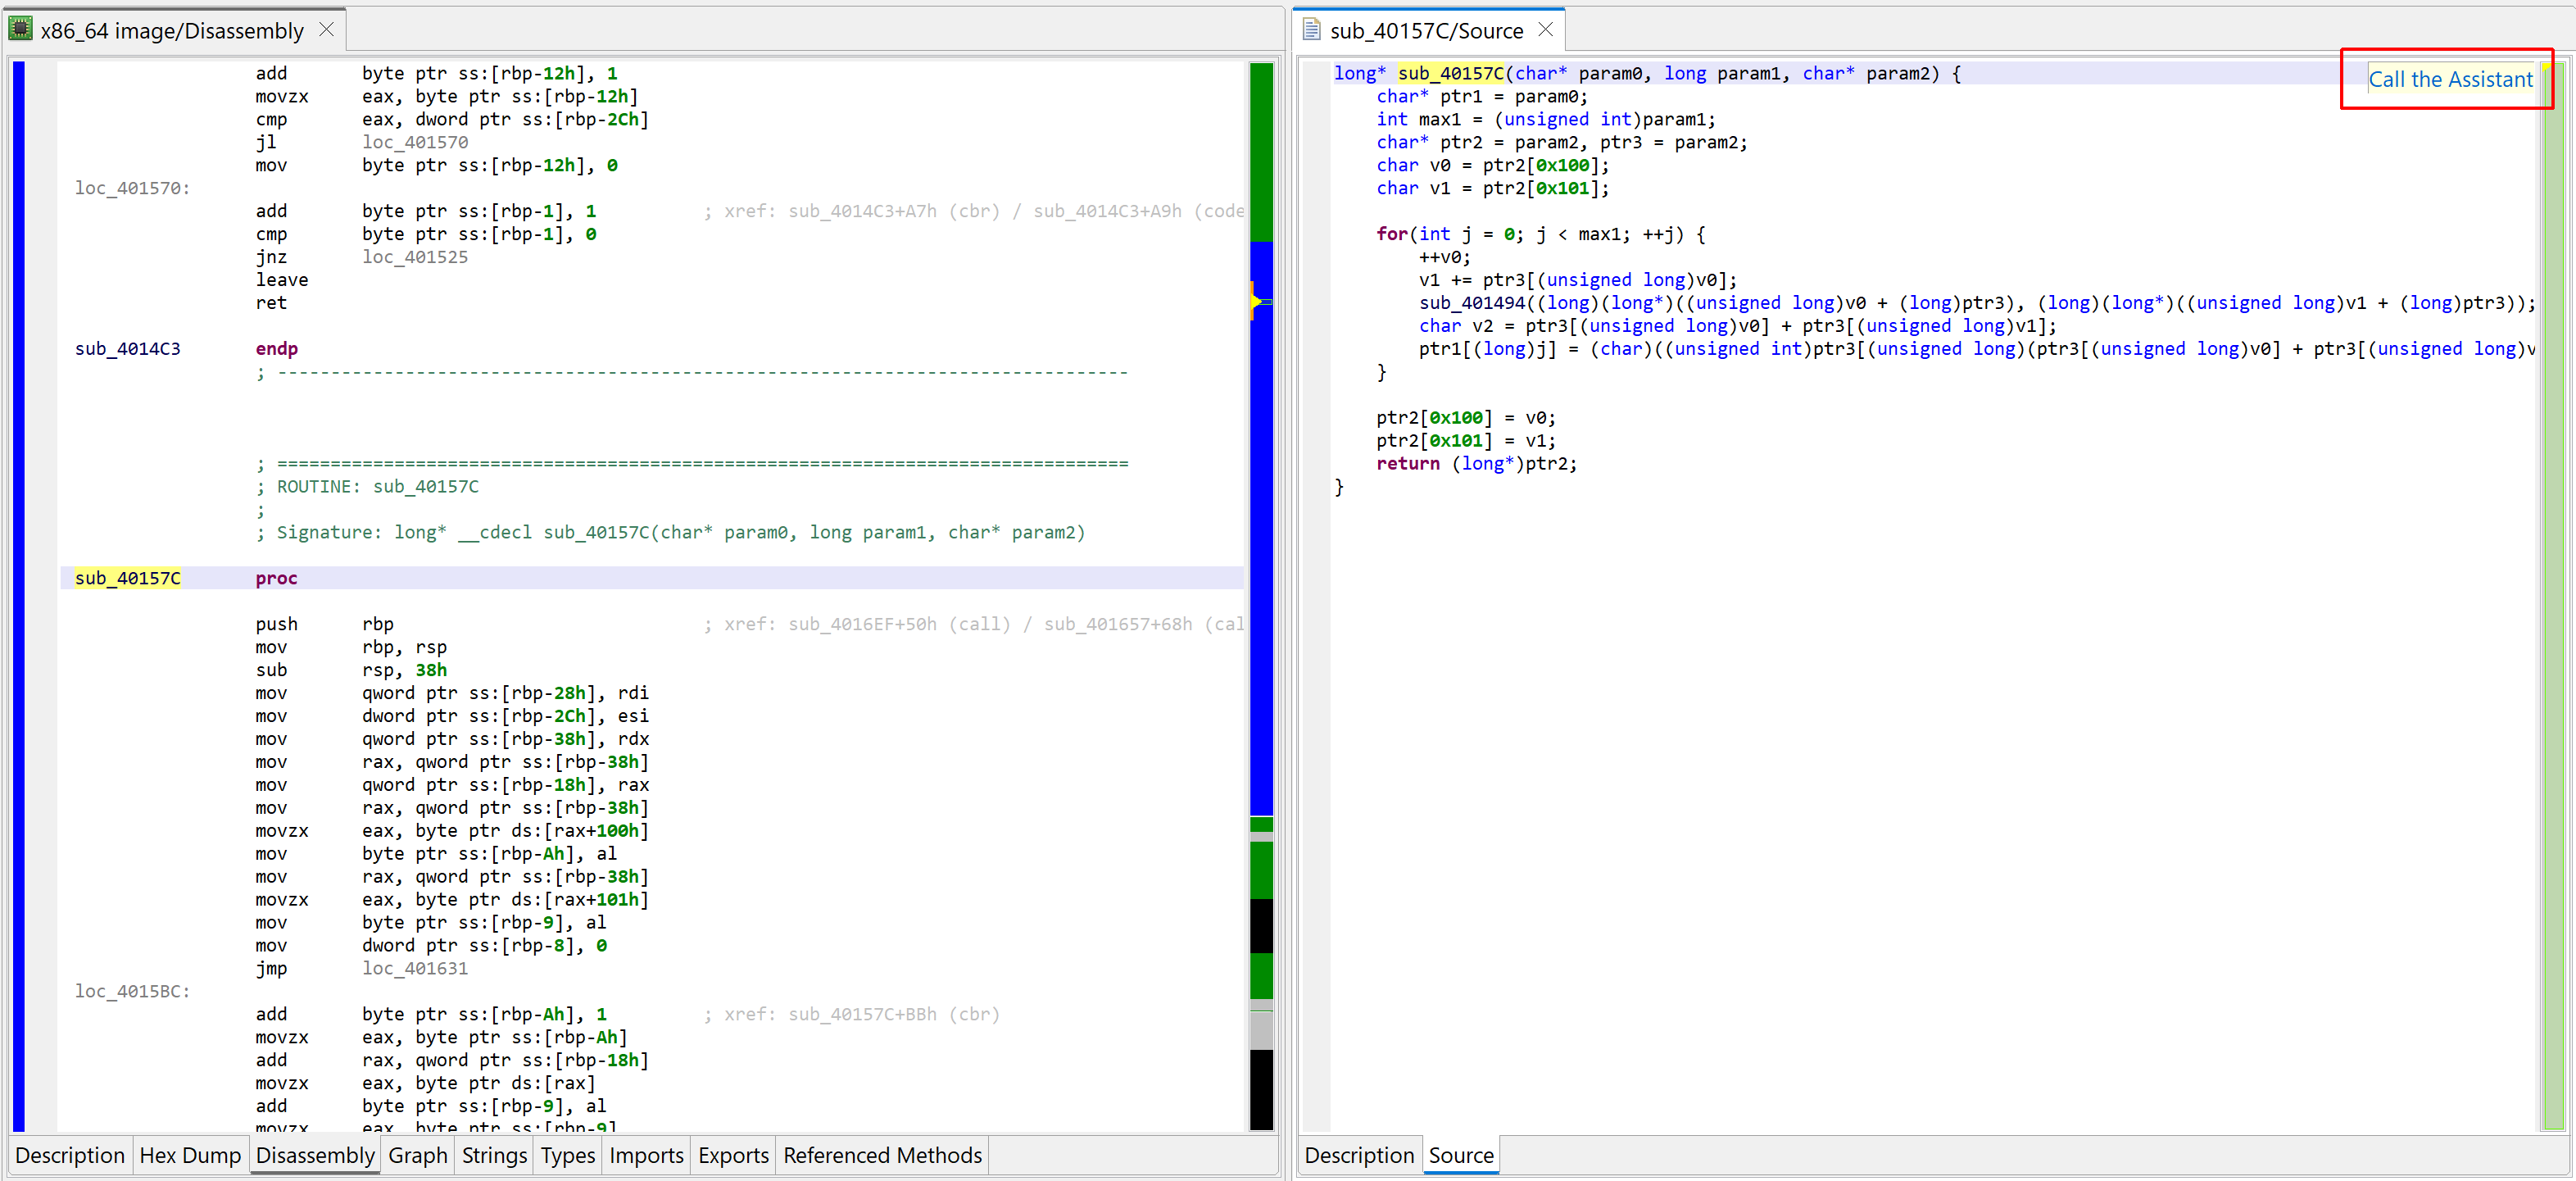
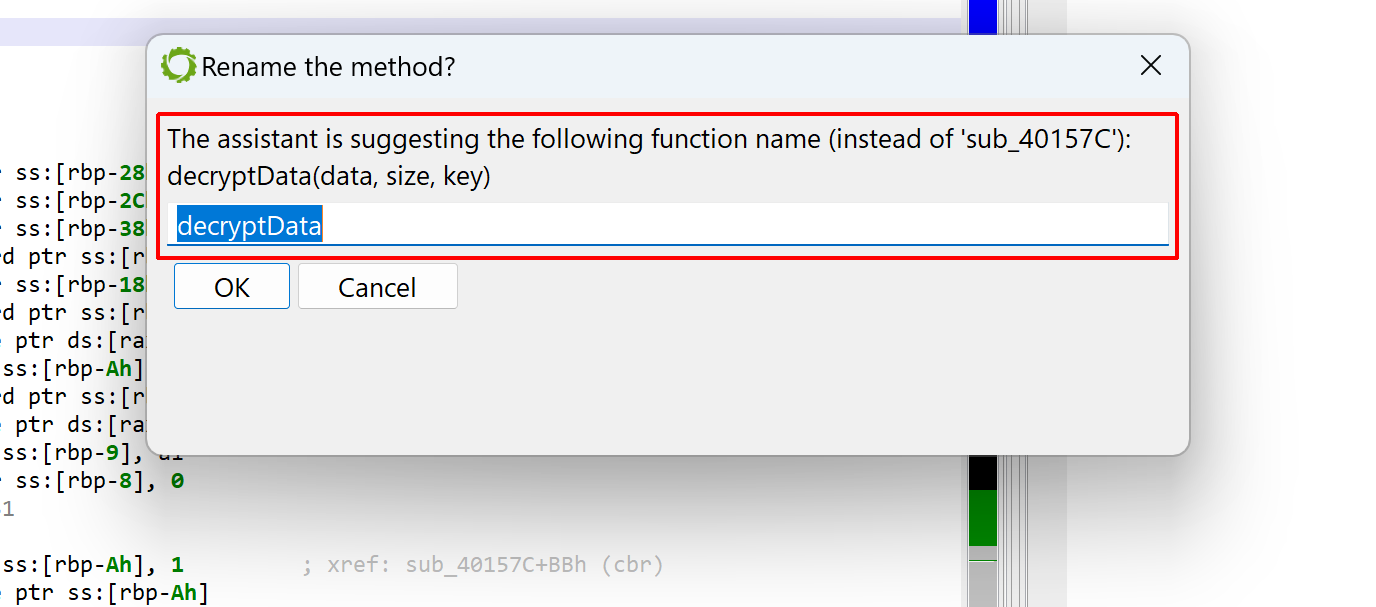
Below is a decompiled aarch64 routine found in the BPFDoor malware. A raw decompilation does not produce any useful name (the default routine name is sub_40157C).
An unnamed arm64 decompiled routine
You may click the “Call the Assistant” button (also available via the Action menu, Request Assistant handler, or the back-tick keyboard shortcut) to query the assistant via JEB.IO. At the time of writing, a JEB.IO account is not required to access the assistant.
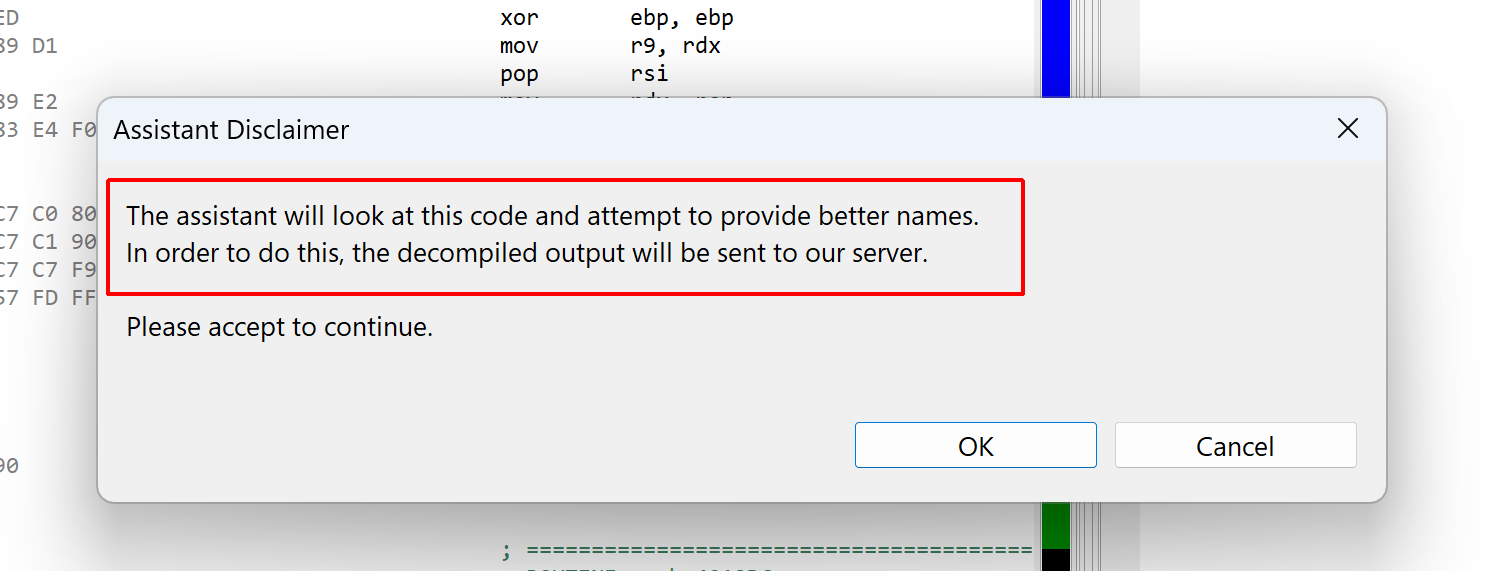
Upon first request, a disclaimer will be shown, letting you know that the decompiled code must be sent to our server:
The disclaimer is shown the first time the assistant is called
The assistant may return a better name for the method and its parameters. Sometimes, the names may be incorrect, yet provide some insight into what the method is doing. Other times, they may be entirely out of scope! It is always better to take the provided results as hints, rather than absolute truths.
In the case of our mysterious method, the assistant did provide valuable information: decryptData(data, size, key). Indeed, the method is a decryption function — more specifically, rc4 with a pre-computed sbox. The parameter names are (almost) correct.
You may decide to apply the suggested method name directly. The suggested parameter names are not applied automatically.
The assistant is providing the suggestions, it is up to the user to apply them
Currently, some limitations apply:
The assistant is not available via the JEB API and requests are rate-limited (at most one every 5 seconds).
The suggestions are mostly for class, method, and field names. Sometimes, suggestions for variable names are returned as well, but won’t be auto-applied.
A JEB.IO account is not required at this time to use the assistant! Anybody can use it to (sometimes) gain insight into obscure decompilations. We hope it will help you in your reverse-engineering efforts. Please let us know your feedback through the usual channels (email, Slack, etc.).