JEB Native Analysis Pipeline – Part 2: IR Optimizers

In part 1 of this series, we gave an overview of the Intermediate Representation used by JEB’s Native Analysis Pipeline, as well as a simple Python script demonstrating how to use the API to access and print out IR-CFG of decompiled routines.

In part 2, we continue our exploration of JEB IR. We will show how to write a custom IR optimizer plugin to clean-up a custom obfuscation used in a piece of code. The resulting decompiled C code will end up very readable as well.

Before you proceed, make sure to update JEB Pro to version 3.1.1+.

Obfuscated Crypto-stealer Code

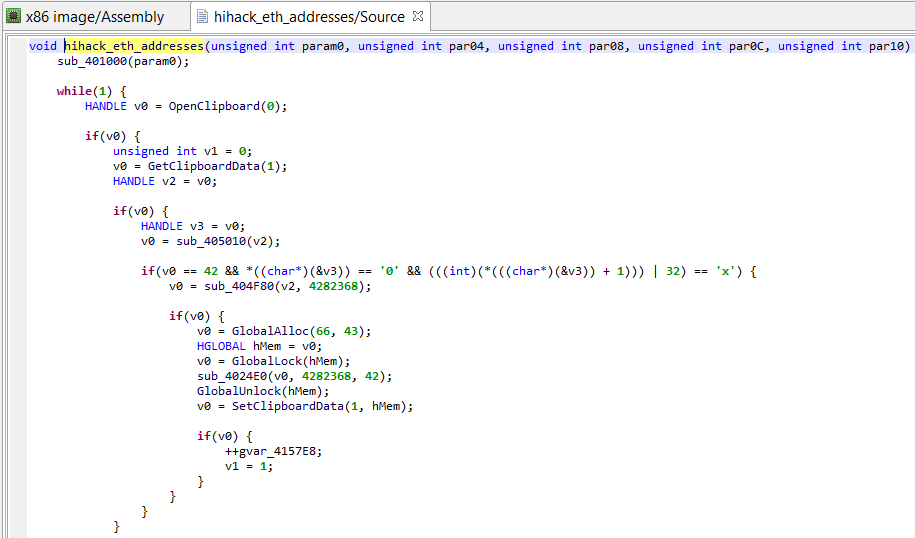
The sample we are going to look at monitors Windows clipboards for cryptocurrency-looking wallet addresses, and replaces them with a desired target address. The sample is specifically targeting Ethereum wallet addresses. It is a neutered final stage payload – the recipient address has been scrambled to render the code ineffective.

PE characteristics of file 1.exe

Although the payload is unpacked, what is interesting is that one of its key routines is obfuscated: custom garbage code was inserted.

Junk (useless) assignments

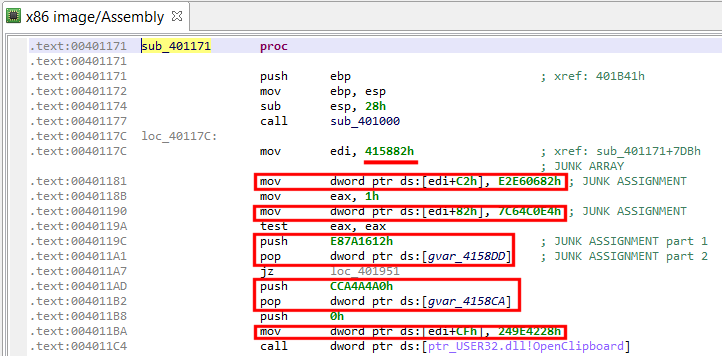
The garbage code is easy to go through: a bit of manual analysis shows that junk instructions are assigning pseudo-random values to an array whose bytes are never used. Two types of assembly patterns are present:

1- mov dword ptr [edi + offset], junk_value ; edi previously init. to
; junkarray address
2- push junk_value
pop dword ptr [junkarray_address + offset]

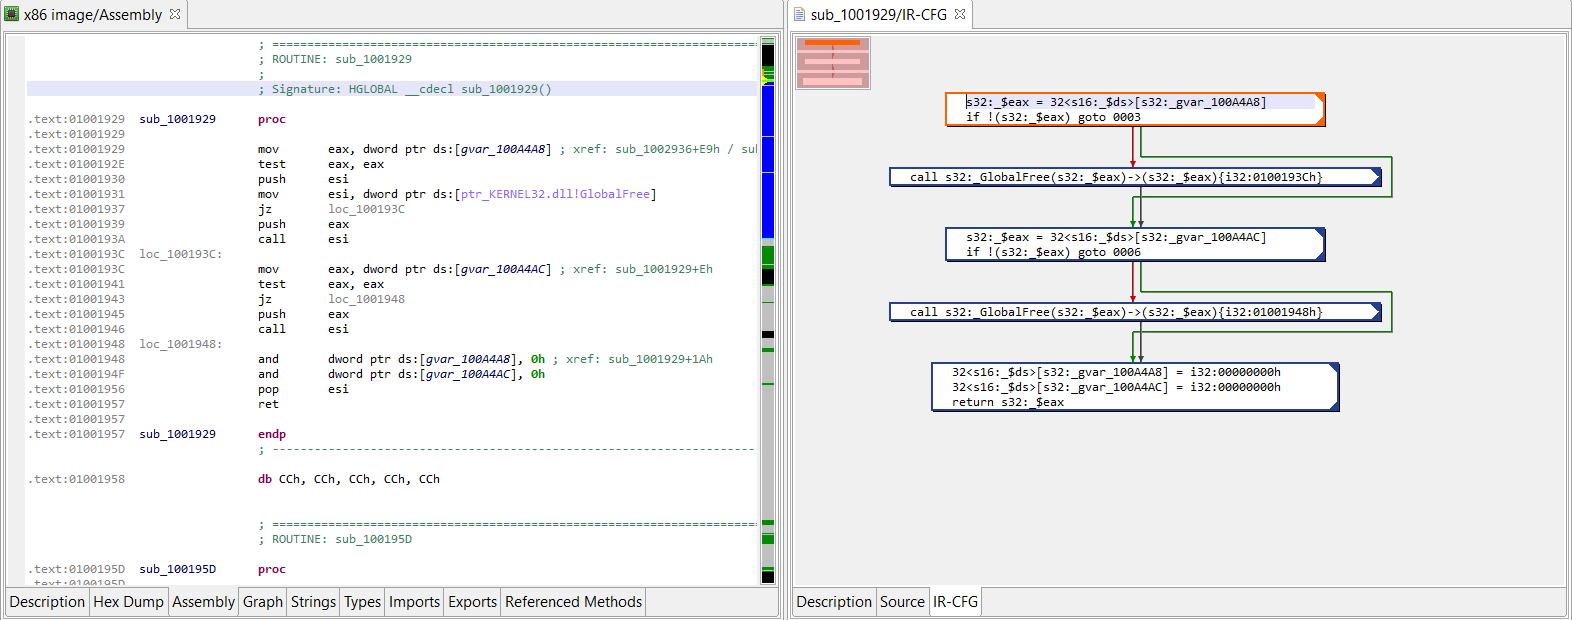
If we decompile that code and look at the final IR (as shown below), we can see that those instructions ended up being converted and optimized to the following type of assignment:

Assign(Mem(mem_address), Imm(junk_value))

Currently, the decompiled code looks like the following, hard-to-digest blob:

Snippet of decompiled code (obfuscated)

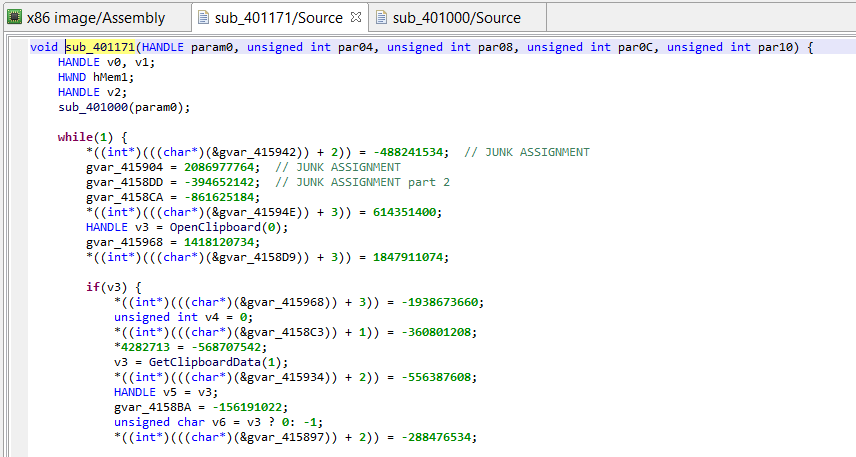
Although quite painful to read, we can follow the program’s logic by abstracting away the junk assignments. (Essentially, win32 functions’ OpenClipboard, GetClipboardData, and SetClipboardData are used to retrieve, check, and replace copy-pasted Ascii and Unicode text, if they match the following pattern “/0x(..){20}/”. The replacement string target wallet address, previously decrypted by sub_401000.)

Cleaning the Intermediate Representation

Recall that the native analysis pipeline can be simplifed as the workflow below:

CodeObject (*)
-> Reconstructed Routines & Data
-> Conversion to IR (low-level, non-optimized)
-> IR Optimizations <--- this is where we'll work
-> Final IR (higher-level, optimized, typed)
-> Generation of AST
-> AST Optimizations
-> Final AST (final, cleaned)
-> High-level output (eg, C variant)

Our custom IR optimizer will look for junk assignments and remove them. The important criteria are: What is the junk array start and end addresses? Is it common to all routines in the binary, or is there one array per routine? Those questions may be hard to answer in the general case. However, for our specific sample file, we can assert with a high-degree of certainty that the junk array:
– starts at address 0x415882
– is at most 256 bytes long
– is used solely by sub_401171, the routine we want to analyze

Because of the above restrictions, the IR optimizer we are going to write should be qualified as a custom or ad-hoc IR optimizer. Chances are, we won’t be able to reuse it as-is in other programs without some amount of tweaking.

Let’s get started, we will:
– create an Eclipse project with scaffold code for a Java back-end plugin
– write and test a custom IR optimizer with a headless client
– deploy the plugin and make it usable and accessible from the UI desktop client

Creating a Plugin Project

Before we proceed, make sure to:

  • Define an environment variable JEB_HOME, that points to your JEB installation folder
  • Install Eclipse IDE

Then:

  • Clone the jeb-native-ir-optimizer-example1 repository.
  • Create an Eclipse project by running:
    • On Windows: create-eclipse-project.cmd
    • On Linux/macOS: create-eclipse-project.sh
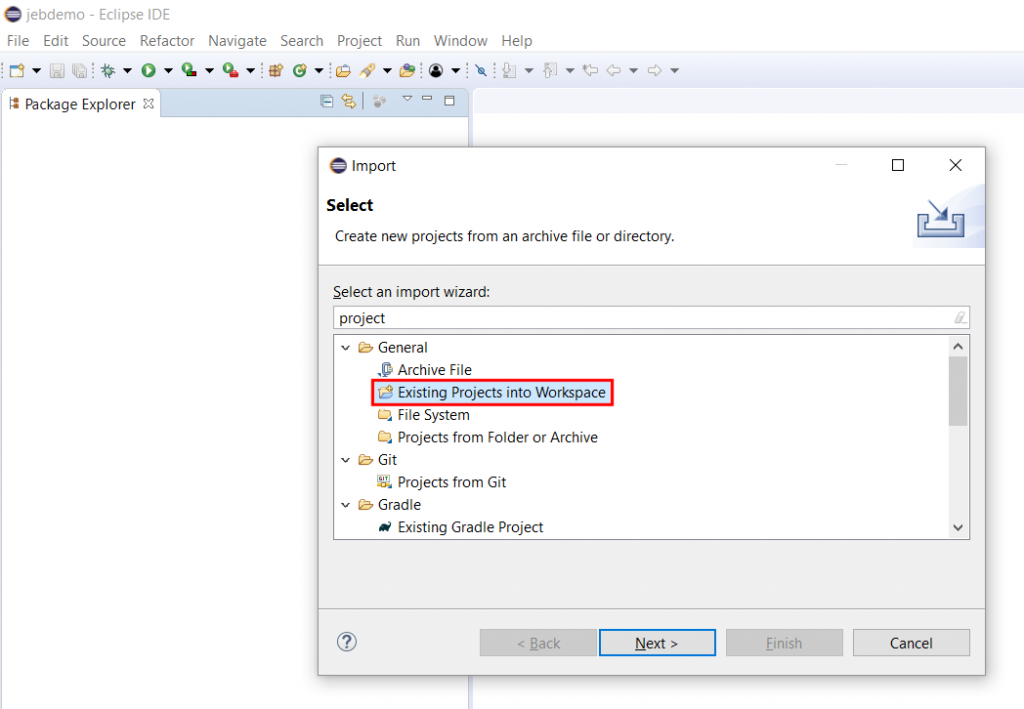
  • Open Eclipse and import the newly-created project into your Workspace (File, Import, Existing Projects into the Workspace, select the cloned repository folder, proceed)
Importing an existing project into Eclipse

Debugging the Obfuscation

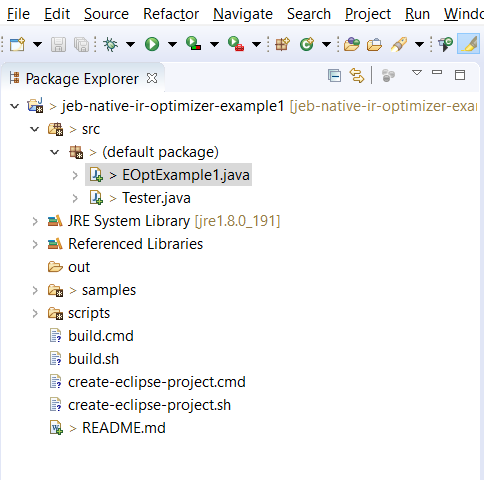
Now that your project is imported in Eclipse, you should be able to see two source files in src’s default package:

  • Tester.java
  • EOptExample1.java

EOptExample1 is the IR optimizer plugin we will be working on. (Note that several classes of plugins exist, this one is a native IR optimizer, and therefore inherits from AbstractEOptimizer or one its subclasses.)

Tester creates a headless JEB instance that loads the plugin EOptExample1.

Package Explorer view of the newly-created project

Tester.java does the following:

  • Create a JEB instance 1
  • Load the test plugin EOptExample1
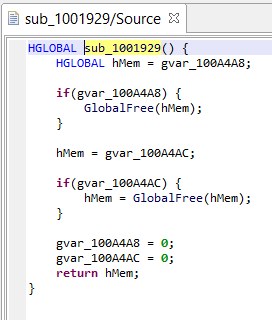
  • Then, create a JEB project and load the artifact file samples/1.exe (IMPORTANT: unzip 1.zip to 1.exe first – password: password)
  • Analyze the artifact
  • Retrieve a handle on the native decompiler
  • Retrieve a handle on the to-be-analyzed routine sub_401171
  • Perform a full decompilation of that routine

Let’s have a preliminary look at EOptExample1: This IR optimizer type is set to STANDARD, which is not ideal when you use custom optimizers tailored for specific code. A better IR optimizer class for those is ON_DEMAND: those optimizers are to be manually invoked, e.g. from JEB UI (menu: File, Advanced Unit Options). However, during development, since we are focusing on a particular file and routine, STANDARD type may be fine. Standard optimizers are called during regular IR optimization phases of the decompilation pipeline.

public class EOptExample1 extends AbstractEOptimizer {

    public EOptExample1() {
        super(DataChainsUpdatePolicy.UPDATE_IF_OPTIMIZED);
        getPluginInformation().setName("Sample IR Optimizer #1");
        getPluginInformation().setDescription("Remove IR-statements reduced to \"*(&garbage + delta) = xxx\"");
        getPluginInformation().setVersion(Version.create(1, 0, 0));
        // Standard optimizers are normally run, as part of the IR optimization stages in the decompilation pipeline
        setType(OptimizerType.STANDARD);
    }

    // replace all IR statements previously reduced to EMem ("[junk_address] = xxx") to ENop
    @Override
    public int perform(boolean updateDFA) {
        logger.info("IR-CFG before running custom optimizer \"%s\":\n%s", getName(),
                DecompilerUtil.formatIRCFGWithContext(2, cfg, ectx));
        // ...
        // optimizer code
    }
}

Note the plugin’s data-chains update policy, set to UPDATE_IF_OPTIMIZED. Optimizations that specify this flag tell their runner, aka the master optimizer that orchestrate them, that identifiers may be modified – hence, if optimizations occurred, a data flow analysis (DFA) pass needs to take place again. DFA update policies are a topic for another article.

Lines 3-5 are plugin metadata information, such as name and description, authorship, version numbers (including minimum/maximum JEB back-end versions), etc.

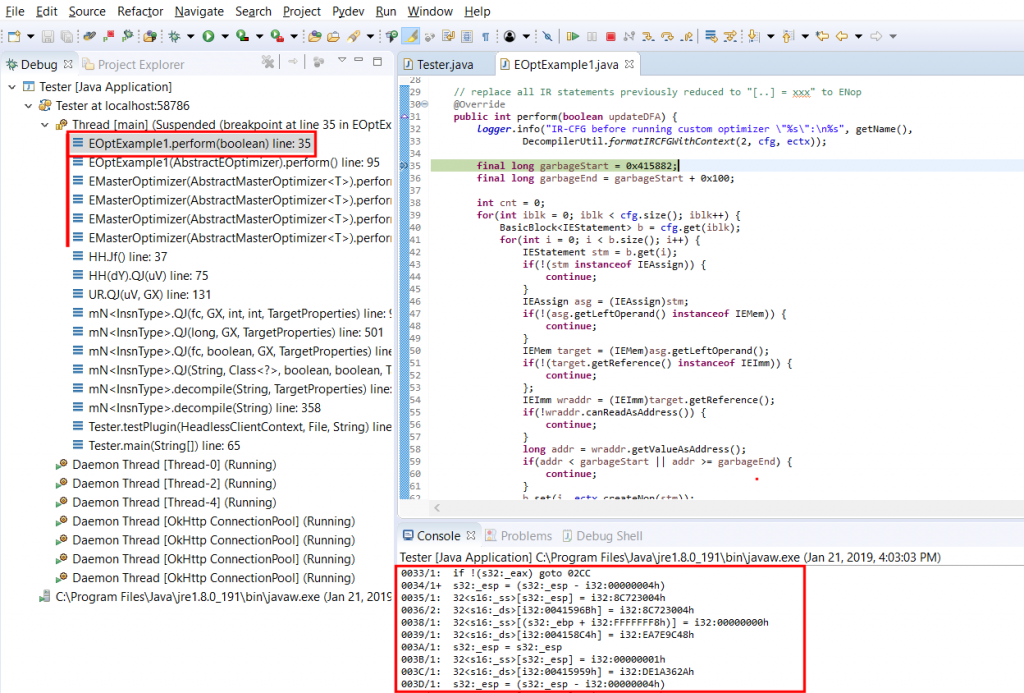
Before we deep-dive into perform(), let’s first set a breakpoint on line 15, where logger.info(…) is called. Then, start a debugging session for Tester: menu Run, command Debug (hotkey: F11.)

After a few seconds of analysis, your breakpoint should be hit; it corresponds to the first-time invocation of your custom optimizer. The logger prints out the IR-CFG that’s about to be optimized. Let’s have a look at it:

IR-CFG before running custom optimizer "Sample IR Optimizer #1":
>> IN(@0): ecx={@D} esp={@0} ebp={@1} ss={@1,@C,@18,@1D,@21,@24,@25,@27,@30,@35,@38,@3B,@3E,@3F,@41,@43,@46,@4F,@51,@54,@56,@59,@5C,@5D,@5F,@6B,@77,@81,@84,@9B,@9E,@A0,@AC,@B8,@BA,@BD,@BF,@C3,@C5,@C7,@CB,@CD,@D1,@D2,@D4,@E0,@E9,@EF,@F1,@F5,@F7,@FB,@FC,@FE,@100,@103,@106,@107,@109,@10C,@10E,@112,@114,@116,@11A,@11C,@11F,@122,@123,@12E,@131,@133,@137,@139,@13D,@13E,@140,@143,@145,@149,@14B,@14F,@150,@152,@15D,@173,@176,@179,@17C,@17D,@17F,@181,@18A,@18C,@18F,@191,@194,@196,@19A,@19D,@19E,@1A0,@1B3,@1BF,@1C2,@1D9,@1DC,@1E0,@1EC,@1EF,@1F1,@1F3,@1F7,@1F9,@1FC,@1FF,@202,@203,@205,@211,@21D,@220,@222,@226,@227,@229,@22B,@22E,@231,@232,@234,@237,@23A,@23C,@23E,@242,@244,@246,@24A,@24C,@250,@251,@25C,@25F,@262,@263,@265,@268,@26A,@26E,@271,@272,@27A,@27F,@295,@298,@29A,@29D,@2A4,@2A9,@2AD,@2B0,@2B2,@2B6,@2B7,@2BA,@2BC,@2C0,@2C2,@2C6,@2C7,@2CA,@2CD,@2D2,@2DE,@2E4,@2E7,@2E8,@2EA} ds={@F,@11,@19,@1E,@22,@28,@31,@36,@39,@3C,@40,@44,@4C,@4E,@52,@55,@57,@5A,@60,@6C,@74,@78,@7B,@82,@85,@86,@87,@8E,@90,@92,@9C,@A1,@A3,@A4,@AD,@B5,@B7,@BB,@C0,@C4,@C8,@CE,@D5,@E1,@EA,@ED,@F2,@F8,@FD,@FF,@101,@104,@10A,@10F,@113,@117,@11B,@11D,@120,@124,@12F,@134,@13A,@13F,@141,@146,@14C,@153,@15A,@15C,@163,@165,@166,@167,@170,@171,@174,@177,@17A,@17E,@180,@187,@189,@18D,@192,@197,@19B,@1A1,@1AB,@1B4,@1B7,@1B9,@1C0,@1C3,@1C4,@1C5,@1CC,@1CE,@1D0,@1DA,@1DD,@1DE,@1E1,@1E9,@1ED,@1F0,@1F4,@1FA,@1FD,@200,@206,@212,@219,@21B,@21E,@223,@228,@22A,@22C,@22F,@235,@238,@23B,@23F,@243,@247,@24D,@252,@25B,@25D,@260,@264,@266,@26B,@26F,@273,@27B,@27E,@285,@287,@288,@289,@292,@293,@296,@29B,@2A5,@2AA,@2AE,@2B3,@2B8,@2BD,@2C3,@2C8,@2CE,@2D0,@2D3,@2DF,@2E1,@2E2,@2E5,@2EB} OpenClipboard={@25} GetClipboardData={@3F,@17D} GlobalAlloc={@FC,@227} GlobalLock={@107,@232} GlobalUnlock={@13E,@263} SetClipboardData={@150,@272,@2B7,@2C7} CloseClipboard={@2CB} Sleep={@2E8} sub_401000={@D} sub_405010={@5D} sub_404F80={@D2} sub_4024E0={@123,@251} sub_404E54={@19E} sub_404E14={@203} 
0000/1>  s32:_esp = (s32:_esp - i32:00000004h)                                                                 DU: esp={@1,@2,@B}                 | UD: esp={} 
0001/1:  32<s16:_ss>[s32:_esp] = s32:_ebp                                                                      DU:                                | UD: esp={@0} ebp={} ss={} 
0002/9:  s32:_ebp = s32:_esp                                                                                   DU: ebp={@38,@41,@46,@4F,@54,@56,@84,@9E,@B8,@BD,@C5,@FE,@100,@10C,@114,@11C,@131,@140,@15D,@176,@17F,@181,@18A,@18F,@194,@1C2,@1DC,@1EF,@1F1,@1FC,@229,@22B,@237,@23C,@244,@25C,@265,@27F,@298,@29D}  | UD: esp={@0} 
000B/1:  s32:_esp = (s32:_esp - i32:0000002Ch)                                                                 DU: esp={@C,@D,@17}                | UD: esp={@0} 
000C/1:  32<s16:_ss>[s32:_esp] = i32:0040117Ch                                                                 DU:                                | UD: esp={@B} ss={} 
000D/1:  call s32:_sub_401000(s32:_ecx)->(s32:_eax){32[s32:_esp]}                                              DU: eax={}                         | UD: ecx={} esp={@B} sub_401000={} 
000E/1+  s32:_edi = i32:00415882h                                                                              DU: edi={}                         | UD: 
000F/1:  32<s16:_ds>[i32:00415944h] = i32:E2E60682h                                                            DU:                                | UD: ds={} 
0010/1:  s32:_eax = i32:00000001h                                                                              DU: eax={}                         | UD: 
0011/6:  32<s16:_ds>[i32:00415904h] = i32:7C64C0E4h                                                            DU:                                | UD: ds={} 
0017/1:  s32:_esp = (s32:_esp - i32:00000004h)                                                                 DU: esp={@18,@1A}                  | UD: esp={@B,@2EC} 
0018/1:  32<s16:_ss>[s32:_esp] = i32:E87A1612h                                                                 DU:                                | UD: esp={@17} ss={} 
0019/1:  32<s16:_ds>[i32:004158DDh] = i32:E87A1612h                                                            DU:                                | UD: ds={} 
001A/1:  s32:_esp = (s32:_esp + i32:00000004h)                                                                 DU: esp={@1C}                      | UD: esp={@17} 
001B/1:  nop                                                                                                   DU:                                | UD: 
001C/1+  s32:_esp = (s32:_esp - i32:00000004h)                                                                 DU: esp={@1D,@20}                  | UD: esp={@1A} 
001D/1:  32<s16:_ss>[s32:_esp] = i32:CCA4A4A0h                                                                 DU:                                | UD: esp={@1C} ss={} 
001E/2:  32<s16:_ds>[i32:004158CAh] = i32:CCA4A4A0h                                                            DU:                                | UD: ds={} 
0020/1:  s32:_esp = s32:_esp                                                                                   DU: esp={@21,@23}                  | UD: esp={@1C} 
0021/1:  32<s16:_ss>[s32:_esp] = i32:00000000h                                                                 DU:                                | UD: esp={@20} ss={} 
0022/1:  32<s16:_ds>[i32:00415951h] = i32:249E4228h                                                            DU:                                | UD: ds={} 
0023/1:  s32:_esp = (s32:_esp - i32:00000004h)                                                                 DU: esp={@24,@25,@26}              | UD: esp={@20} 
0024/1:  32<s16:_ss>[s32:_esp] = i32:004011CAh                                                                 DU:                                | UD: esp={@23} ss={} 
0025/1:  call s32:_OpenClipboard(32<s16:_ss>[(s32:_esp + i32:00000004h)])->(s32:_eax){32[s32:_esp]}            DU: eax={@33}                      | UD: esp={@23} ss={} OpenClipboard={} 
...
... (trimmed)
...

The above IR listing is a human-friendly representation of IR statements. The general format of this listing is:

cnt   what
1 >> IN(@EntryOffset){live_inputs}
1* offset/lengthC <insn> | DU:<def-use-chains> UD:<use-def-chains>
0+ << OUT(@ExitOffset){reaching_outputs}


- offset: IR statement offset
- length: IR statement length (generally, 1)
- C: indicates whether the instruction is
- the entry-point instruction (>)
- the first of a basic-block (+)
- any other instruction (:)
- insn: IR statement instruction (refer to Part 1 of this blog series)
- DU/UD: routine def-use and use-def chains
- IN: live input variables at the entry-point
- OUT: reaching output variables at a given exit point
We breakpoint’ed on logger.info(), and single-stepped one line. The output can be seen in the console view. It may be better (depending on how large your console buffer is) to examine the full output dumped to jeb-plugin-tester.log in your Temp folder.

The IR listing is relatively readable, although quite verbose at this early stage of optimization (roughly, the first pass in tier 1 of the analysis pipeline). The important idioms to look at here are:

Preliminary conversion of low-level junk inserts

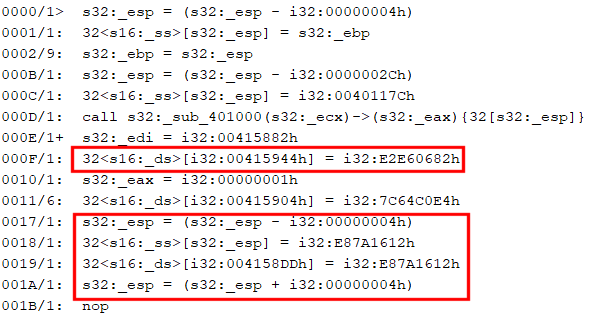
a/ The first one is an Assign(Mem(Imm), Imm), which corresponds to optimized “mov [edi + offset], value”, where the value of edi was determined, propagated further, and the addition folded and converted to an immediate address.

b/ The second one is a partially optimized “push value / pop [address]”. Later optimizations phases will find and remove esp updates or esp-based operations, as was shown in the pseudo-code earlier. What we need to focus on here is the Assign(Mem(Imm), Imm), like the one in a/.

Those are the bits we will look for and modify: Assuming those assignments are useless, we will simply replace them by Nop statements.

Writing the Optimizer

At this point, our preliminary understanding of the obfuscation is enough to start writing the clean-up optimizer. Its code is extremely simple, for two main reasons:
– The obfuscation scheme itself is relatively trivial
– Other built-in JEB optimizers are giving us clean IR assignments to work on

Let’s look at the code of proceed():

    @Override
    public int perform(boolean updateDFA) {
        final long garbageStart = 0x415882;
        final long garbageEnd = garbageStart + 0x100;        
        int cnt = 0;
        for(int iblk = 0; iblk < cfg.size(); iblk++) {
            BasicBlock<IEStatement> b = cfg.get(iblk);
            for(int i = 0; i < b.size(); i++) {
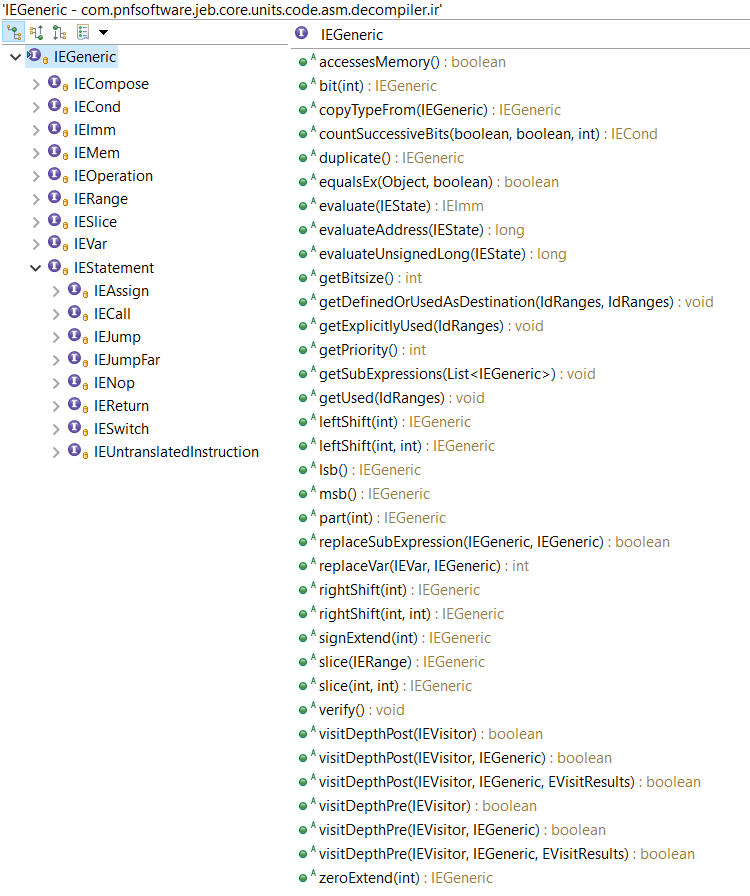
                IEStatement stm = b.get(i);
                if(!(stm instanceof IEAssign)) {
                    continue;
                }
                IEAssign asg = (IEAssign)stm;
                if(!(asg.getLeftOperand() instanceof IEMem)) {
                    continue;
                }
                IEMem target = (IEMem)asg.getLeftOperand();
                if(!(target.getReference() instanceof IEImm)) {
                    continue;
                };
                IEImm wraddr = (IEImm)target.getReference();
                if(!wraddr.canReadAsAddress()) {
                    continue;
                }
                long addr = wraddr.getValueAsAddress();
                if(addr < garbageStart || addr >= garbageEnd) {
                    continue;
                }
                b.set(i, ectx.createNop(stm));
                cnt++;
            }
        }
        return postPerform(updateDFA, cnt);
    }

This optimizer inherits from AbstractEOptimizer. Therefore, the perform() method works on an IR-CFG. (Not all optimizers may choose to do so; it is sometimes easier to work directly on statements or expressions.)

process() goes through all statements or every basic block of the IR-CFG. Using the instanceof operator, we check that the statement is an assignment such as: Mem(address) = Imm. The address is retrieved, and we make sure that it falls within the junk array. If those checks succeed, we replace the assignment by a Nop.

And that is it. Clean and simple – although, not quite portable, since the junk array address and size are hard-coded into the code! But that is not the point of this blog, and neither is portability a first-class goal when writing optimizers for custom code.

Next up, let’s see how to use the plugin in an interactive session using the desktop client.

Building, Deploying, Interactive Use

In order to use the optimizer within the JEB desktop client, we either:

  • Register the plugin as a development plugin;
  • Or build the plugin as a Jar and drop it in JEB’s coreplugins/ folder.

Development Plugin

This is the easiest option. You may consider it as an intermediate step between prototyping with the headless client, as demonstrated above, and a full-blown, deployed Jar plugin.

Open the Options panel, Development tab, tick the option “Development Mode”, add the bin/ folder of your plugin’s project to the classpath, and add the classname of your plugin entry-point:

Setting up a development plugin in JEB UI

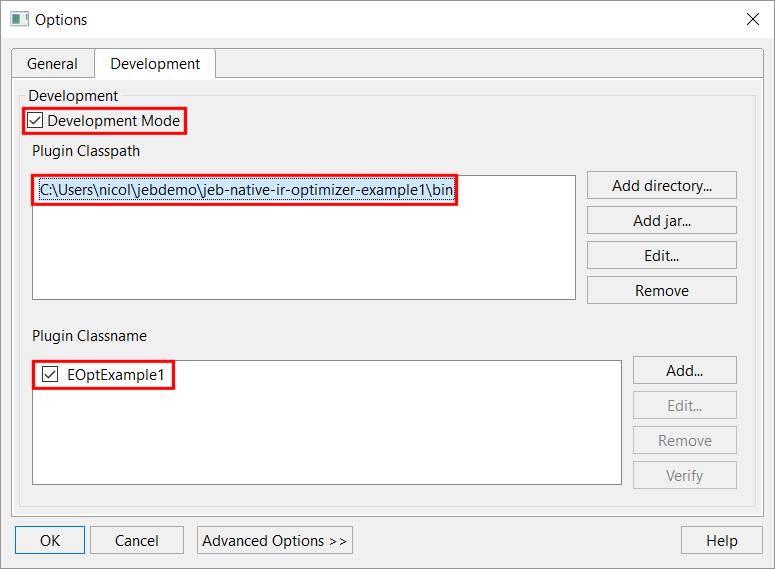
Press OK and restart JEB. Your plugin will be loaded and ready to use. You may now skip to the section “Using the IR optimizer plugin”.

Building a Jar plugin

The alternative is to run build.cmd (on Windows) or build.sh (on Linux/macOs), which calls an Ant script in the scripts/ folder, therefore, make sure to have Ant installed on your system first. You may also customize the plugin name and version before building.

The resulting Jar plugin file will be generated in your project’s out/ folder. Copy it to your JEB coreplugins/ folder and start the JEB client. Your plugin will be automatically loaded, along with the other plugins.

Using the IR Optimizer Plugin

If your plugin has the type STANDARD (default), then, as explained earlier, it will be invoked by the optimizations’ orchestrator automatically, at various times during the decompilation pipeline. If that’s the mode you’d like to choose, make sure that your plugin is generic enough to handle all types of input routines, else you’re in for some strange surprises if you ever forget to remove it from your coreplugins/ folder.

An alternative is to convert it to an on-demand plugin:

public EOptExample1() {
        super(DataChainsUpdatePolicy.UPDATE_IF_OPTIMIZED);
        getPluginInformation().setName("Sample IR Optimizer #1");
        getPluginInformation().setDescription("Remove IR-statements reduced to \"*(&garbage + delta) = xxx\"");
        getPluginInformation().setVersion(Version.create(1, 0, 0));

        // Standard optimizers are normally run, as part of the IR optimization stages in the decompilation pipeline
        //setType(OptimizerType.STANDARD);

        // alternative (better for production / in UI use):
        setType(OptimizerType.ON_DEMAND);
        setPreferredExecutionStage(-NativeDecompilationStage.LIFTING_COMPLETED.getId());
        setPostProcessingActionFlags(PPA_OPTIMIZATION_PASS_FULL);
    }

– Line 11 makes the optimizer on-demand. Users must manually activate it, on specific code.
– Line 12 is recommended for on-demand optimizers: we specify at which point in in the pipeline the plugin should be called.
– Finally, we set some post-processing flags, specifying that a full round of standard optimizations must be performed after our custom optimizer has run: this will allow cleaning up code remnants, and optimize our IR-CFG further – something made possible after running an optimization pass like this one.

On-demand optimizer plugins show up in the File, Advanced Unit Options dialog box, that you may bring up when a decompiled routine has the focus:

List of on-demand optimizers managed by a given decompiler instance

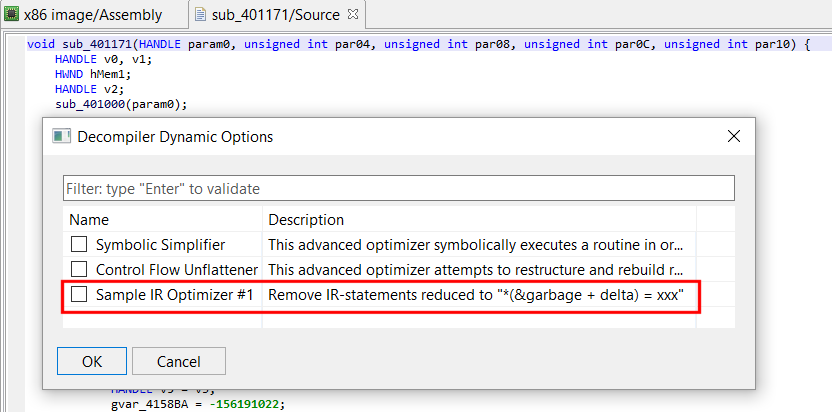
Tick the optimizer box, press OK. The routine will be re-decompiled.

Clean Code

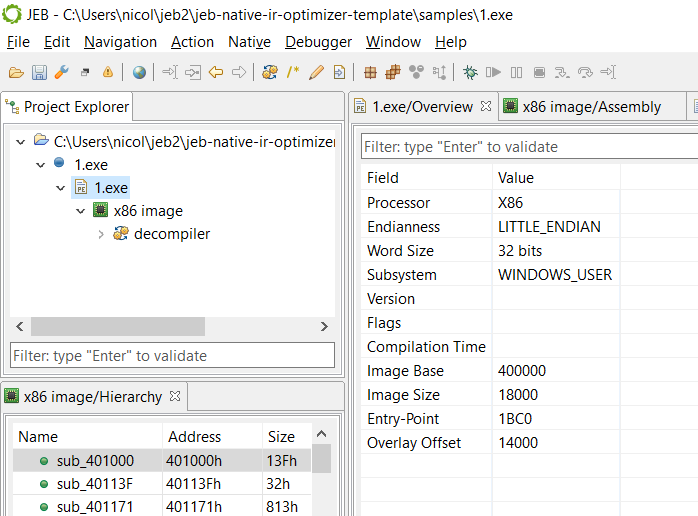
Regardless which method you choose, once cleaned up, the IR will allow for better downstream pipeline phases, including typing, AST generation, AST optimizations, etc.

The pseudo-C code has become quite readable:

The same decompiled method, after deobfuscation by the custom plugin.

Conclusion

That is it for part 2. We scratched the surface of IR optimizers (which themselves are a relatively small – albeit important – part of the overall decompilation pipeline 2) but it’s a good start. I strongly encourage you to experiment and ask your questions on our Slack channel. One ongoing effort right now is to bring the API documentation up to speed in terms of contents and sample code.

In part 3, we will continue exploring IR optimizers. Later on in the series, we will show how to write AST optimizers 3, how to write decompilation modules, and show how existing decompilers can be cutomized further. Stay tuned!

  1. JEB must have been previously run, at least once: EULA accepted, license key generated, etc.
  2. The decompilation pipeline is one component of the native analysis pipeline, which is one module, among tens, of the JEB back-end: the public API is worth exploring if you’re into advanced use cases.
  3. AST generation is one of the very final decompilation phases – working on the syntax tree serves different purposes than working on the IR

JEB 3.1 and JEB Home Edition x86

TLDR; 1/ JEB 3.1 is available for all, make sure to upgrade. 2/ We released JEB Home Edition x86 for individual users. Ideal for Windows malware analysis. Details follow.

JEB 3 Release

We are happy to announce that JEB3 is finally available for download! The Beta period spanned from June last year to early January this year, and we thank users who actively participated in it by providing feedback and reporting issues. Our continuous effort to add features – big and small – and scrap bugs is ongoing, as always.

If you are a registered user, you should have received an email letting you know that you can download and install JEB 3.1.0. (Users that were previously using JEB 2.3.x must install JEB3 in a separate location. You may also use both JEB2 and JEB3 concurrently, if you ever need to.) If you haven’t received an email (eg, you are not the primary licensee of a multi-user license), please reach out.

Below is a very high-level summary of the additions that went into JEB3:

  • New desktop client, lighter and faster. The JEB3 client also ships with a dark/solarized theme, and supports custom keyboard shortcuts.
  • Major upgrades to the native analysis pipeline. The decompilation pipeline is accessible and customizable at different stages, which we will detail in coming blogs. (We published part 1 of a series on writing custom IR optimizers and AST optimizers.)
  • New decompilers for Ethereum smart contracts (evm) and WebAssembly modules (wasm). As of JEB 3.1, JEB ships with 8 decompilers: dex/dalvik, x86, x86-64, arm, arm64 (aarch64), mips, wasm, and evm. A large chunk of our effort in 2019 will be focused on continuing our work on the native analysis and decompilation (eg, advanced optimization modules, release of the C++ reconstruction plugin, open-sourcing of advanced optimizers –1, 2-, etc.).
  • Type libraries for Windows, Linux, and Android-Linux sub-systems for common architectures (x86, x86-64, arm, aarch64, mips). Power users can also generate their own typelibs (eg, for custom SDKs).
  • Signature libraries for common library code on Windows (all versions of Visual Studio static libs) and Linux-Android (common Android NDK libs from NDK v11 onward).
  • Windows malware analysis and Android SO native files is enjoyable and practical with JEB. Combined with powerful, custom IR optimizers, the analysis of complex code is also possible.
  • Interactive global graphs. The desktop client provides this experimental feature, whose goal is to provide global, smart views of a program. More to come, including API to access the CFG graphs, callgraphs, and create custom graphs.

If you are not a registered user, we suggest you install a demo build and give JEB a try!

JEB Home Edition x86

The release of JEB 3.1 also marks the addition of a new type of licence, JEB Home Edition x86. While JEB Pro and JEB Android are subscription based license types for professional and corporate use, the Home Edition is designed for individuals such as hobbyists, students, or freelancers, who wish to legally acquire a professional reverse engineering tool for a reasonable price: $99, perpetual license, with updates for one year.

JEB Home Edition x86 has everything needed to perform analysis of x86 and x86-64 binaries, for most platforms. Here are the features and modules shipping with this license:

  • Support for all code objects, including ELF files, EXE binaries, DLL libraries, SYS drivers, headless firmware, etc.
  • Augmented disassembly, including resolution of dynamic callsites, candidate values determination for registers, dynamic cross-references, etc.
  • Decompilation of x86 and x86-64 to C-like source code. The decompiler includes advanced optimization passes to thwart protected or obfuscated code.
  • Win32 type libraries & WDK type libraries for efficient Windows file analysis. Power-users can generate their own typelibs as well (details)
  • Signature libraries for common SDK, including all versions of Microsoft Visual Studio.
  • Interactive layer for refactoring: type definition, stackframe building, renaming/commenting/cross-referencing, etc.
  • Client-side API access for scripting and automating tasks in Python.

Need more details? Check out the product features matrix. Finally, as said earlier, try out our JEB x86 demo first.

Thank you again for your support – and stay tuned. Lots of new items in the pipe for 2019 🙂

JEB Native Analysis Pipeline – Part 1: Intermediate Representation

JEB native code analysis components make use of a custom intermediate representation (IR) to perform code analysis.

Some background: after analysis of a code object, the native assembly of a reconstructed routine is converted to an intermediate representation. 1 That IR subsequently goes through a series of transformation passes, including massages and optimizations. Final stages include the generation of high-level C-like code. Most stages in this pipeline can be customized by users via the use of plugins. A high-level, simplified view of the pipeline could be as follows:

CodeObject (*)
-> Reconstructed Routines & Data
-> Conversion to IR (low-level, non-optimized)
-> IR Optimizations
-> Final IR (higher-level, optimized, typed)
-> Generation of AST
-> AST Optimizations
-> Final AST (final, cleaned)
-> High-level output (eg, C variant)

(*) Examples of code objects: a Windows PE file with x86-code, an ELF library with with MIPS code, a headless ARM firmware, a Wasm binary file, an Ethereum smart contract, etc.

Two important JEB API components to hook into and customize the native analysis pipeline are:
– The IR classes
– The AST classes
We will start looking at IR components through the rest of this part 1.

IR Description

JEB IR can be seen as a low-level, imperative assembly language, made of expressions. Highest-level expressions are statements. Statements contain expressions. Generally, expressions can contain expressions. IR can be accessed via interfaces in the JEB API. The top-level interface for all IR expressions is IEGeneric. All IR elements start with IExxx. 2

The diagram below shows the current hierarchy of IR expression interfaces:

Note that IEGeneric sits at the top. All other IRE’s (short for IR Expressions from now on) derive from it. Let’s go through those interfaces:

  • IEImm: Integer immediate of arbitrary length. Eg,
    Imm(0x1122, 64) would represent the 64-bit integer value 0x1122.
  • IEVar: Generic IRE to represent variables. Variables can represent underlying physical registers, virtual registers, local function variables, global program variables, etc.
  • IEMem: Piece of memory of arbitrary length. The memory address itself is an IRE; the accessed bitsize is not.
  • IECond: A ternary expression “c ? a: b”, where a, b and c are IRE’s.
  • IERange: A fixed integer range, commonly used with Slice
  • IESlice: A chunk (contents range) of an existing IR. Eg, Slice(Imm(0x11223344, 32), 16, 24)) can be simplified to Imm(0x22, 8)
  • IECompose: The concatenation of two or more IRE’s (IR0, IR1, …), resulting in an IR of size SUM(i=0->n, bitsize(IRi))
  • IEOperation: A generic operation expression, with IRE operands and an operator. Eg, Operation(ADD,Imm(0x10,8),Mem(Imm(0x10000,32),8)). Most standard operators are supported, as well as less standard operators such as the Parity function or Carry function.)
  • IEStatement: the super-interface for IR statements; we will detail them below.

An IR translation unit, resulting from the conversion of a native routine, consists of a sequential list of IEStatement objects. An IR statement has a size (generally, but not necessarily, 1) and an address (generally, a 0-based offset relative to its position in the translation unit).

As of JEB 3.0.8, IR statements can be:

  • IEAssign: The most common of all statements: an assignment from a right-side source to a left-side destination. While the source can be virtually anything, the destination IRE is restricted to a subset of expressions.
  • IENop: This statement does nothing but consumes virtual size in the translation unit.
  • IEJump: An unconditional or conditional jump within the translation unit, expressed using IR offsets.
  • IEJumpFar: An unconditional or conditional far jump (can be outside the translation unit), expressed using native addresses.
  • IESwitch: The N-branch equivalent of IEJump.
  • IECall: Represent a well-formed static or dynamic dispatch to another IR translation unit. The dispatch expression can be any IRE (eg, an Imm for a static dispatch; a Var or Mem for a dynamic dispatch).
  • IEReturn: A high-level expression used to denote a return-to-caller from a translation unit representing a routine. This IRE is always introduced by later optimization passes.
  • IEUntranslatedInstruction: This powerful statement can be used to express anything. It is generally used to represent native instructions that cannot be readily translated using other IR expressions. (Users may see it as an IECall on steroid, using native addresses. In that sense, it is to IECall what IEJumpFar is to IEJump.)

Now, let’s look at a few examples of conversions.

IR Examples

Let’s assume the following EVars were previously defined by an Intel x86 (or x86-64) converter: tmp (a 32-bit EVar representing a virtual placeholder register); eax (an EVar representing the physical register %eax); ?f (1-bit EVars representing standard x86 flags).

  • x86: mov eax, 1
s32:_eax = s32:00000001h

Translating this mov instruction is straight-forward, and can be done with a single Assign IR statement.

  • x86-64: not r9d
s64:_r9 = C(~(s64:_r9[0:32[), i32:00000000h)

Translating a not-32-bit-register on an x86-64 platform is slightly more complex, as the upper 32-bit of the register are zeroed out. Here, the converter is making use of three nested IREs: (IECompose(IEOperation(NOT, Slice(r9, 0, 32))))

Reading IR. IECompose are pretty-printed as C(lo, …, hi), IESlice as Expr[m:n[ 

  • x86-64: xor rax, qword ds:[ecx+1]
0000 : s64:_rax = (s64:_rax ^ 64<s16:_ds>[(s64:_rcx[0:32[ + i32:00000001h)])
0001 : s1:_zf = (s64:_rax ? i1:0 : i1:1)
0002 : s1:_sf = s64:_rax[63:64[
0003 : s1:_pf = PARITY(s64:_rax[0:8[)
0004 : s1:_of = i1:0
0005 : s1:_cf = i1:0

One side-effect of arithmetic operations on x86 is the modification of flag registers. A converter explicits those side effects. Consequently, translating the exclusive-or above resulted in several Assign IR statements to represent register and flags updates. 3

Reading IR. IEMem are pretty-printed as bitsize<SegmentIR>[AddressIR]

  • x86: add eax, 2
0000 : s32:_tmp = s32:_eax
0001 : s32:_eax = (s32:_eax + i32:00000002h)
0002 : s1:_zf = (s32:_eax ? i1:0 : i1:1)
0003 : s1:_sf = s32:_eax[31:32[
0004 : s1:_pf = PARITY(s32:_eax[0:8[)
0005 : s1:_af = ((s32:_tmp ^ i32:00000002h) ^ s32:_eax)[4:5[
0006 : s1:_cf = (s32:_tmp CARRY i32:00000002h)
0007 : s1:_of = ((s32:_tmp ^ s32:_eax) & ~((s32:_tmp ^ i32:00000002h)))[31:32[

The translation of add makes use of the temporary, virtual EVar tmp. It holds the original value of %eax, before the addition was done. That value is necessary for some flag update computations (eg, the overflow flag.) Also take note of the use of special operators Parity and Carry in the converted stub.

  • x86-64: @100000h: jz $+1
s64:_rip = (s1:_zf ? i64:0000001000000003h : i64:0000001000000002h)

Note that a native address is written to the RIP-IEVar (or any EVar representing the Program Counter – PC). PC-assignments like those can later be optimized to IEJump, making use of IR Offsets instead of Native Addresses.

Also note that the Control Flow Graph (CFG) of the native instruction in the examples thus far are isomorphic to their IR-CFG translated counterparts. That is not always the case, as seen in the example below.

  • x86: repe cmpsb
0000 : if (s32:_ecx == i32:00000000h) goto 000B
0001 : s1:_zf = ((8<s16:_ds>[s32:_esi] - 8<s16:_es>[s32:_edi]) ? i1:0 : i1:1)
0002 : s1:_sf = (8<s16:_ds>[s32:_esi] - 8<s16:_es>[s32:_edi])[7:8[
0003 : s1:_pf = PARITY((8<s16:_ds>[s32:_esi] - 8<s16:_es>[s32:_edi]))
0004 : s1:_cf = (8<s16:_ds>[s32:_esi] <u 8<s16:_es>[s32:_edi])
0005 : s1:_of = ((8<s16:_ds>[s32:_esi] ^ (8<s16:_ds>[s32:_esi] - 8<s16:_es>
       [s32:_edi])) & (8<s16:_ds>[s32:_esi] ^ 8<s16:_es>[s32:_edi]))[7:8[
0006 : s1:_af = ((8<s16:_ds>[s32:_esi] ^ 8<s16:_es>[s32:_edi]) ^ (8<s16:_ds>
       [s32:_esi] - 8<s16:_es>[s32:_edi]))[4:5[
0007 : s32:_esi = (s32:_esi + (s1:_df ? i32:FFFFFFFFh : i32:00000001h))
0008 : s32:_edi = (s32:_edi + (s1:_df ? i32:FFFFFFFFh : i32:00000001h))
0009 : s32:_ecx = (s32:_ecx - i32:00000001h)
000A : if s1:_zf goto 0000

Reading IR. conditional IEJump are pretty-printed “if (cond) goto IROffset”. Unconditional IEJump are rendered as simple “goto IROffset”.

This IR-CFG is not isomorphic to the native CFG. Additional edges (per the presence of 2x IEJump) are used to represent the compare “[esi+xxx] to [edi+xxx]” loop.

Accessing IR

The JEB back-end API allows full access to several IR-CFG’s, from low-level, raw IR to partially optimized IR, to fully lifted IR just before AST generation phases.

Navigating the IR in the GUI

The UI client currently provides access to the most optimized IR of routines. Those IR-CFG’s can be examined in the apt-named fragment right next to the source fragment showing decompiled code. Here is an example of a side-by-side assemblies (x86, IR). The next screenshot shows the decompiled source.

Left-side: x86 routine / Right-side: optimized IR of the converted routine
(Click to enlarge)
Decompiled source

IR via API

The API is the preferred method when it comes to power-users wanting to manipulate the IR for specific needs, such as writing a custom optimizer, as we will see in the next blog in this series.

Reminder: JEB back-end plugins can be written in Java (preferably) or Python. JEB front-end scripts can be written in Python, and can run both in headless clients (eg, using the built-in command line client) or the UI client.

For now, let’s see how to write a Python script to:

  • Retrieve a decompiled routine
  • Get the generated Intermediate Representations
  • Print it out

The following script does retrieve the first internal routine of a Native unit, decompiles it, retrieve the default (latest) IR, and prints out its CFG. The full scripts is available on GitHub.

# retrieve `unit`, the code unit

# GlobalAnalysis is assumed to be on (default)
decomp = DecompilerHelper.getDecompiler(unit)
if not decomp:
  print('No decompiler unit found')
  return

# retrieve a handle on the method we wish to examine
method = unit.getInternalMethods().get(0)#('sub_1001929')
src = decomp.decompile(method.getName(True))
if not src:
  print('Routine was not decompiled')
  return
print(src)
    
decompTargets = src.getDecompilationTargets()
print(decompTargets)

decompTarget = decompTargets.get(0)
ircfg = decompTarget.getContext().getCfg()
# CFG object reference
# see package com.pnfsoftware.jeb.core.units.code.asm.cfg
print("+++ IR-CFG for %s +++" % method)
print(ircfg.formatSimple())

Running on Desktop Client. Run this script in the UI client via File, Scripts, Run… (hotkey: F3). Remember to open a binary file first, with a version of JEB that ships with the decompiler for that file’s architecture.

Running on the command-line. You may also decide to run it on the command-line. Example, on Windows:

$ jeb_wincon.bat -c --srv2 --script=PrintNativeRoutineIR.py -- winxp32bit/notepad.exe

Example output:

... <trimmed>
...
+++ IR-CFG for Method{sub_1001929}@1001929h +++
0000/1>  s32:_$eax = 32<s16:_$ds>[s32:_gvar_100A4A8]
0001/1:  if !(s32:_$eax) goto 0003
0002/1+  call s32:_GlobalFree(s32:_$eax)->(s32:_$eax){i32:0100193Ch}
0003/1+  s32:_$eax = 32<s16:_$ds>[s32:_gvar_100A4AC]
0004/1:  if !(s32:_$eax) goto 0006
0005/1+  call s32:_GlobalFree(s32:_$eax)->(s32:_$eax){i32:01001948h}
0006/1+  32<s16:_$ds>[s32:_gvar_100A4A8] = i32:00000000h
0007/1:  32<s16:_$ds>[s32:_gvar_100A4AC] = i32:00000000h
0008/1:  return s32:_$eax

Conclusion

That is it for part 1. In part 2, we will continue our exploration of the IR and see how we can hook into the decompilation pipeline to write our custom optimizers to clean packer-specific obfuscation, as well as make use of the data flow analysis components available with the IR-CFG. Stay tuned!

  1. Working on IR presents several advantages, two of which being: a/ the reduction of coupling between the analysis pipeline and the input native architecture; b/ and offering a side-effect free representation of a program.
  2. The design choices of JEB IR are out-of-scope for this blog. They may be the subject of a separate document.
  3. When decompiling routines, IR optimization passes will iteratively refactor and clean-up unnecessary operations. In practice, most flag assignments will end up being removed or consolidated.