Updated on March 19 2024: cover the additions of JEB 5.10 (auto-integration of dex, so files) and JEB 5.11 (unpacker report).
This post presents one of JEB components used for Android app reverse engineering: the Generic Unpacker for APK. 1
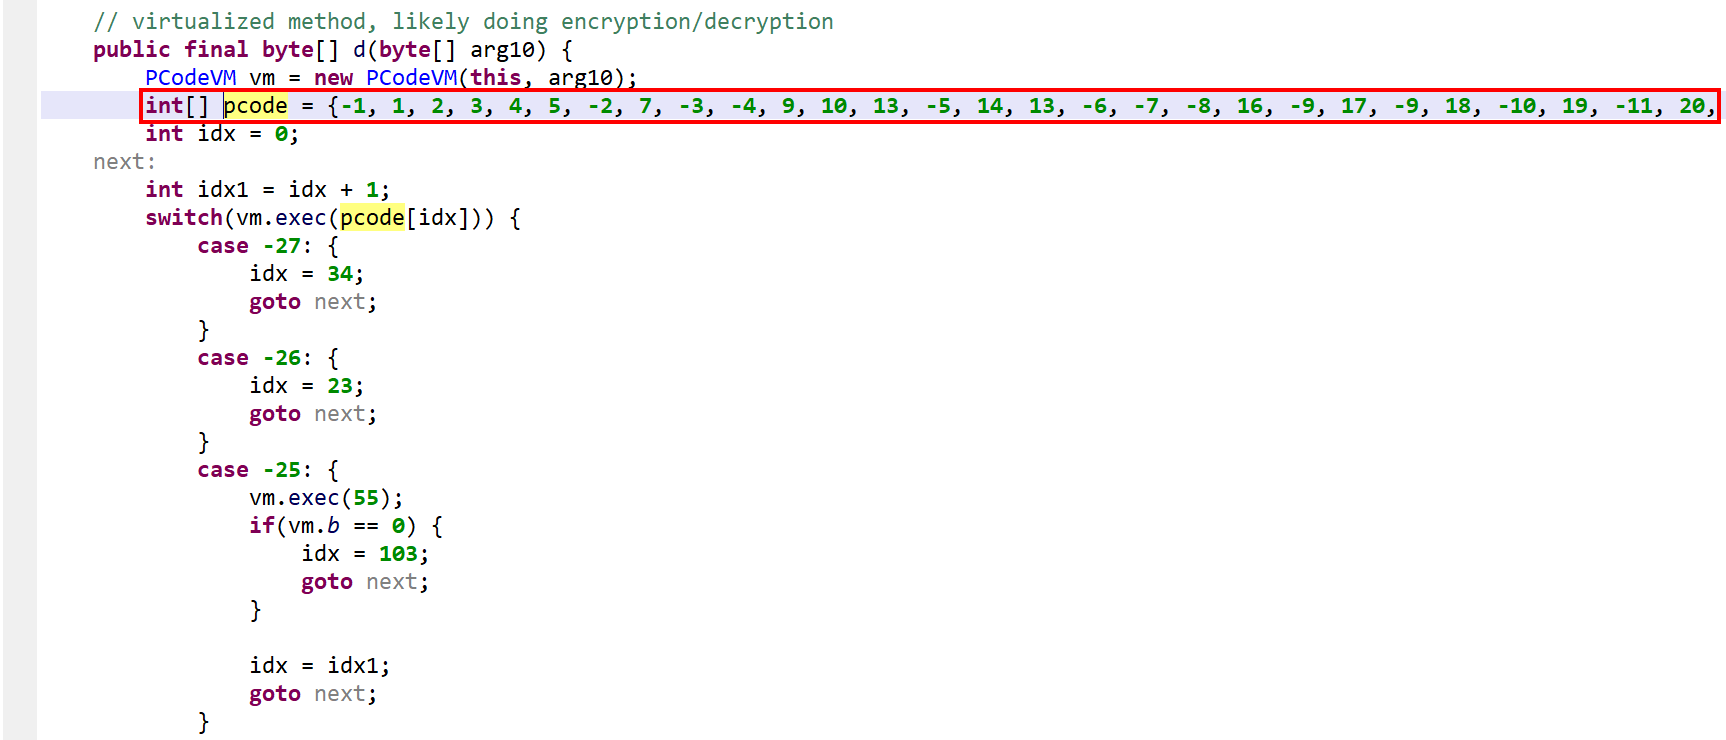
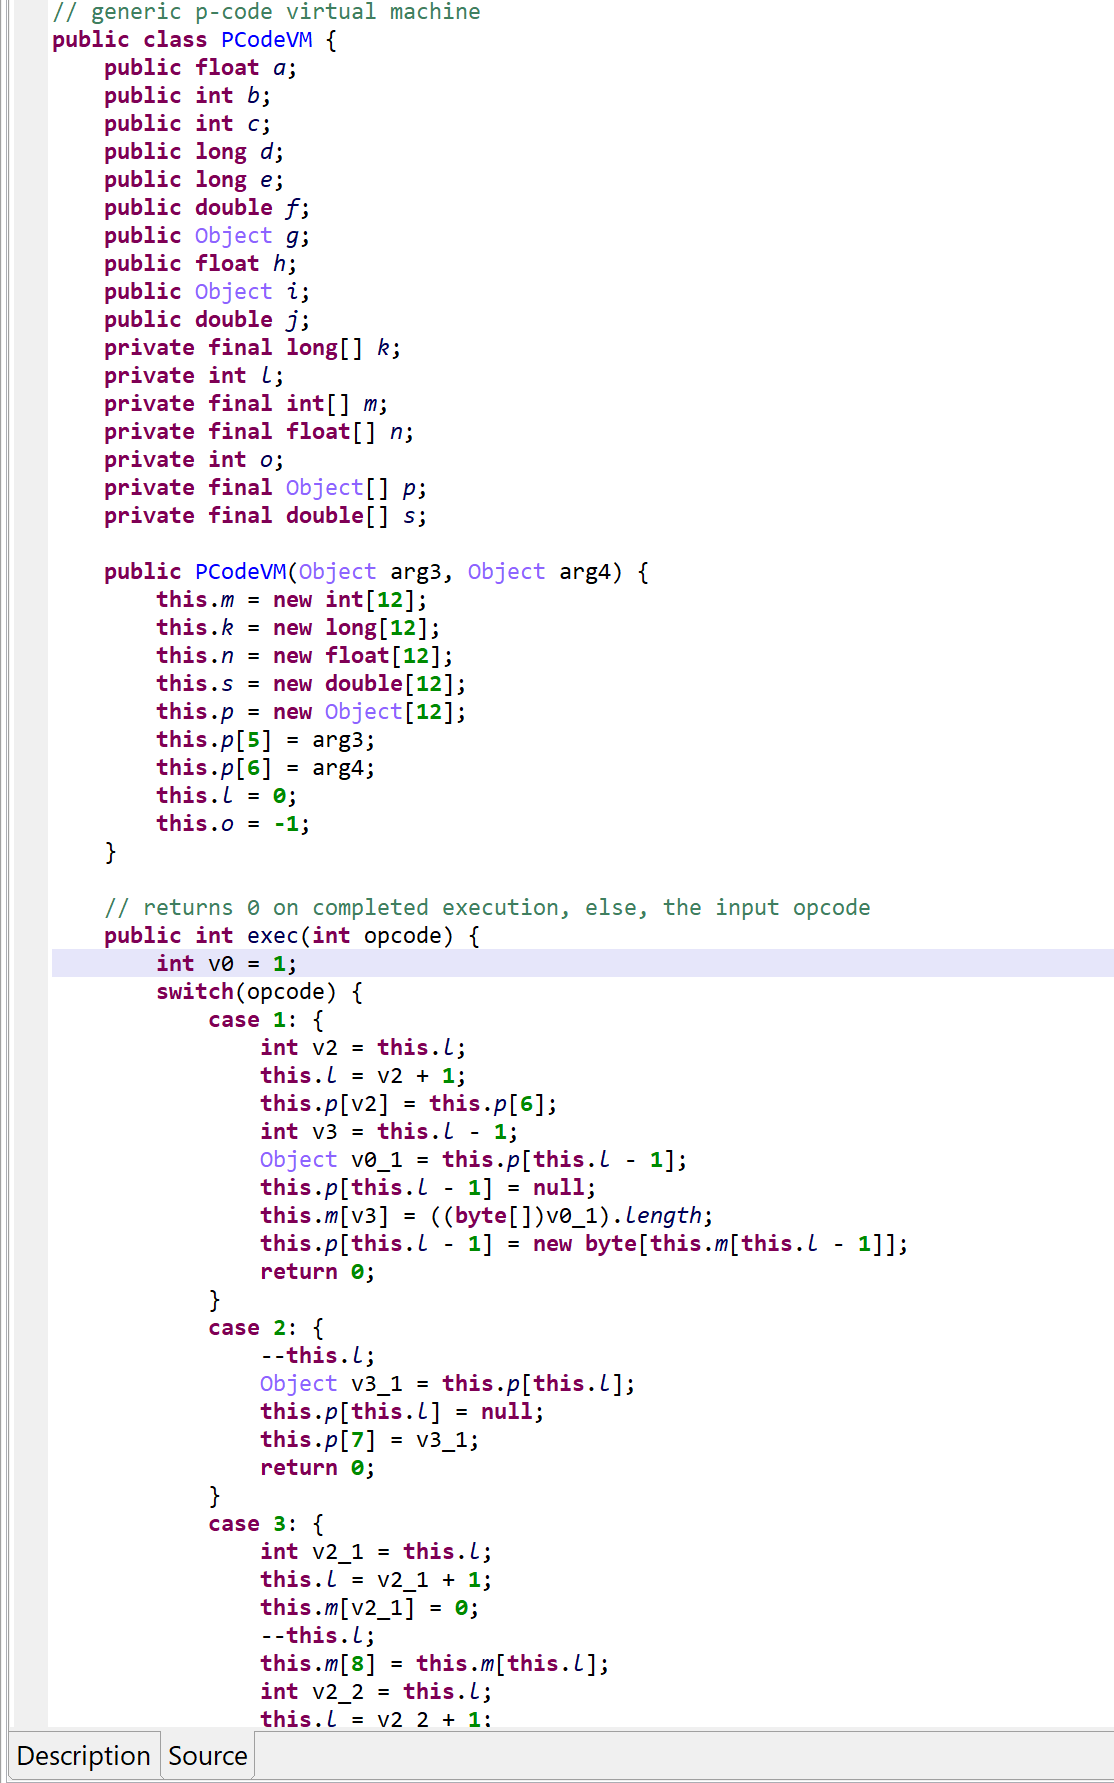
The unpacker will attempt to emulate the app’s execution in order to collect dex files and native libraries (so files, arm64 only) that would be dynamically generated at runtime. Many APK protectors, legitimate or otherwise – used for malicious purposes -, employ such techniques to make the payload Dalvik bytecode more difficult to access and analyze.
How to use the APK unpacker
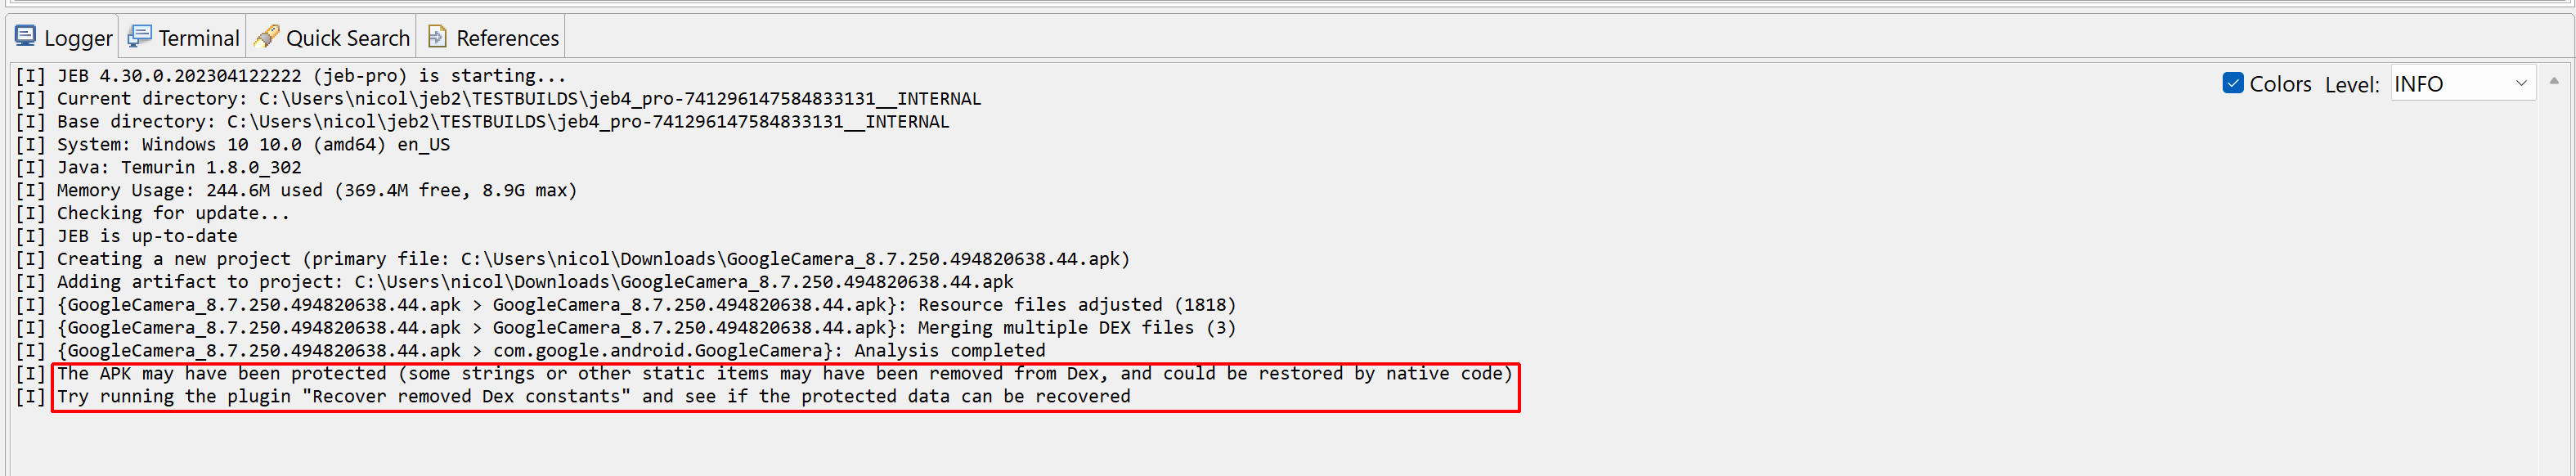
First, open the target APK in JEB. In some cases, the unpacker module will let you know that there is a high-probability that the APK was packed:
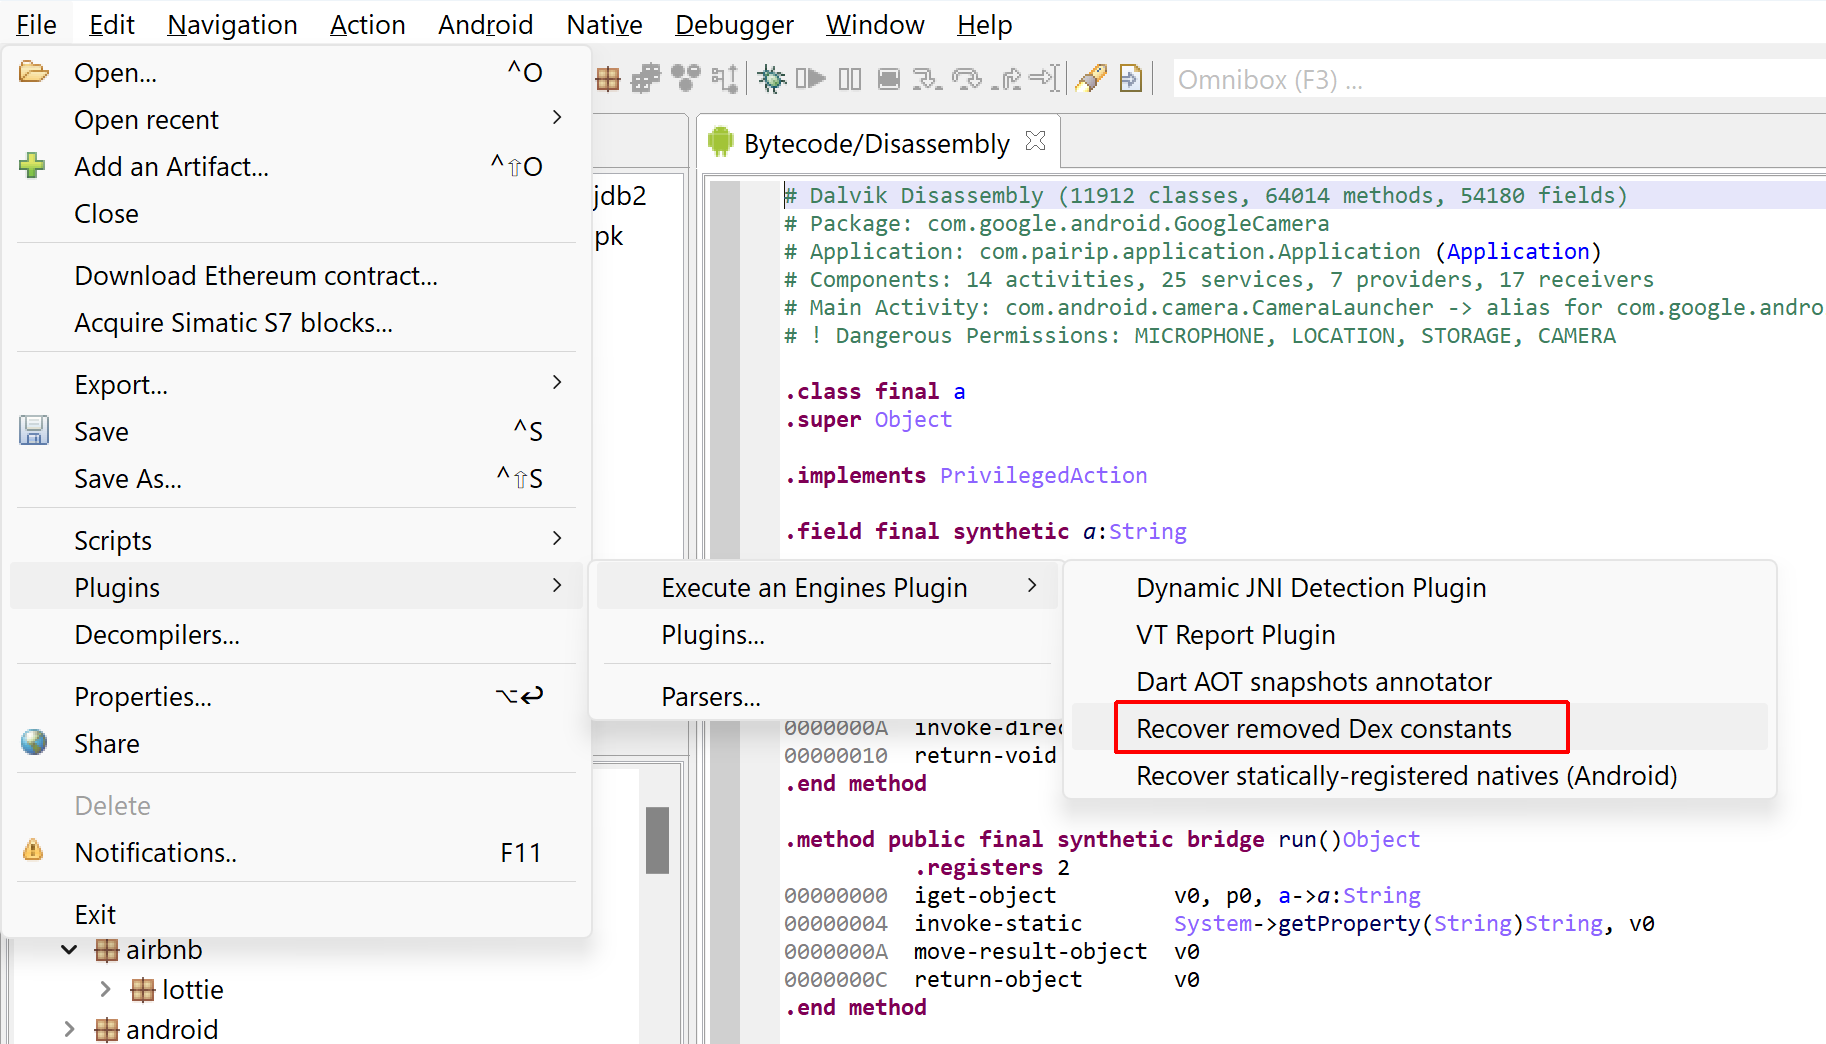
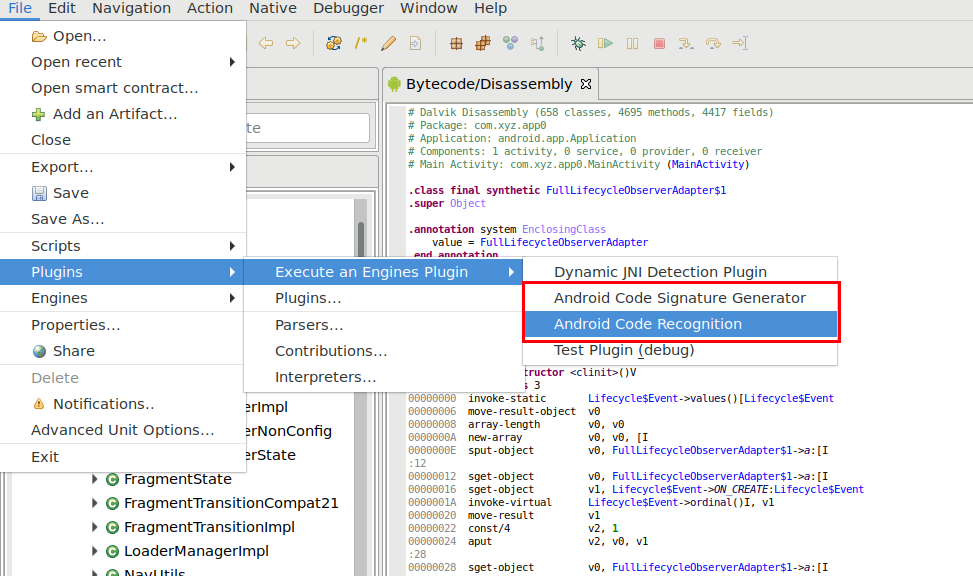
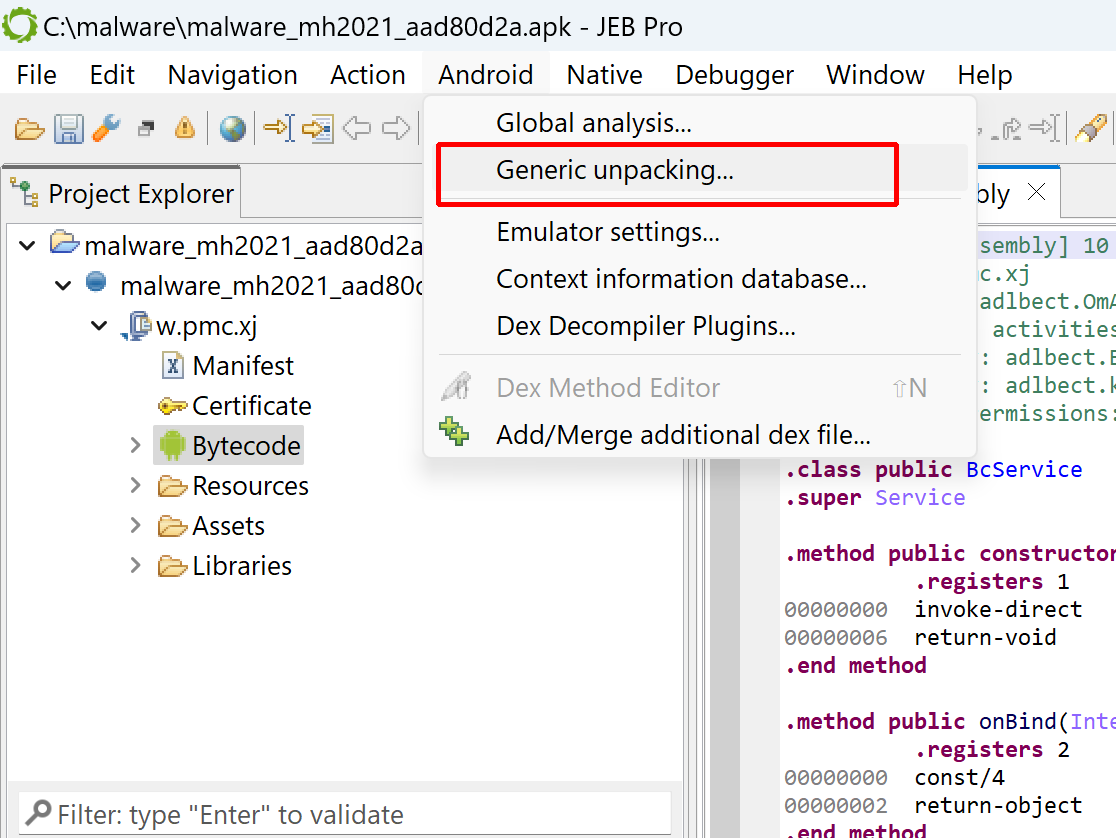
[W] The APK may have been packed. You may run the generic unpacker to see if additional dex files can be recovered.In many cases, that heuristic won’t be triggered and no specific hint issued. Either way, you may start the unpacker via the Android menu, Generic Unpacking…
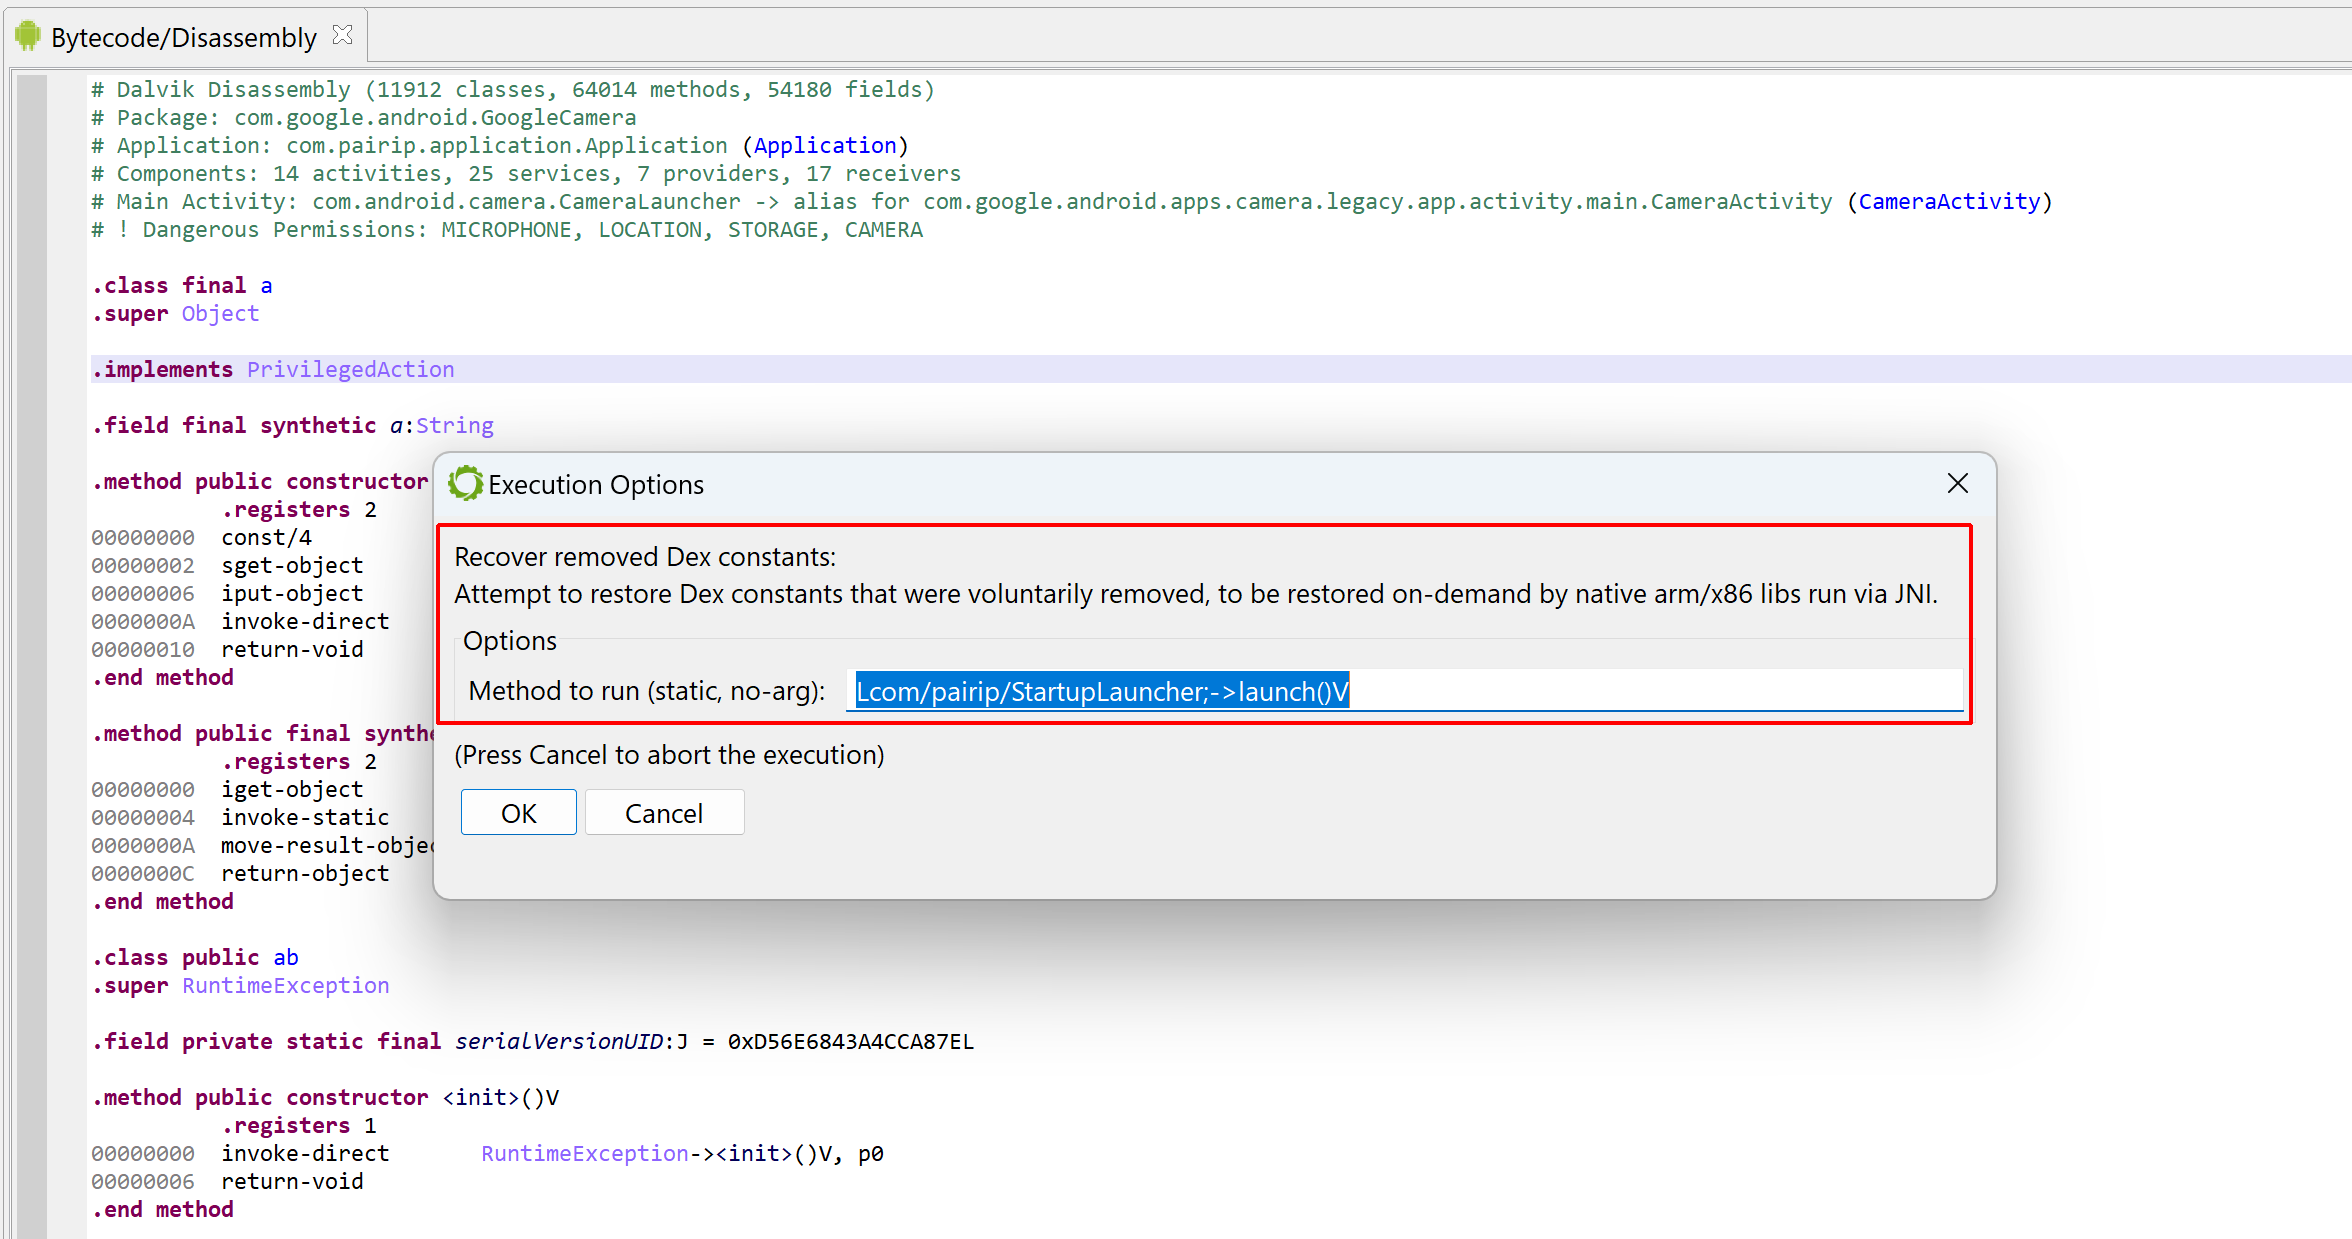
An options dialog will be displayed. The available options are:
- Maximum duration after which the unpacking process should be aborted (the default is set to 3 minutes, although in most cases, unpacking will stop well before that time-out).
- Whether or not collected dex should be used during the unpacking process itself (if so, they would be integrated in the current dex unit, to allow their emulation).
- Whether or not collected so files should be used during the unpacking process itself.
- If monitoring hooks should be set up to allow the generation of a report after the unpacking process completes (the report contains a trace of useful events, that could be used to quickly determine how the unpacking process works).
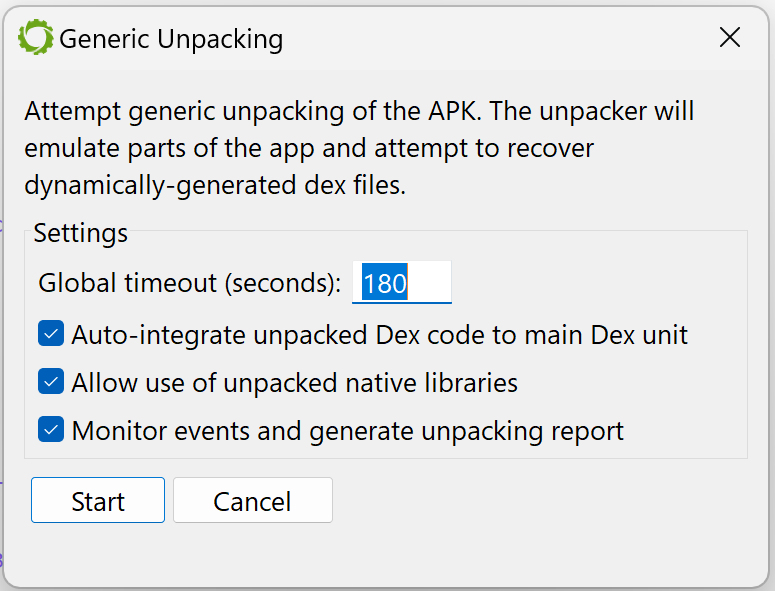
Press “Start” and let the unpacker attempt to recover hidden dex files and so libraries.
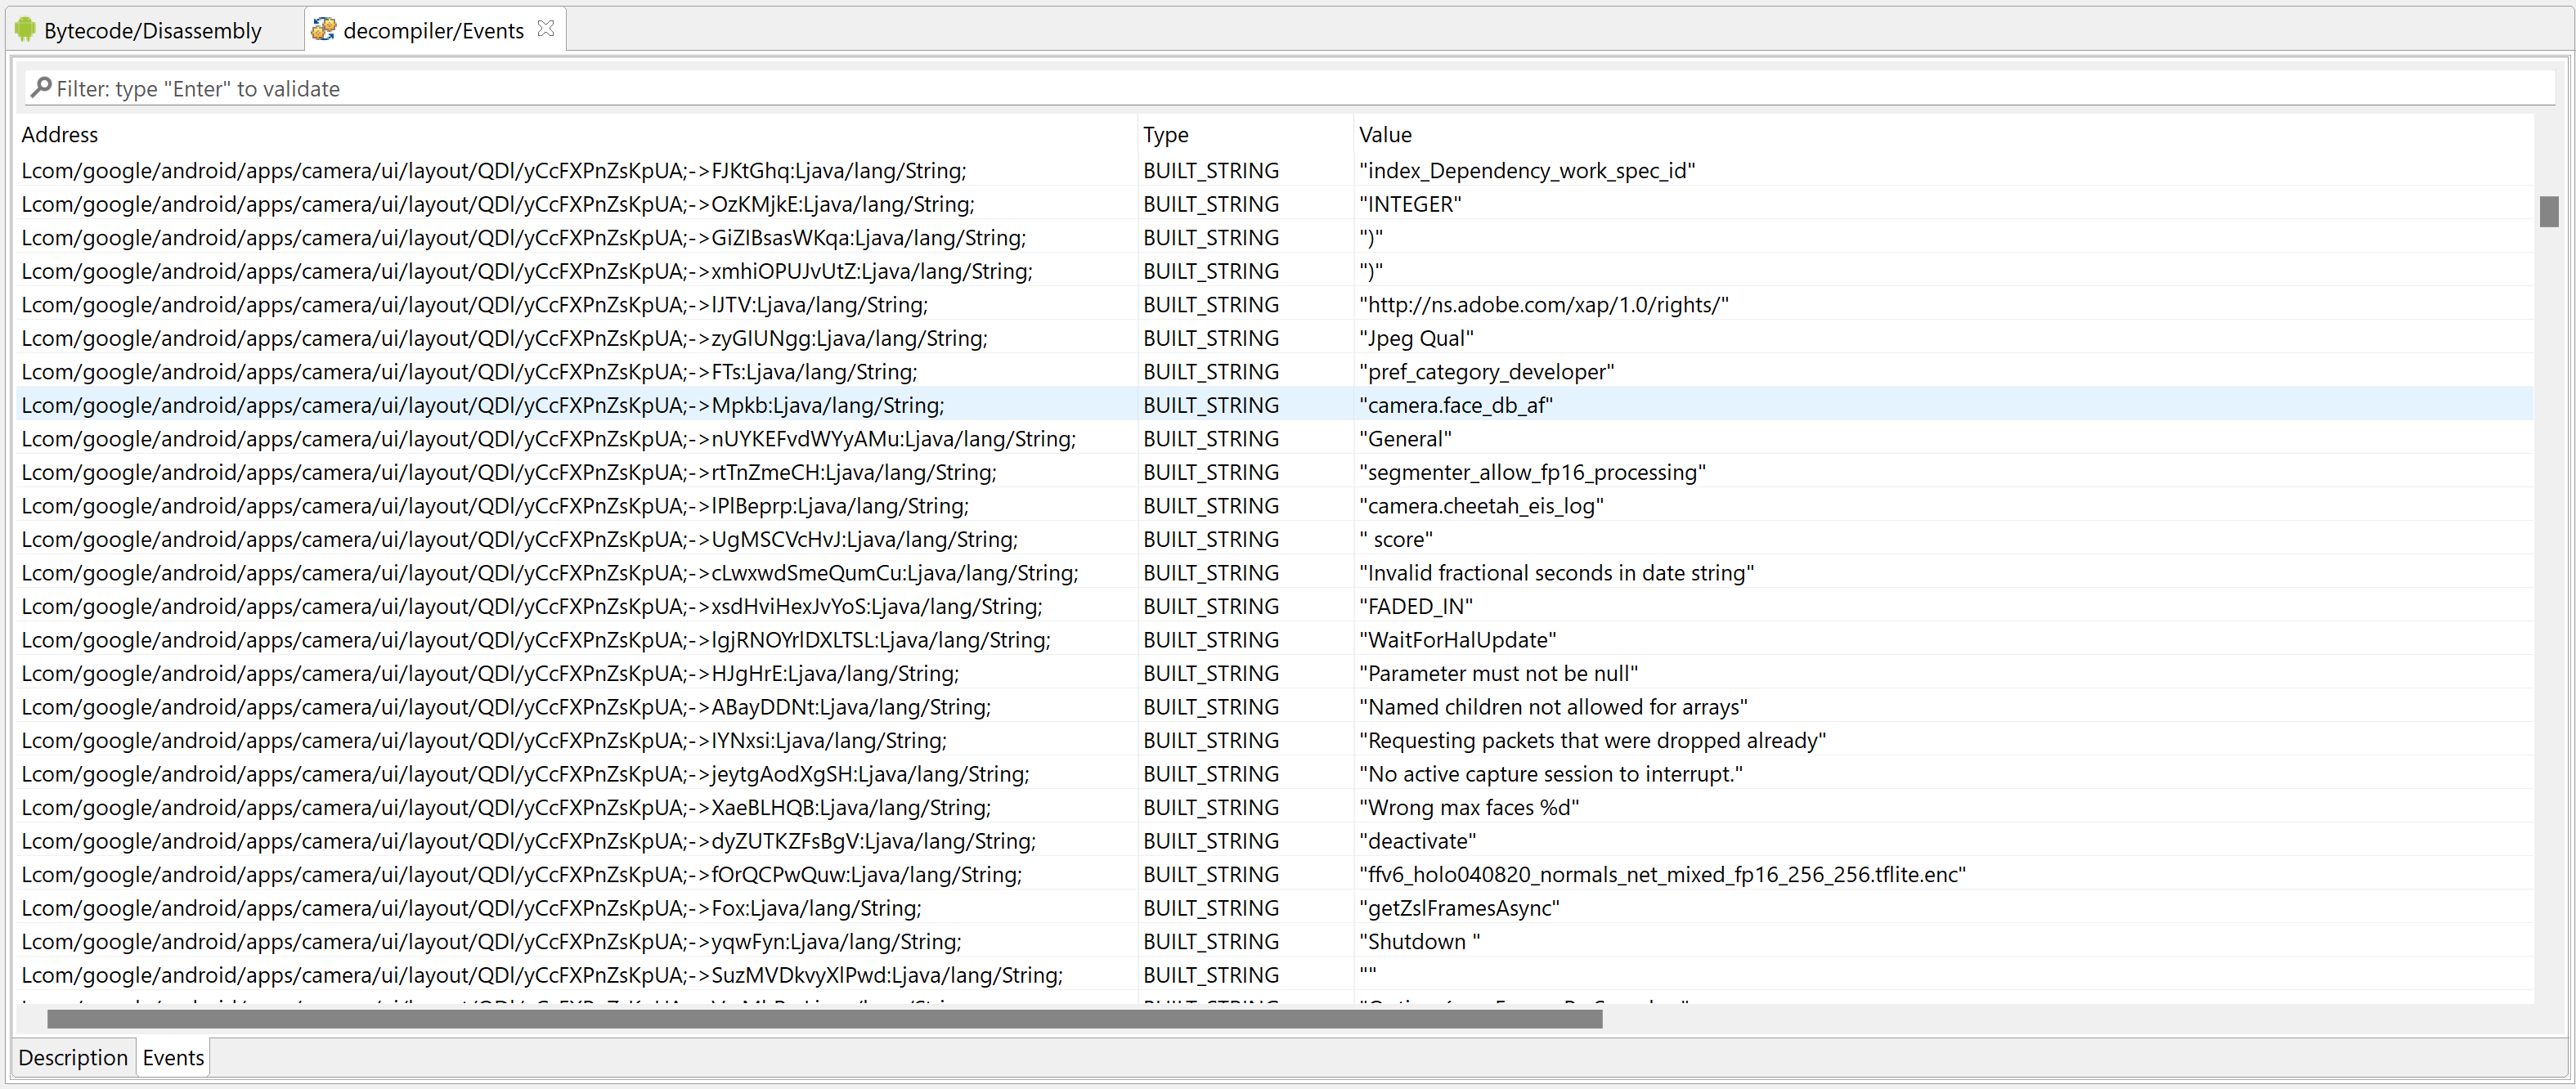
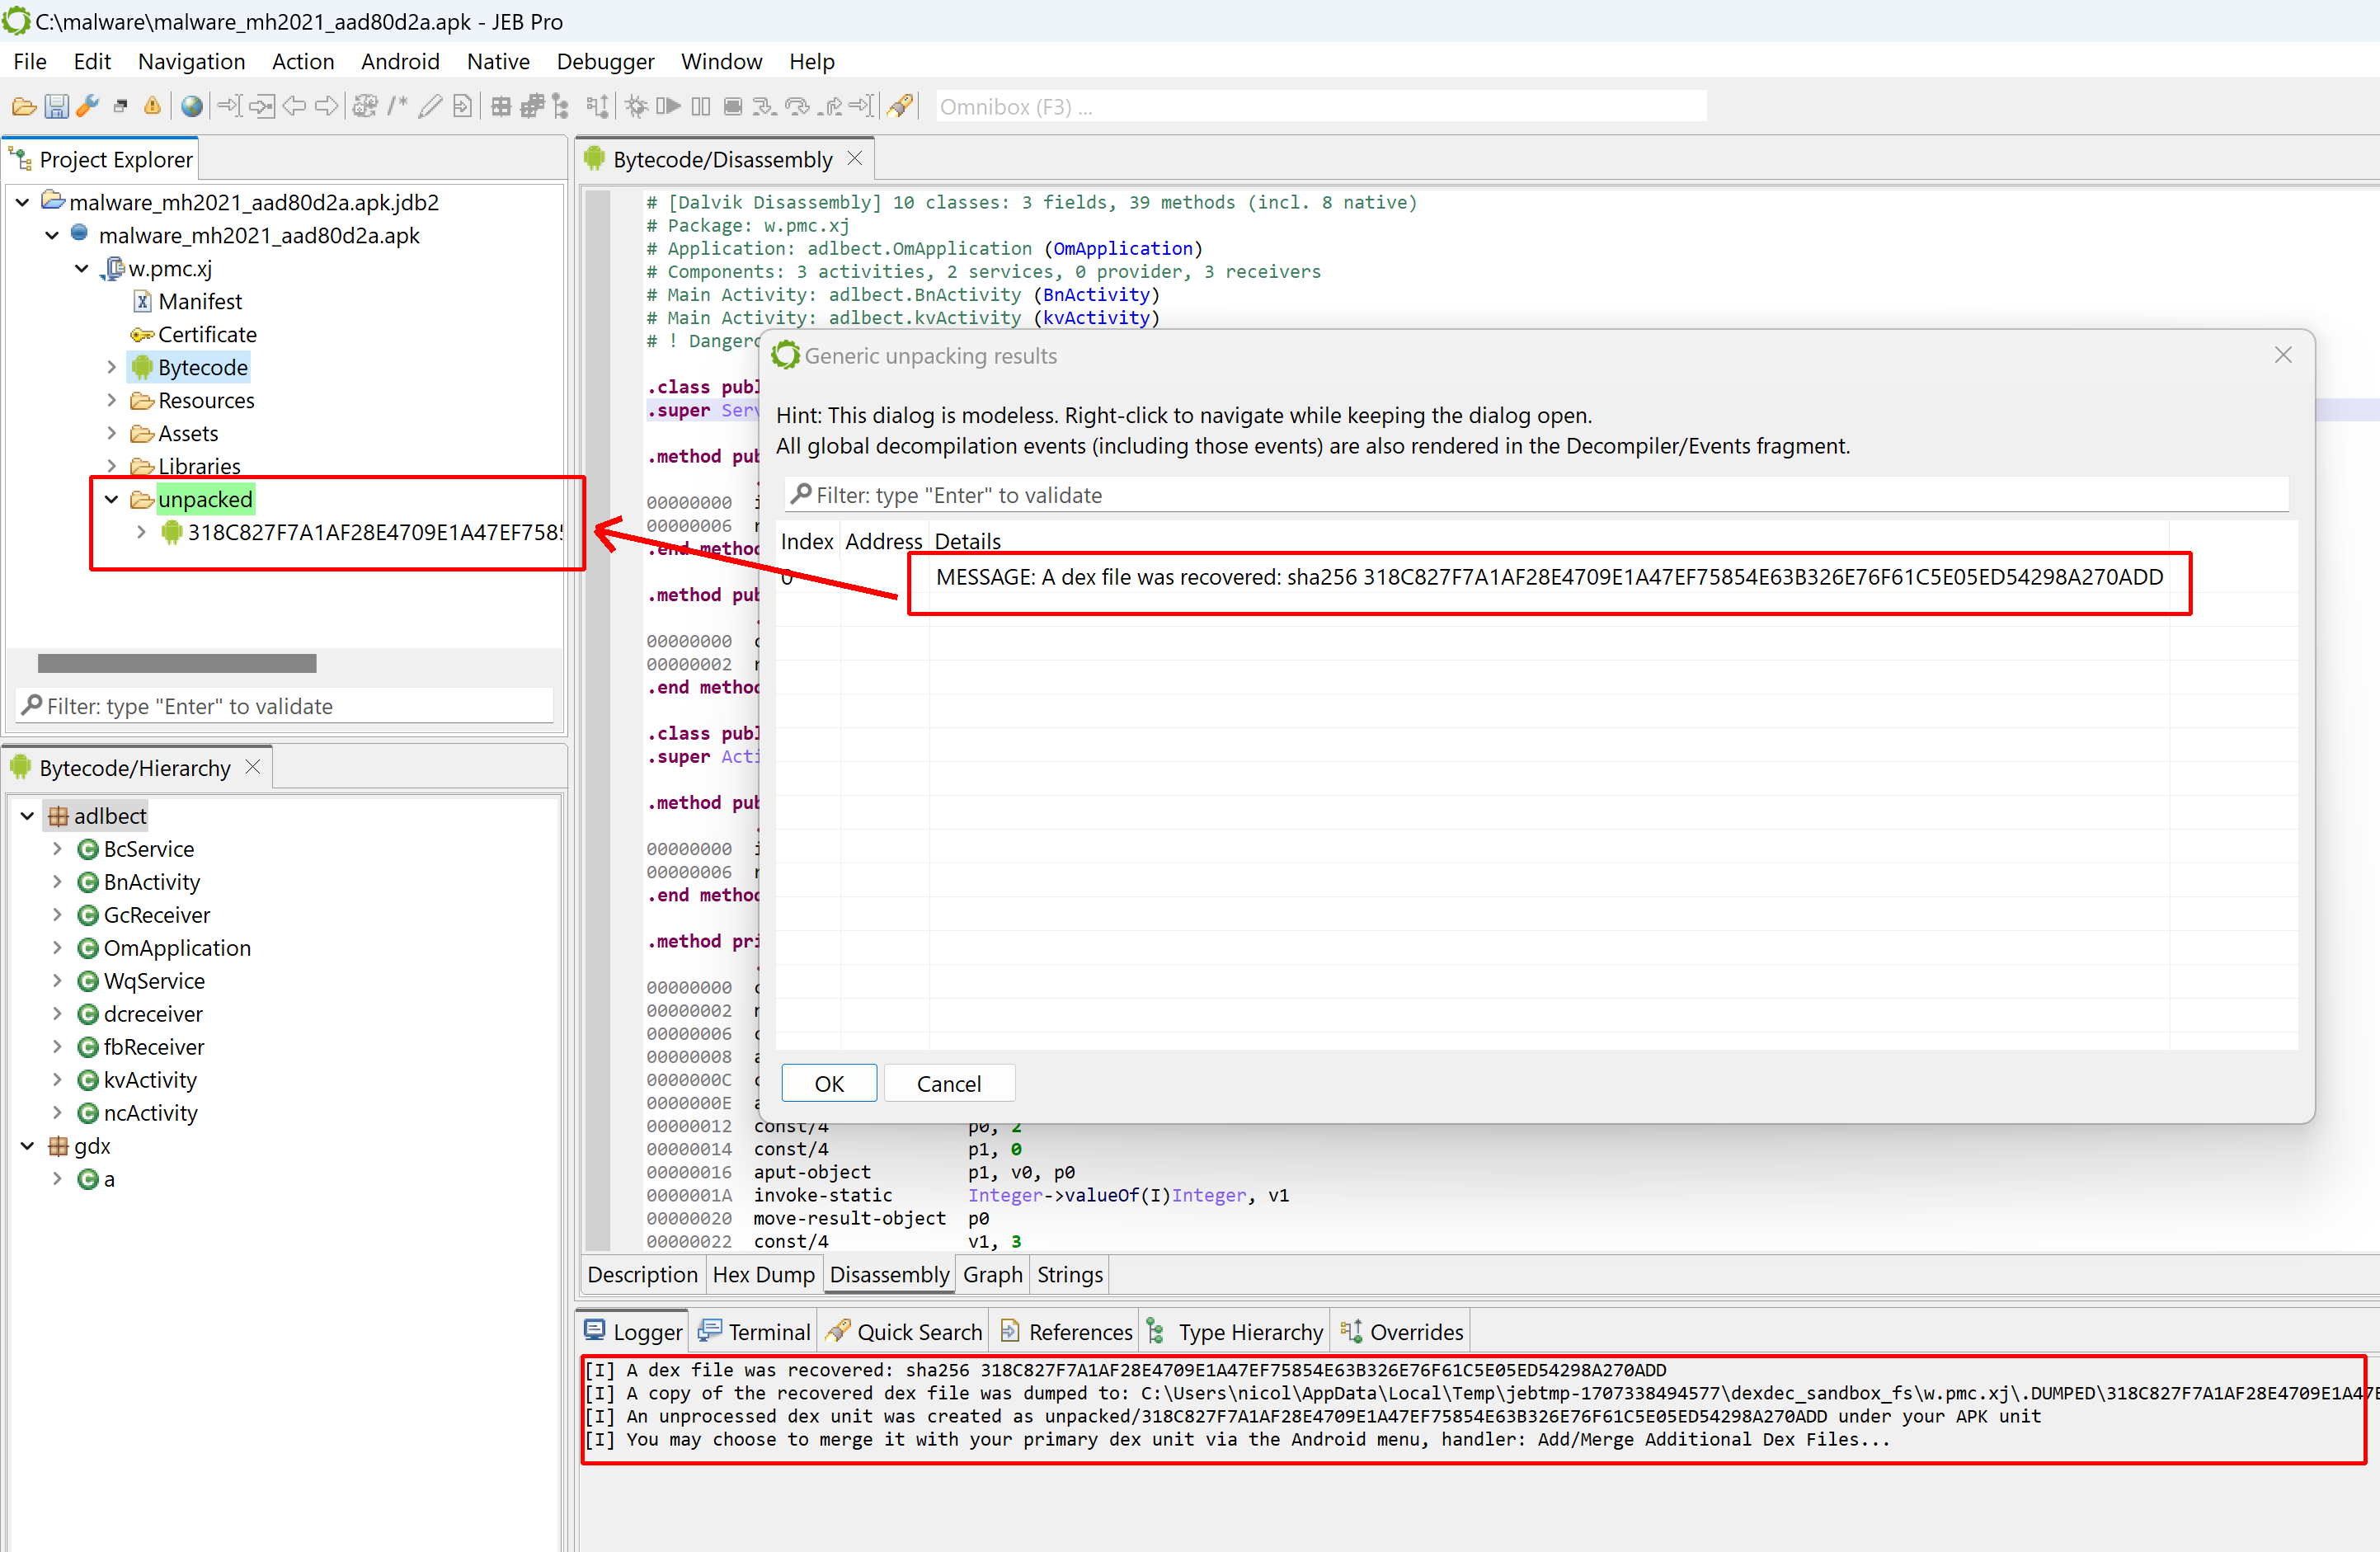
After it’s done, a frame dialog will list the unpacker results, consisting of dexdec MESSAGE notifications indicating which dex files were recovered, and where. The logger will display similar information. If the option was selected, the unpacker will also generate and display a report.
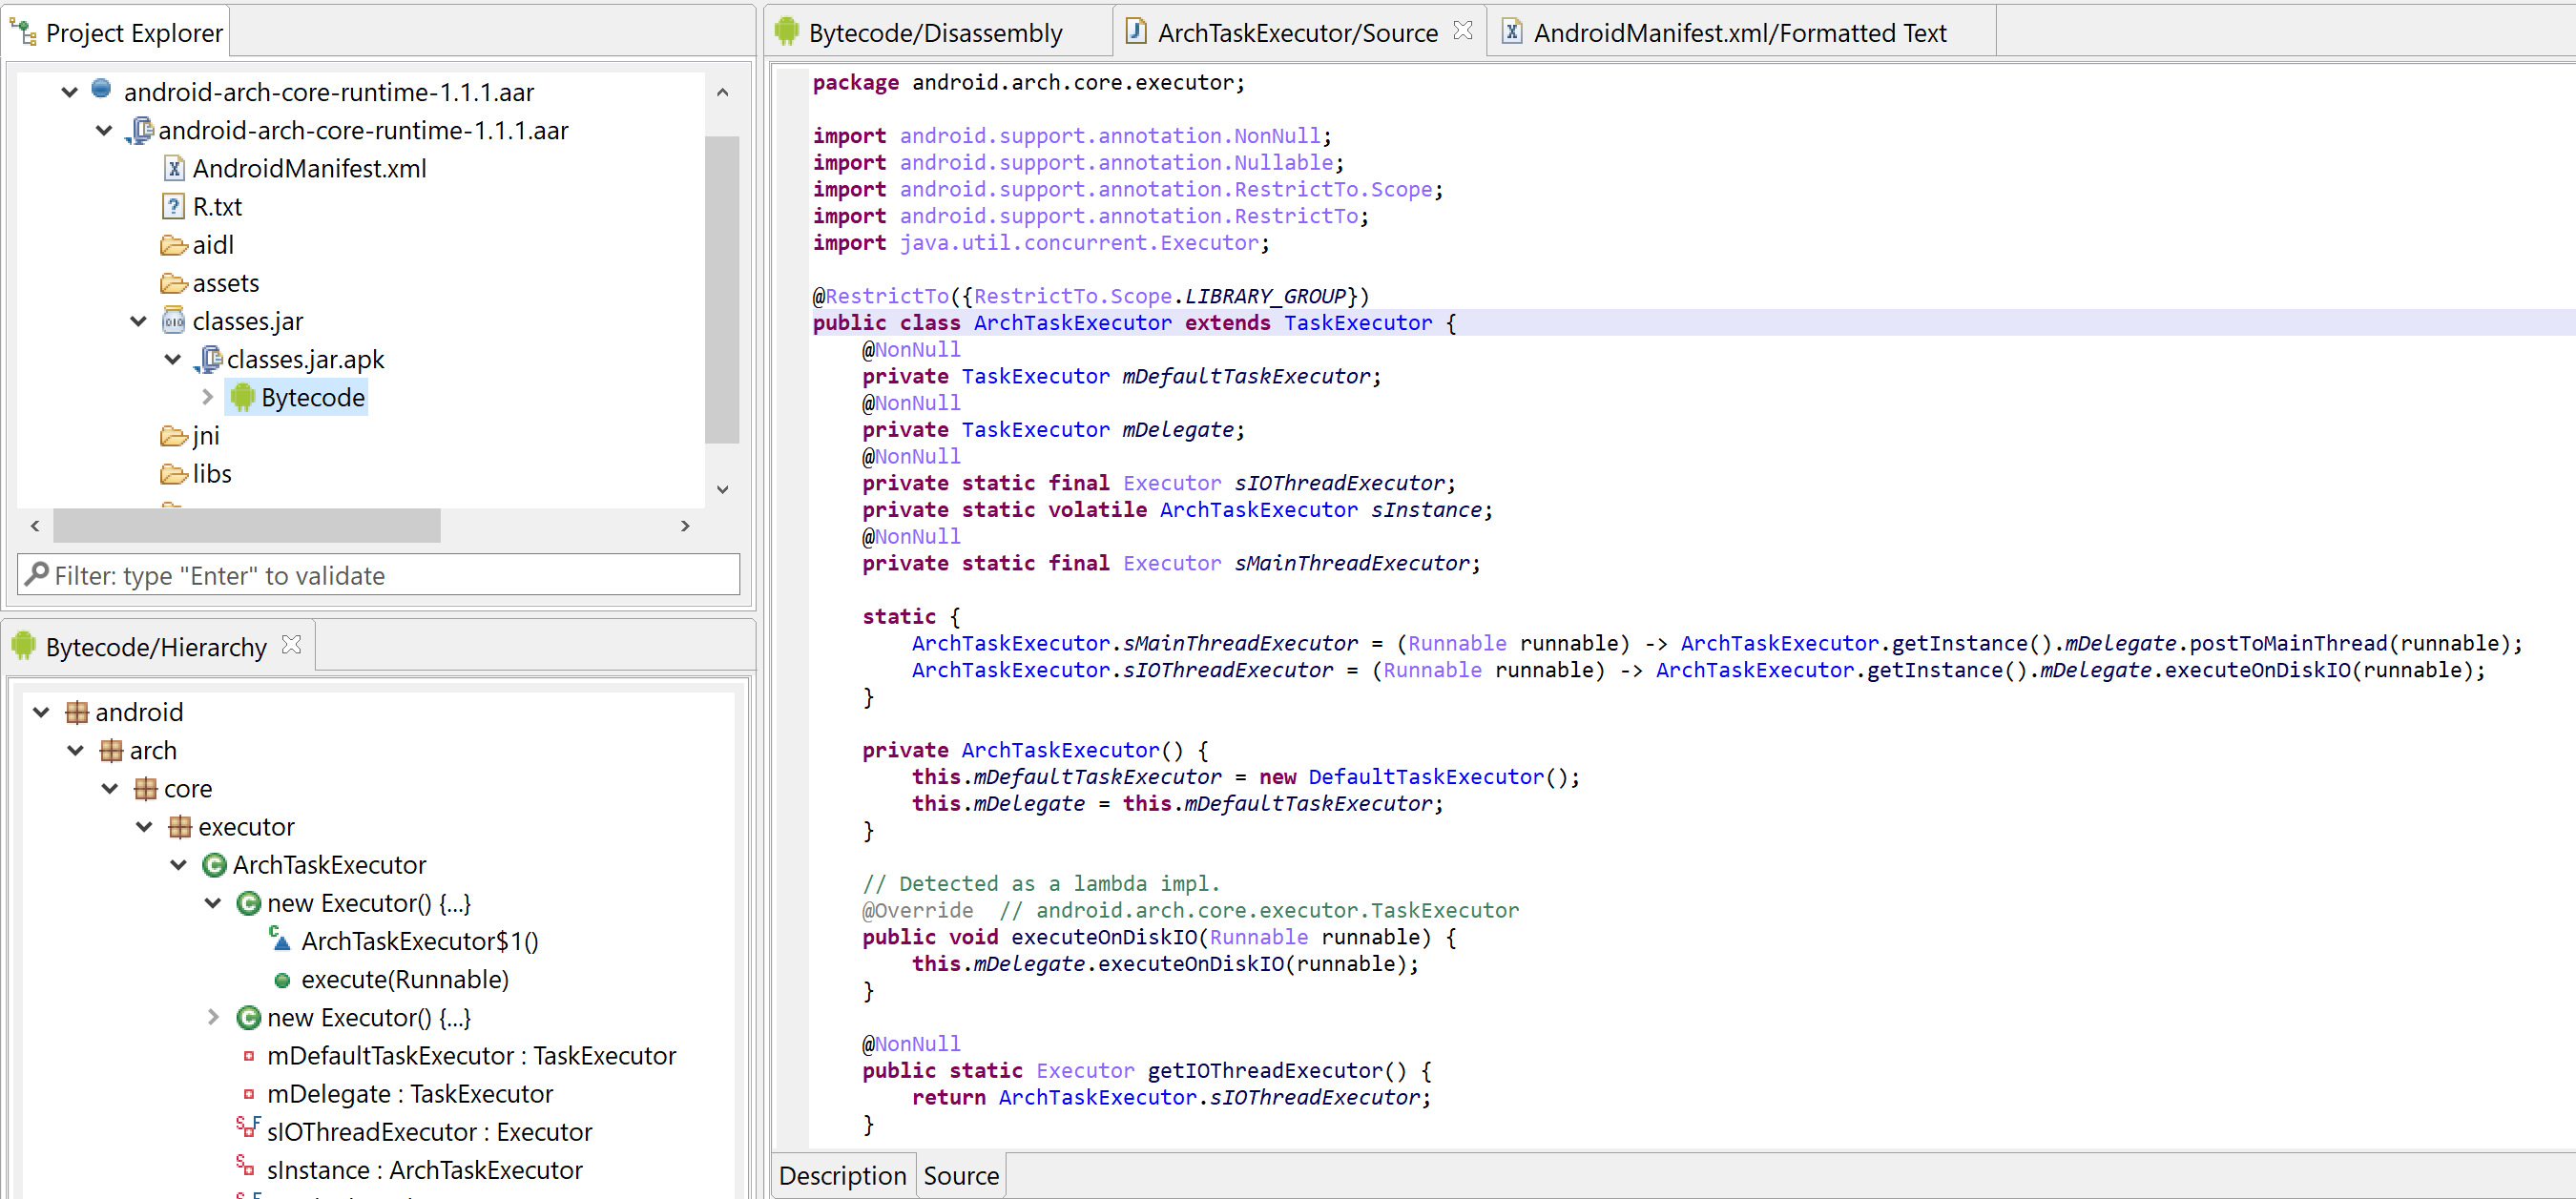
For each recovered dex and native library, a corresponding unit will be created under a sub-folder named “unpacked” (highlighted in green, located under the APK unit).
Analyzing the collected files
At this point, you may decide to analyze the recovered dex and so files(s) separately. In this case, simply open up the dex/elf unit(s) under “unpacked”, and proceed as normal (another code hierarchy, disassembly view, etc. will be opened).
Dex files integration
You may want to integrate the recovered dex with the already existing bytecode. If you ticked the options “Auto-integrate unpacked dex code to main dex unit”, the integration is automatic (and in many cases, it will allow the unpacker to proceed even further). Else, to do it manually, follow these steps:
- Right-click on the recovered dex unit, select Extract to… and save the dex to a location of your choice
- Navigate to the primary dex unit (generally named “Bytecode”), to which you want to integrate that saved dex to, and open it with a double-click
- Go to the Android menu, select Add/Merge additional Dex files… and select the file previously saved
- The collected dex will be integrated with the existing bytecode unit, and the bytecode hierarchy will reflect that update
Native libs analysis
The recovered arm64 library files may be analyzed separately. If the option “Allow use of unpacked libraries” was ticked, the recovered so files will be used by the unpacker, during unpacking. As was mentioned for dex above, in many cases, it will allow the unpacker to proceed further than normal.
Unpacking report
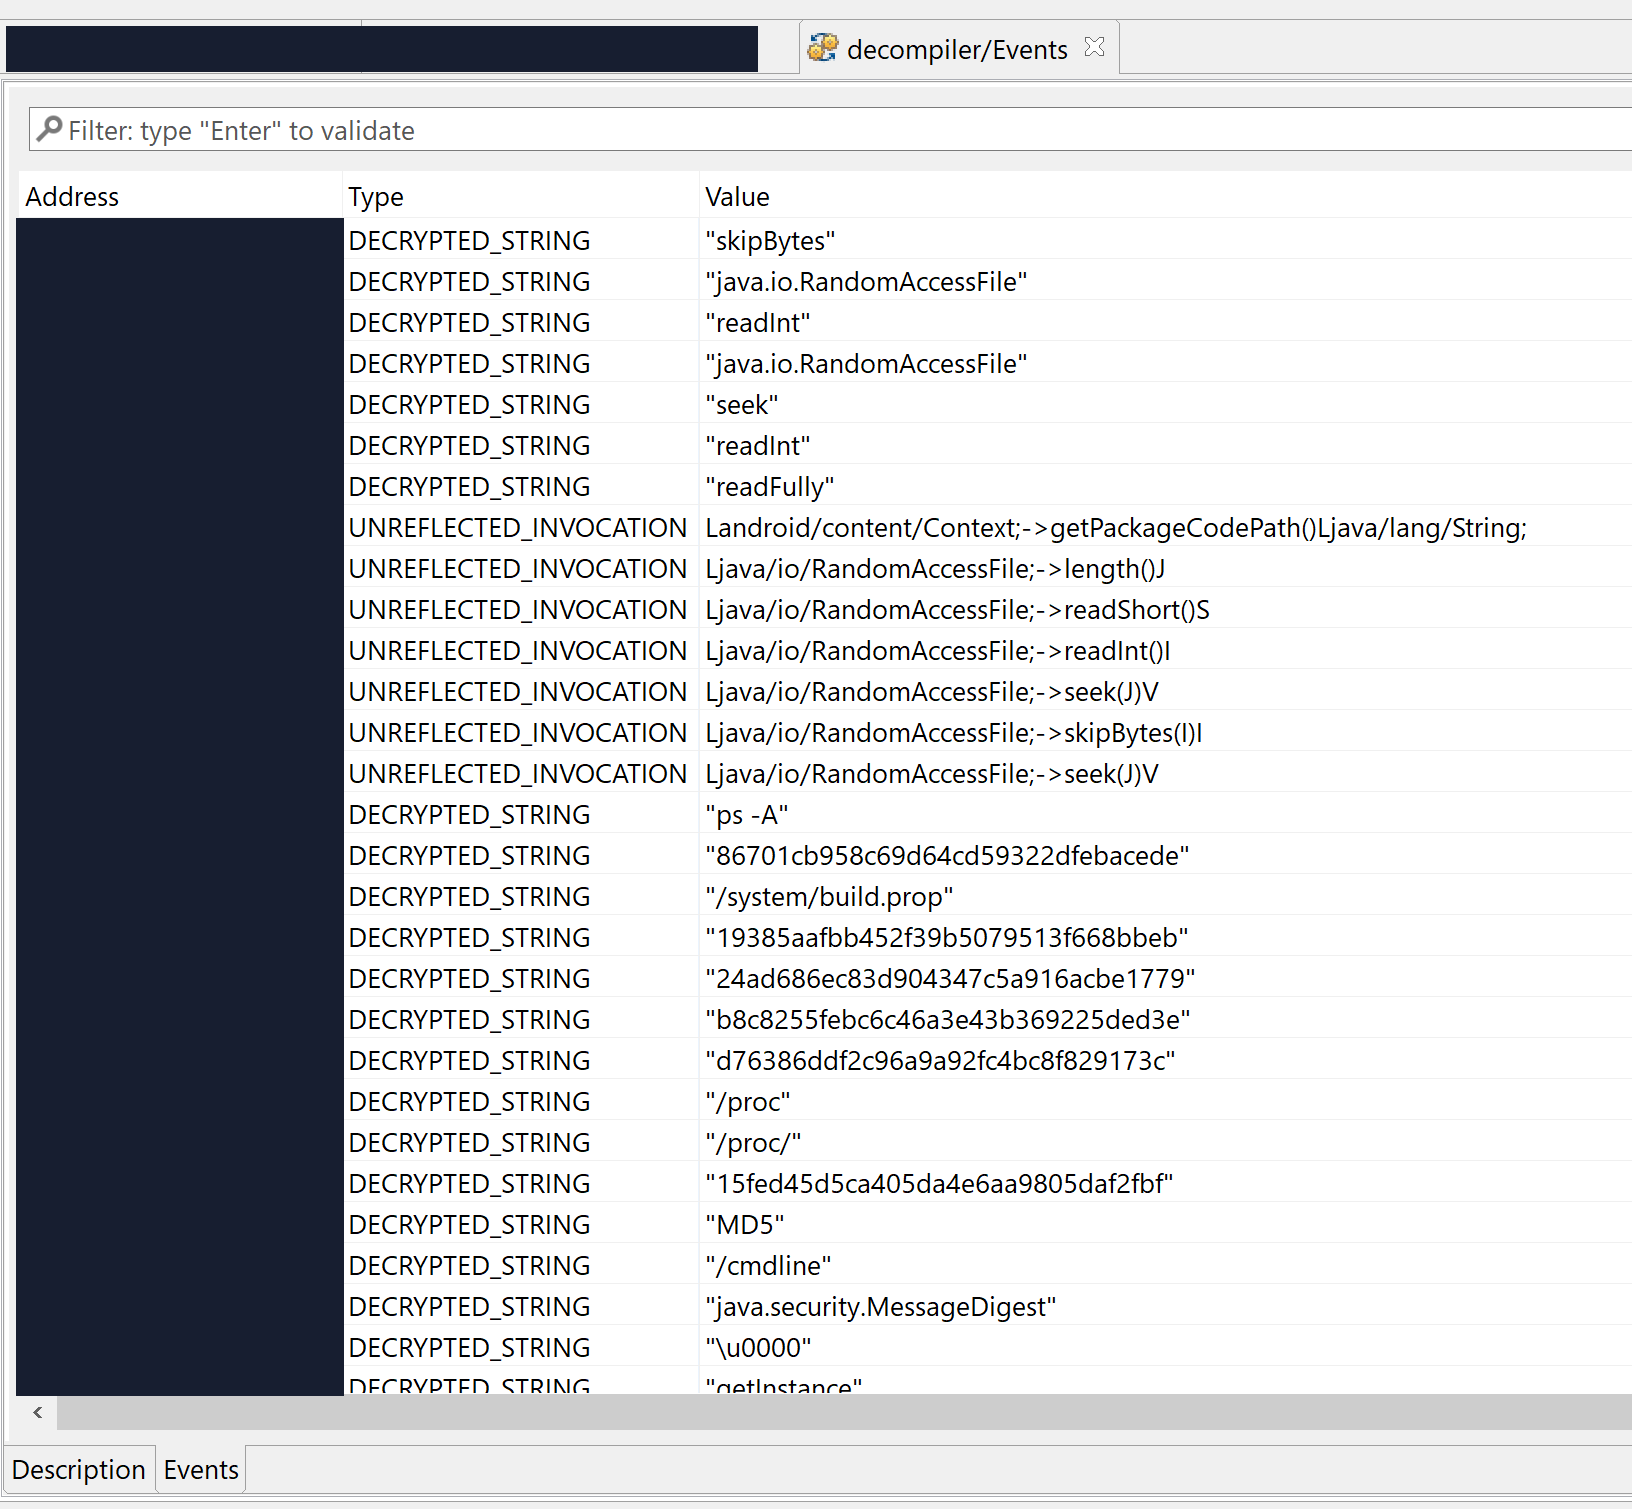
If the corresponding option was enabled before unpacking, a report will be generated after unpacking. It contains a detailed event trace of what happened, as well as a useful list of the most important unpacking events, that reverse engineers may view as a high-level “signature” of the unpacking code itself. A few examples follow.
Note that the full reports were trimmed, only their first section (“interesting records”) is displayed. The first colon indicates the emulation counter when the event occured, prefixed with either ‘j’ (java) or ‘n’ (native). The second item is the record type. Record specific strings follow, such as the method signature, string-marshalled parameters, program counter, memory addresses, register values, etc.
Report sample 1
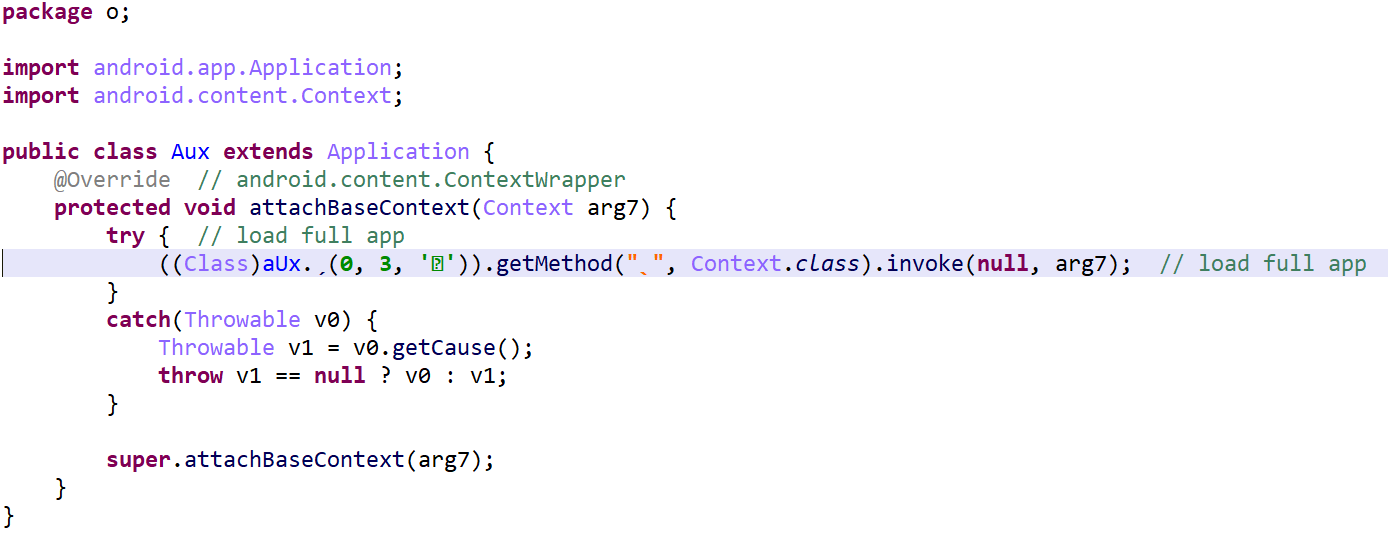
This packer does not employ native code. The malware was provided by one of our users. The records indicate that:
- the custom app’s attachBaseContext() was called
- an asset was retrieved
- from it, a custom jar was written
- that jar (containing a dex, accessible in “upacked”) was loaded into the app’s process via DexClassLoader
INTERESTING RECORDS BY ORDER OF EXECUTION (JAVA, NATIVE):
- j#191 JAVA_INVOKE: android.content.ContextWrapper.attachBaseContext ? [?]
- j#3614186 JAVA_INVOKE: android.content.res.AssetManager.openNonAssetFd ? ["tracks/radio.ogg"]
- j#15485592 JAVA_NEW: java.io.FileOutputStream ["/data/user/0/com.sekcbrgl.lodczqgwkhw/app_offline/wyhatiq.jar"]
- j#18119837 JAVA_NEW: dalvik.system.DexClassLoader [":/data/user/0/com.sekcbrgl.lodczqgwkhw/app_offline/wyhatiq.jar", "/data/user/0/com.sekcbrgl.lodczqgwkhw/app_offline", "/data/user/0/com.sekcbrgl.lodczqgwkhw/app_offline", ?]
- j#21005588 JAVA_FIELD_GET: android.app.ContextImpl.mPackageInfo ? [?]
- j#21006978 JAVA_FIELD_GET: android.app.ContextImpl.mPackageInfo ?
Report sample 2
This packer does not employ native code. The malware was provided by one of our users.
INTERESTING RECORDS BY ORDER OF EXECUTION (JAVA, NATIVE):
- j#1 JAVA_INVOKE: android.content.ContextWrapper.attachBaseContext ? [?]
- j#16 JAVA_FIELD_GET: android.content.pm.ApplicationInfo.metaData ? [?]
- j#38 JAVA_FIELD_GET: android.content.pm.ApplicationInfo.sourceDir ? ["/data/app/~~wgQXv0VF9Q1KDYlkLS3B5w==/ad.kokolzxs-TA1X_cMfmXCqI7Zt9GTCQA==/base.apk"]
- j#70 JAVA_INVOKE: java.io.File.delete /data/user/0/ad.kokolzxs/app_io.dcloud.application.DCloudApplication_exDir_1.0/app []
- j#73 JAVA_NEW: java.util.zip.ZipFile [/data/app/~~wgQXv0VF9Q1KDYlkLS3B5w==/ad.kokolzxs-TA1X_cMfmXCqI7Zt9GTCQA==/base.apk]
- j#128 JAVA_INVOKE: java.io.File.mkdirs /data/user/0/ad.kokolzxs/app_io.dcloud.application.DCloudApplication_exDir_1.0/app/META-INF []
- j#130 JAVA_NEW: java.io.FileOutputStream [/data/user/0/ad.kokolzxs/app_io.dcloud.application.DCloudApplication_exDir_1.0/app/META-INF/123.SF]
- j#446 JAVA_NEW: java.io.FileOutputStream [/data/user/0/ad.kokolzxs/app_io.dcloud.application.DCloudApplication_exDir_1.0/app/META-INF/123.RSA]
- j#496 JAVA_NEW: java.io.FileOutputStream [/data/user/0/ad.kokolzxs/app_io.dcloud.application.DCloudApplication_exDir_1.0/app/AndroidManifest.xml]
- j#595 JAVA_NEW: java.io.FileOutputStream [/data/user/0/ad.kokolzxs/app_io.dcloud.application.DCloudApplication_exDir_1.0/app/androidsupportmultidexversion.txt]
- j#646 JAVA_INVOKE: java.io.File.mkdirs /data/user/0/ad.kokolzxs/app_io.dcloud.application.DCloudApplication_exDir_1.0/app/assets []
- j#648 JAVA_NEW: java.io.FileOutputStream [/data/user/0/ad.kokolzxs/app_io.dcloud.application.DCloudApplication_exDir_1.0/app/assets/39285EFA.dex]
- j#951 JAVA_INVOKE: java.io.File.mkdirs /data/user/0/ad.kokolzxs/app_io.dcloud.application.DCloudApplication_exDir_1.0/app/assets/apps/H5BF09C00/www/css []
- j#953 JAVA_NEW: java.io.FileOutputStream [/data/user/0/ad.kokolzxs/app_io.dcloud.application.DCloudApplication_exDir_1.0/app/assets/apps/H5BF09C00/www/css/mui.css]
...
- j#145678 JAVA_NEW: java.io.FileOutputStream [/data/user/0/ad.kokolzxs/app_io.dcloud.application.DCloudApplication_exDir_1.0/app/resources.arsc]
- j#146652 JAVA_NEW: java.io.FileOutputStream [/data/user/0/ad.kokolzxs/app_io.dcloud.application.DCloudApplication_exDir_1.0/app/secret-classes.dex]
- j#173441 JAVA_INVOKE: javax.crypto.Cipher.getInstance ["AES/ECB/PKCS5Padding"]
- j#173445 JAVA_INVOKE: javax.crypto.Cipher.getInstance ["AES/ECB/PKCS5Padding"]
- j#173452 JAVA_NEW: javax.crypto.spec.SecretKeySpec [(97, 98, 99, 100, 101, 102, 103, 104, 105, 106, 107, 108, 109, 110, 111, 112), "AES"]
- j#173455 JAVA_INVOKE: javax.crypto.Cipher.init ? [1, ?]
- j#173458 JAVA_INVOKE: javax.crypto.Cipher.init ? [2, ?]
- j#173479 JAVA_NEW: java.io.FileOutputStream [/data/user/0/ad.kokolzxs/app_io.dcloud.application.DCloudApplication_exDir_1.0/app/secret-classes.dex]
- j#173504 JAVA_FIELD_GET: dalvik.system.BaseDexClassLoader.pathList ? [?]
- j#173519 JAVA_FIELD_GET: dalvik.system.DexPathList.dexElements ? [(?)]
- j#173559 JAVA_INVOKE: dalvik.system.DexPathList.makePathElements [[/data/user/0/ad.kokolzxs/app_io.dcloud.application.DCloudApplication_exDir_1.0/app/secret-classes.dex], /data/user/0/ad.kokolzxs/app_io.dcloud.application.DCloudApplication_exDir_1.0, []]
- j#173586 JAVA_FIELD_SET: dalvik.system.DexPathList.dexElements ? [(?, ?)]
Report sample 3
This packer does not employ native code. The malware was analyzed by @cryptax here.
INTERESTING RECORDS BY ORDER OF EXECUTION (JAVA, NATIVE):
- j#1 JAVA_INVOKE: android.content.ContextWrapper.attachBaseContext ? [?]
- j#3444 JAVA_FIELD_GET: android.content.pm.ApplicationInfo.sourceDir ? ["/data/app/~~wgQXv0VF9Q1KDYlkLS3B5w==/com.pmmynubv.nommztx-TA1X_cMfmXCqI7Zt9GTCQA==/base.apk"]
- j#3447 JAVA_FIELD_GET: android.content.pm.ApplicationInfo.dataDir ? ["/data/user/0/com.pmmynubv.nommztx"]
- j#3457 JAVA_FIELD_GET: android.os.Build$VERSION.SDK_INT [33]
- j#6276 JAVA_INVOKE: java.lang.System.getProperty ["java.vm.version"]
- j#6389 JAVA_INVOKE: java.io.File.mkdir /data/user/0/com.pmmynubv.nommztx/tgqaqjyg7g []
- j#6396 JAVA_INVOKE: java.io.File.mkdir /data/user/0/com.pmmynubv.nommztx/tgqaqjyg7g/hf8U6UUIwiqaGgo []
- j#9473 JAVA_NEW: java.util.zip.ZipFile [/data/app/~~wgQXv0VF9Q1KDYlkLS3B5w==/com.pmmynubv.nommztx-TA1X_cMfmXCqI7Zt9GTCQA==/base.apk]
- j#10254 JAVA_NEW: java.io.FileOutputStream [/data/user/0/com.pmmynubv.nommztx/tgqaqjyg7g/hf8U6UUIwiqaGgo/tmp-base.apk.hFGg8tq17304470999884300019.weg]
- j#10259969 JAVA_INVOKE: java.io.File.renameTo /data/user/0/com.pmmynubv.nommztx/tgqaqjyg7g/hf8U6UUIwiqaGgo/tmp-base.apk.hFGg8tq17304470999884300019.weg [/data/user/0/com.pmmynubv.nommztx/tgqaqjyg7g/hf8U6UUIwiqaGgo/base.apk.hFGg8tq1.weg]
- j#10259974 JAVA_INVOKE: java.io.File.delete /data/user/0/com.pmmynubv.nommztx/tgqaqjyg7g/hf8U6UUIwiqaGgo/tmp-base.apk.hFGg8tq17304470999884300019.weg []
- j#10262055 JAVA_FIELD_GET: dalvik.system.BaseDexClassLoader.pathList ? [?]
- j#10262352 JAVA_FIELD_GET: android.os.Build$VERSION.SDK_INT [33]
- j#10262737 JAVA_INVOKE: dalvik.system.DexPathList.makePathElements [[/data/user/0/com.pmmynubv.nommztx/tgqaqjyg7g/hf8U6UUIwiqaGgo/base.apk.hFGg8tq1.weg], /data/user/0/com.pmmynubv.nommztx/tgqaqjyg7g/hf8U6UUIwiqaGgo, []]
- j#10262752 JAVA_FIELD_GET: dalvik.system.DexPathList.dexElements ? [(?)]
- j#10262770 JAVA_FIELD_SET: dalvik.system.DexPathList.dexElements ? [(?, ?)]
- j#10262792 JAVA_INVOKE: java.io.File.delete /data/user/0/com.pmmynubv.nommztx/tgqaqjyg7g/hf8U6UUIwiqaGgo/base.apk.hFGg8tq1.weg []
- j#10262802 JAVA_INVOKE: java.io.File.delete /data/user/0/com.pmmynubv.nommztx/tgqaqjyg7g/hf8U6UUIwiqaGgo/T9etIiaI.uw87 []
- j#10262808 JAVA_INVOKE: java.io.File.delete /data/user/0/com.pmmynubv.nommztx/tgqaqjyg7g/hf8U6UUIwiqaGgo []
- j#10263604 JAVA_INVOKE: android.app.ActivityThread.currentActivityThread []
- j#10264168 JAVA_FIELD_GET: android.app.ActivityThread.mBoundApplication ? [?]
- j#10264725 JAVA_FIELD_GET: android.app.ActivityThread$AppBindData.info ? [?]
- j#10265796 JAVA_FIELD_GET: android.app.ActivityThread.mInitialApplication ? [?]
- j#10266370 JAVA_FIELD_GET: android.app.ActivityThread.mAllApplications ? [[?]]
- j#10266905 JAVA_FIELD_GET: android.app.LoadedApk.mApplicationInfo ? [?]
- j#10267542 JAVA_FIELD_GET: android.app.ActivityThread$AppBindData.appInfo ? [?]
- j#10267551 JAVA_FIELD_SET: android.content.pm.ApplicationInfo.className ? ["com.pmmynubv.nommztx.App"]
- j#10267554 JAVA_FIELD_SET: android.content.pm.ApplicationInfo.className ? ["com.pmmynubv.nommztx.App"]
- j#10268095 JAVA_INVOKE: android.app.LoadedApk.makeApplication ? [false, null]
- j#10268749 JAVA_FIELD_SET: android.app.ActivityThread.mInitialApplication ? [?]
- j#10269322 JAVA_FIELD_GET: android.app.ActivityThread.mProviderMap ? [?]
Report sample 4
This packer employs a mix of dex and native code. The malware APK was provided by one of our users.
INTERESTING RECORDS BY ORDER OF EXECUTION (JAVA, NATIVE):
- j#2 JAVA_INVOKE: android.content.ContextWrapper.attachBaseContext ? [?]
- j#25 JAVA_FIELD_GET: android.content.pm.ApplicationInfo.sourceDir ? ["/data/app/~~wgQXv0VF9Q1KDYlkLS3B5w==/com.ddbewkjewujiijejk2ijfe.security-TA1X_cMfmXCqI7Zt9GTCQA==/base.apk"]
- j#28 JAVA_NEW: java.util.zip.ZipFile ["/data/app/~~wgQXv0VF9Q1KDYlkLS3B5w==/com.ddbewkjewujiijejk2ijfe.security-TA1X_cMfmXCqI7Zt9GTCQA==/base.apk"]
- j#97 JAVA_INVOKE: java.io.File.mkdir /data/user/0/com.ddbewkjewujiijejk2ijfe.security/files/prodexdir []
- j#869 JAVA_NEW: java.io.FileOutputStream [/data/user/0/com.ddbewkjewujiijejk2ijfe.security/files/prodexdir/0OO00l111l1l]
- j#969 JAVA_NEW: java.io.FileOutputStream [/data/user/0/com.ddbewkjewujiijejk2ijfe.security/files/prodexdir/o0oooOO0ooOo.dat]
- j#1044 JAVA_NEW: java.io.FileOutputStream [/data/user/0/com.ddbewkjewujiijejk2ijfe.security/files/prodexdir/tosversion]
- j#1150 JAVA_INVOKE: java.lang.System.loadLibrary ["shell-super.2019"]
- n#94557 REGISTERED_NATIVE: PC=0x7B000D80: msig=Lcom/wrapper/proxyapplication/WrapperProxyApplication;->Ooo0ooO0oO()V @0x100005250
- n#94572 REGISTERED_NATIVE: PC=0x7B000D80: msig=Lcom/wrapper/proxyapplication/CustomerClassLoader;->ShowLogs(Ljava/lang/String;I)I @0x10000318C
- j#1151 JAVA_FIELD_GET: android.app.ContextImpl.mPackageInfo ? [?]
- j#1151 JAVA_FIELD_GET: android.app.LoadedApk.mActivityThread ? [?]
- n#96934 FILE_ACCESS: PC=0x744466AE7C: path=/data/user/0/com.ddbewkjewujiijejk2ijfe.security/files/prodexdir/o0oooOO0ooOo.dat flags=0x0
- n#97957 FILE_ACCESS: PC=0x74446BC008: path=/proc/self/maps flags=0x0
- n#125423 FILE_ACCESS: PC=0x744466AE7C: path=/data/user/0/com.ddbewkjewujiijejk2ijfe.security/files/prodexdir/0OO00l111l1l flags=0x2
- n#125432 FILE_ACCESS: PC=0x744466F6E8: path=/data/user/0/com.ddbewkjewujiijejk2ijfe.security/files/prodexdir/0OO00l111l1l flags=0x0
- n#126040 FILE_ACCESS: PC=0x744466AE7C: path=/data/user/0/com.ddbewkjewujiijejk2ijfe.security/files/prodexdir/0OO00l111l1l.lock flags=0x42
- n#129378 FILE_ACCESS: PC=0x74446BC008: path=/proc/self/maps flags=0x0
- n#152428 FILE_ACCESS: PC=0x744465FA2C: path= flags=0x0
- n#152476 FILE_ACCESS: PC=0x744466A178: path=/data/user/0/com.ddbewkjewujiijejk2ijfe.security/files/prodexdir flags=0x0
- n#152484 FILE_ACCESS: PC=0x744466A178: path=/data/user/0/com.ddbewkjewujiijejk2ijfe.security/files/prodexdir flags=0x0
- n#154816 FILE_ACCESS: PC=0x744465FA2C: path=/data/user/0/com.ddbewkjewujiijejk2ijfe.security/files/prodexdir flags=0x0
- n#156501 FILE_ACCESS: PC=0x744466AE7C: path=/data/user/0/com.ddbewkjewujiijejk2ijfe.security/files/prodexdir/tosversion flags=0x0
- n#162810 FILE_ACCESS: PC=0x744466F6E8: path=/data/user/0/com.ddbewkjewujiijejk2ijfe.security/tx_shell flags=0x0
- n#164410 FILE_ACCESS: PC=0x744466AE7C: path=/data/user/0/com.ddbewkjewujiijejk2ijfe.security/files/prodexdir/.updateIV.dat flags=0x42
- n#165717 FILE_ACCESS: PC=0x744465FA2C: path=/data/user/0/com.ddbewkjewujiijejk2ijfe.security/files/prodexdir/00O000ll111l_0.dex flags=0x0
- n#1863052 FILE_ACCESS: PC=0x744466AE7C: path=/data/user/0/com.ddbewkjewujiijejk2ijfe.security/files/prodexdir/00O000ll111l_0.dex flags=0x42
- n#1863114 FILE_ACCESS: PC=0x744466F6E8: path=/data/user/0/com.ddbewkjewujiijejk2ijfe.security/files/prodexdir/00O000ll111l_0.dex flags=0x0
- n#1865062 FILE_ACCESS: PC=0x744466F6E8: path=/data/user/0/com.ddbewkjewujiijejk2ijfe.security/files/prodexdir/odexdir/ flags=0x0
- n#1867557 FILE_ACCESS: PC=0x744465FA2C: path=/data/user/0/com.ddbewkjewujiijejk2ijfe.security/files/prodexdir/oat/ flags=0x0
- n#1867590 FILE_ACCESS: PC=0x744465FA2C: path=/data/user/0/com.ddbewkjewujiijejk2ijfe.security/files/prodexdir/oat/arm64/ flags=0x0
- n#1867629 FILE_ACCESS: PC=0x74446BC008: path=/proc/self/maps flags=0x0
- n#1886913 MEMORY_READ: PC=0x100035640: addr=0x7466E597F8 size=0x4: 58 00 00 00 ("X\u0000\u0000\u0000")
- n#1886915 MEMORY_READ: PC=0x100035648: addr=0x7466E597F8 size=0x4: 58 00 00 00 ("X\u0000\u0000\u0000")
- n#1890133 FILE_ACCESS: PC=0x744465FA2C: path=/data/user/0/com.ddbewkjewujiijejk2ijfe.security/files/prodexdir/oat/arm64/00O000ll111l_0.odex flags=0x0
- j#1184 JAVA_FIELD_GET: dalvik.system.BaseDexClassLoader.pathList ? [?]
- j#1305 JAVA_INVOKE: dalvik.system.DexPathList.makePathElements [[/data/user/0/com.ddbewkjewujiijejk2ijfe.security/files/prodexdir/00O000ll111l_0.dex], /data/user/0/com.ddbewkjewujiijejk2ijfe.security/files/prodexdir/odexdir/.oat, []]
- j#1337 JAVA_FIELD_GET: dalvik.system.DexPathList$Element.dexFile ? [?]
- j#1387 JAVA_FIELD_GET: dalvik.system.DexPathList.dexElements ? [(?)]
- j#1402 JAVA_FIELD_GET: android.os.Build$VERSION.SDK_INT [33]
- j#1411 JAVA_FIELD_SET: dalvik.system.DexPathList.dexElements ? [(?, ?)]
- n#1892649 MEMORY_READ: PC=0x100035640: addr=0x7466E597F8 size=0x4: 58 00 00 00 ("X\u0000\u0000\u0000")
- n#1892651 MEMORY_READ: PC=0x100035648: addr=0x7466E597F8 size=0x4: 58 00 00 00 ("X\u0000\u0000\u0000")
- n#4903698 FILE_ACCESS: PC=0x74446BC008: path=/proc/12624/maps flags=0x0
- n#4903744 FILE_ACCESS: PC=0x744466AE7C: path=/proc/12624/maps flags=0x0
- n#4903776 FILE_ACCESS: PC=0x74446B0634: path=/proc/12624/maps flags=0x0
- n#4904889 MEMORY_READ: PC=0x10001A540: addr=0x0 size=0x8
API
An unpacker is represented by the IGenericUnpacker interface.
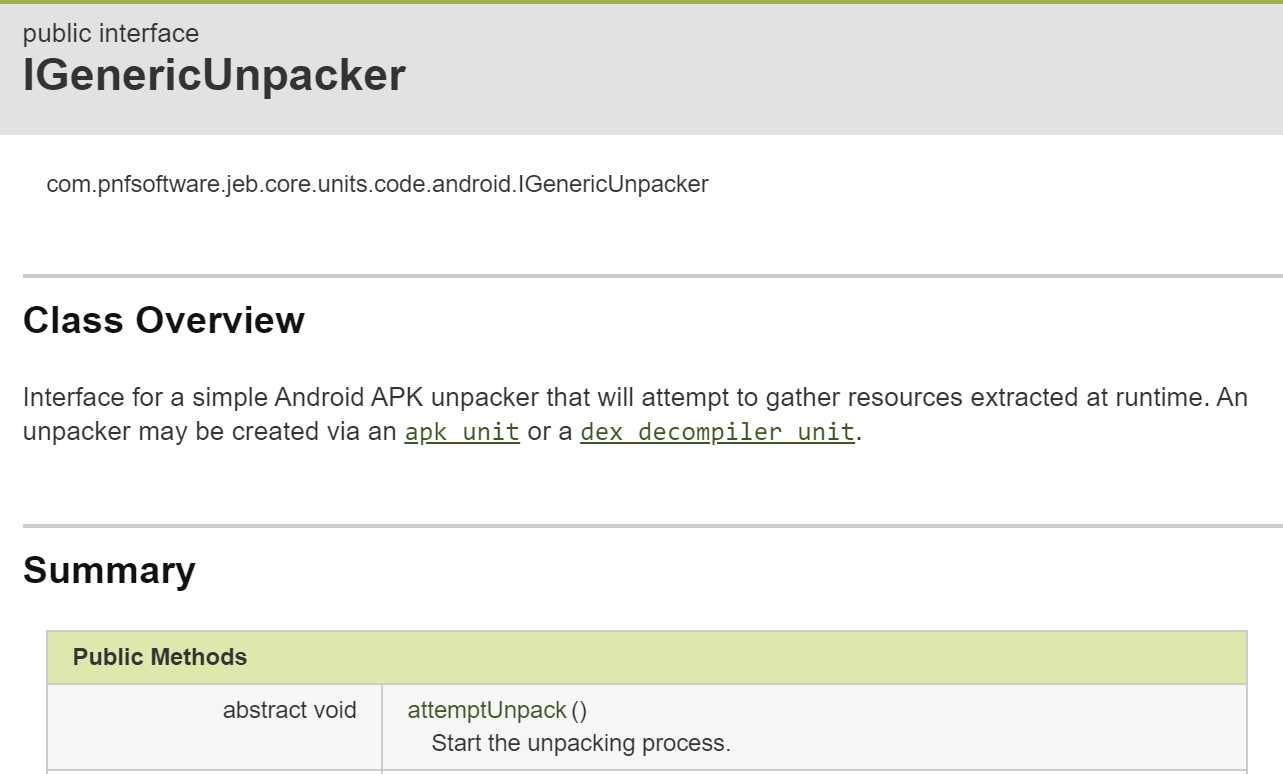
To create an APK unpacker, you may use the IApkUnit.createGenericUnpacker() method. (To retrieve an APK unit from a JEB project, use the project’s findUnit method, or any other IUnit search related method — please refer to sample scripts for example).
Limitations
The unpacker will not be able to handle all cases. Please report any problem or bug you are encountering, we will see if anything can be done to support most cases.
In an upcoming update, the IGenericUnpacker API will offer a way for users to write plugins in the form of dex-emulator and native-emulated hooks to do whatever is needed to perform an unpacking task that the built-in code would fail at.
Until next time!
Nicolas
—
- The unpacker was introduced in JEB 5.9; it received significant upgrades in versions 5.10, 5.11. ↩