This blog is a follow-up to the original debuggers tutorial published here. It focuses on the debuggers’ command interpreters, and how to use the new advanced features introduced in JEB 2.2.10 to make the most out of your live debugging sessions.
Context
When debugging with JEB, you have the standard basic visual options to set/unset breakpoints, step and 3 tabs that gives some hints on the device being debugged
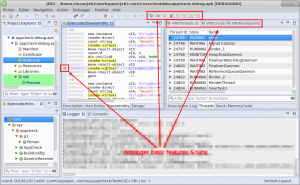
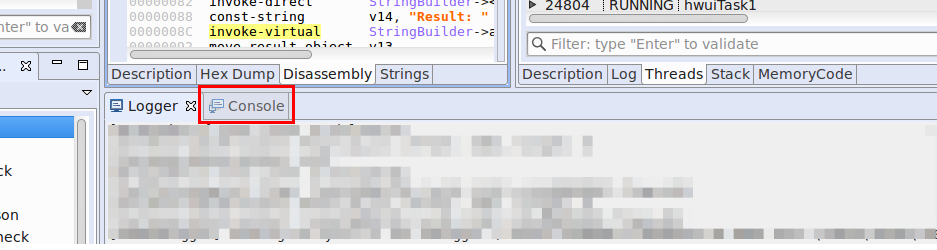
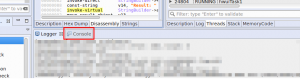
So let’s see today a feature that has been newly refreshed: the interpreter. It is available in the Console window
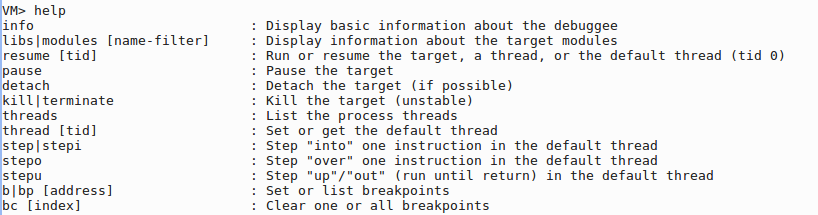
The first command to learn is help: it lists all the available commands. The Console part, as well as the Logger part, is common to all debuggers. So the first step is to select the debugger to work with.
Type list to see available debuggers
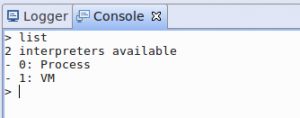
In this case, we have 2 active debuggers: VM (for java code) and Process (for native code). Let’s connect to the VM debugger (it is always available when you debug an android project). Type use 1. The prompt changes to indicate the current debugger. Use exit to go back to root level.
There are 2 types of commands in the VM interpreter: thread related commands and object interaction commands.
VM Commands
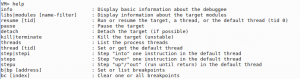
Here is a summary of the thread management commands. It consists of a set of debugger basic features that are available in the UI: resume, step, manage breakpoints.
By pressing enter without any command, you can repeat the same action, which is pretty handy for step actions.
But that’s not all, the interpreter has some more powerful commands to manage objects/classes and interact with them. Let’s take a look at these commands
To get more help on a command, type “help $command$”, there will be a full description of it.
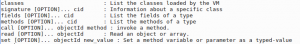
Class Commands
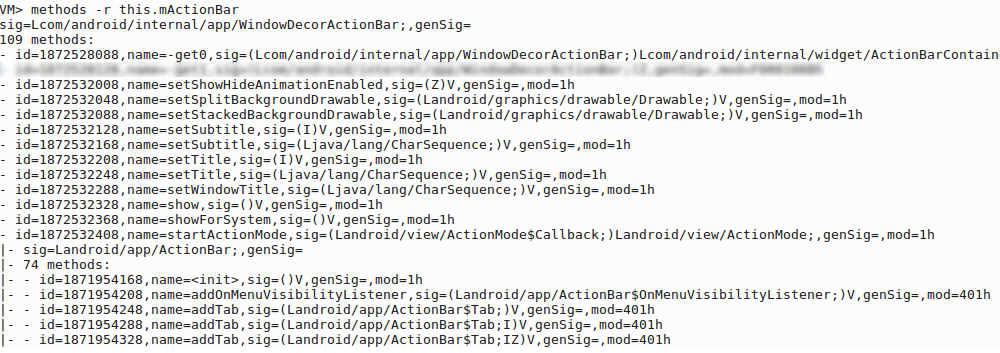
Now, here is the interesting step: you can retrieve fields/methods from a cid. A cid (stands for classId) represents a way to access the class. It can be:
- the signature of this class (Ljava/lang/String;),
- the inner class id prefixed with ‘c’ character
VM> methods Ljava/lang/String;
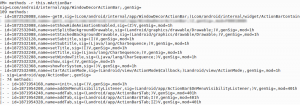
But it can also be inferred from an object:
- most common this object
- the object id prefixed with ‘@’ character
- any object that can be referenced from these ones.
VM> methods this.mActionBar
JEB interpreter supports auto completion using TAB key.
By default, the interpreter only retrieves fields and methods from the current class (not all from superclasses and interfaces). There are 2 options for this:
- -r will recursively process the parent superclasses
- -i will display interfaces of the class (it can also be combined with -r to retrieve all interfaces of the superclasses)
It is also possible to select the Thread and the frame you want to work with (is case you use the this object):
- -t threadId to select the thread. Remember that you can see all threads with command threads.
- -f frameIndex to select the frame. By default, the top frame is used.
Object Commands
The read command provides the same features as the VM/Local tree using the command line.
All commands implement the -b option that prints out a brief output in one or two lines.
The set command allow set native types, string and arrays (object creation is not supported for now)
VM> set this.vArrayInt [I{1, 2, 3}
VM> set this.mystring "new content"
Finally, the call command allow invoking any method on objects or classes. Arguments must be separated by commas.
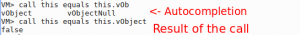
Conclusion
Visit the JEB public Google groups if you have additional questions on how to use the debuggers’ interpreters. Thank you for your support.