JEB native code analysis components make use of a custom intermediate representation (IR) to perform code analysis.
Some background: after analysis of a code object, the native assembly of a reconstructed routine is converted to an intermediate representation. 1 That IR subsequently goes through a series of transformation passes, including massages and optimizations. Final stages include the generation of high-level C-like code. Most stages in this pipeline can be customized by users via the use of plugins. A high-level, simplified view of the pipeline could be as follows:
CodeObject (*)
  -> Reconstructed Routines & Data
    -> Conversion to IR (low-level, non-optimized)
      -> IR Optimizations
        -> Final IR (higher-level, optimized, typed)
          -> Generation of AST
            -> AST Optimizations
              -> Final AST (final, cleaned)
                -> High-level output (eg, C variant)
(*) Examples of code objects: a Windows PE file with x86-code, an ELF library with with MIPS code, a headless ARM firmware, a Wasm binary file, an Ethereum smart contract, etc.
Two important JEB API components to hook into and customize the native analysis pipeline are:
– The IR classes
– The AST classes
We will start looking at IR components through the rest of this part 1.
IR Description
JEB IR can be seen as a low-level, imperative assembly language, made of expressions. Highest-level expressions are statements. Statements contain expressions. Generally, expressions can contain expressions. IR can be accessed via interfaces in the JEB API. The top-level interface for all IR expressions is IEGeneric. All IR elements start with IExxx. 2
The diagram below shows the current hierarchy of IR expression interfaces:
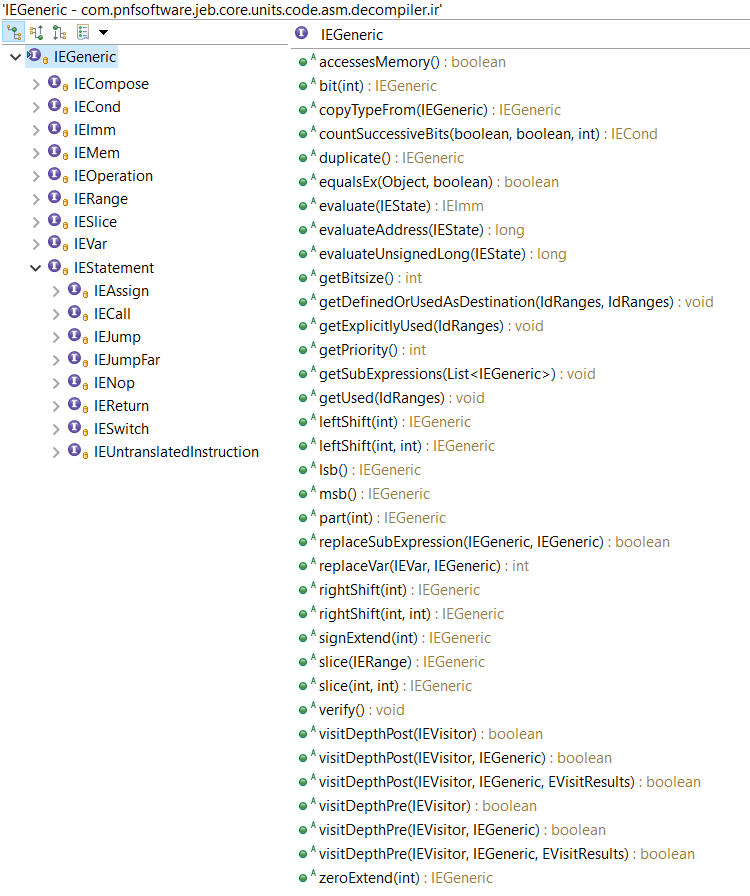
Note that IEGeneric sits at the top. All other IRE’s (short for IR Expressions from now on) derive from it. Let’s go through those interfaces:
- IEImm: Integer immediate of arbitrary length. Eg,
Imm(0x1122, 64) would represent the 64-bit integer value 0x1122. - IEVar: Generic IRE to represent variables. Variables can represent underlying physical registers, virtual registers, local function variables, global program variables, etc.
- IEMem: Piece of memory of arbitrary length. The memory address itself is an IRE; the accessed bitsize is not.
- IECond: A ternary expression “c ? a: b”, where a, b and c are IRE’s.
- IERange: A fixed integer range, commonly used with Slice
- IESlice: A chunk (contents range) of an existing IR. Eg, Slice(Imm(0x11223344, 32), 16, 24)) can be simplified to Imm(0x22, 8)
- IECompose: The concatenation of two or more IRE’s (IR0, IR1, …), resulting in an IR of size SUM(i=0->n, bitsize(IRi))
- IEOperation: A generic operation expression, with IRE operands and an operator. Eg, Operation(ADD,Imm(0x10,8),Mem(Imm(0x10000,32),8)). Most standard operators are supported, as well as less standard operators such as the Parity function or Carry function.)
- IEStatement: the super-interface for IR statements; we will detail them below.
An IR translation unit, resulting from the conversion of a native routine, consists of a sequential list of IEStatement objects. An IR statement has a size (generally, but not necessarily, 1) and an address (generally, a 0-based offset relative to its position in the translation unit).
As of JEB 3.0.8, IR statements can be:
- IEAssign: The most common of all statements: an assignment from a right-side source to a left-side destination. While the source can be virtually anything, the destination IRE is restricted to a subset of expressions.
- IENop: This statement does nothing but consumes virtual size in the translation unit.
- IEJump: An unconditional or conditional jump within the translation unit, expressed using IR offsets.
- IEJumpFar: An unconditional or conditional far jump (can be outside the translation unit), expressed using native addresses.
- IESwitch: The N-branch equivalent of IEJump.
- IECall: Represent a well-formed static or dynamic dispatch to another IR translation unit. The dispatch expression can be any IRE (eg, an Imm for a static dispatch; a Var or Mem for a dynamic dispatch).
- IEReturn: A high-level expression used to denote a return-to-caller from a translation unit representing a routine. This IRE is always introduced by later optimization passes.
- IEUntranslatedInstruction: This powerful statement can be used to express anything. It is generally used to represent native instructions that cannot be readily translated using other IR expressions. (Users may see it as an IECall on steroid, using native addresses. In that sense, it is to IECall what IEJumpFar is to IEJump.)
Now, let’s look at a few examples of conversions.
IR Examples
Let’s assume the following EVars were previously defined by an Intel x86 (or x86-64) converter: tmp (a 32-bit EVar representing a virtual placeholder register); eax (an EVar representing the physical register %eax); ?f (1-bit EVars representing standard x86 flags).
- x86: mov eax, 1
s32:_eax = s32:00000001hTranslating this mov instruction is straight-forward, and can be done with a single Assign IR statement.
- x86-64: not r9d
s64:_r9 = C(~(s64:_r9[0:32[), i32:00000000h)Translating a not-32-bit-register on an x86-64 platform is slightly more complex, as the upper 32-bit of the register are zeroed out. Here, the converter is making use of three nested IREs: (IECompose(IEOperation(NOT, Slice(r9, 0, 32))))
Reading IR. IECompose are pretty-printed as C(lo, …, hi), IESlice as Expr[m:n[
- x86-64: xor rax, qword ds:[ecx+1]
0000 : s64:_rax = (s64:_rax ^ 64<s16:_ds>[(s64:_rcx[0:32[ + i32:00000001h)])
0001 : s1:_zf = (s64:_rax ? i1:0 : i1:1)
0002 : s1:_sf = s64:_rax[63:64[
0003 : s1:_pf = PARITY(s64:_rax[0:8[)
0004 : s1:_of = i1:0
0005 : s1:_cf = i1:0
One side-effect of arithmetic operations on x86 is the modification of flag registers. A converter explicits those side effects. Consequently, translating the exclusive-or above resulted in several Assign IR statements to represent register and flags updates. 3
Reading IR. IEMem are pretty-printed as bitsize<SegmentIR>[AddressIR]
- x86: add eax, 2
0000 : s32:_tmp = s32:_eax
0001 : s32:_eax = (s32:_eax + i32:00000002h)
0002 : s1:_zf = (s32:_eax ? i1:0 : i1:1)
0003 : s1:_sf = s32:_eax[31:32[
0004 : s1:_pf = PARITY(s32:_eax[0:8[)
0005 : s1:_af = ((s32:_tmp ^ i32:00000002h) ^ s32:_eax)[4:5[
0006 : s1:_cf = (s32:_tmp CARRY i32:00000002h)
0007 : s1:_of = ((s32:_tmp ^ s32:_eax) & ~((s32:_tmp ^ i32:00000002h)))[31:32[
The translation of add makes use of the temporary, virtual EVar tmp. It holds the original value of %eax, before the addition was done. That value is necessary for some flag update computations (eg, the overflow flag.) Also take note of the use of special operators Parity and Carry in the converted stub.
- x86-64: @100000h: jz $+1
s64:_rip = (s1:_zf ? i64:0000001000000003h : i64:0000001000000002h)Note that a native address is written to the RIP-IEVar (or any EVar representing the Program Counter – PC). PC-assignments like those can later be optimized to IEJump, making use of IR Offsets instead of Native Addresses.
Also note that the Control Flow Graph (CFG) of the native instruction in the examples thus far are isomorphic to their IR-CFG translated counterparts. That is not always the case, as seen in the example below.
- x86: repe cmpsb
0000 : if (s32:_ecx == i32:00000000h) goto 000B
0001 : s1:_zf = ((8<s16:_ds>[s32:_esi] - 8<s16:_es>[s32:_edi]) ? i1:0 : i1:1)
0002 : s1:_sf = (8<s16:_ds>[s32:_esi] - 8<s16:_es>[s32:_edi])[7:8[
0003 : s1:_pf = PARITY((8<s16:_ds>[s32:_esi] - 8<s16:_es>[s32:_edi]))
0004 : s1:_cf = (8<s16:_ds>[s32:_esi] <u 8<s16:_es>[s32:_edi])
0005 : s1:_of = ((8<s16:_ds>[s32:_esi] ^ (8<s16:_ds>[s32:_esi] - 8<s16:_es>
       [s32:_edi])) & (8<s16:_ds>[s32:_esi] ^ 8<s16:_es>[s32:_edi]))[7:8[
0006 : s1:_af = ((8<s16:_ds>[s32:_esi] ^ 8<s16:_es>[s32:_edi]) ^ (8<s16:_ds>
       [s32:_esi] - 8<s16:_es>[s32:_edi]))[4:5[
0007 : s32:_esi = (s32:_esi + (s1:_df ? i32:FFFFFFFFh : i32:00000001h))
0008 : s32:_edi = (s32:_edi + (s1:_df ? i32:FFFFFFFFh : i32:00000001h))
0009 : s32:_ecx = (s32:_ecx - i32:00000001h)
000A : if s1:_zf goto 0000
Reading IR. conditional IEJump are pretty-printed “if (cond) goto IROffset”. Unconditional IEJump are rendered as simple “goto IROffset”.
This IR-CFG is not isomorphic to the native CFG. Additional edges (per the presence of 2x IEJump) are used to represent the compare “[esi+xxx] to [edi+xxx]” loop.
Accessing IR
The JEB back-end API allows full access to several IR-CFG’s, from low-level, raw IR to partially optimized IR, to fully lifted IR just before AST generation phases.
Navigating the IR in the GUI
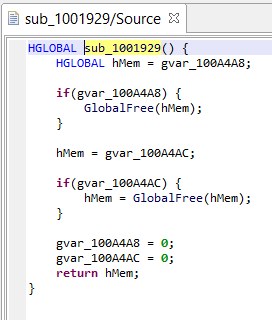
The UI client currently provides access to the most optimized IR of routines. Those IR-CFG’s can be examined in the apt-named fragment right next to the source fragment showing decompiled code. Here is an example of a side-by-side assemblies (x86, IR). The next screenshot shows the decompiled source.
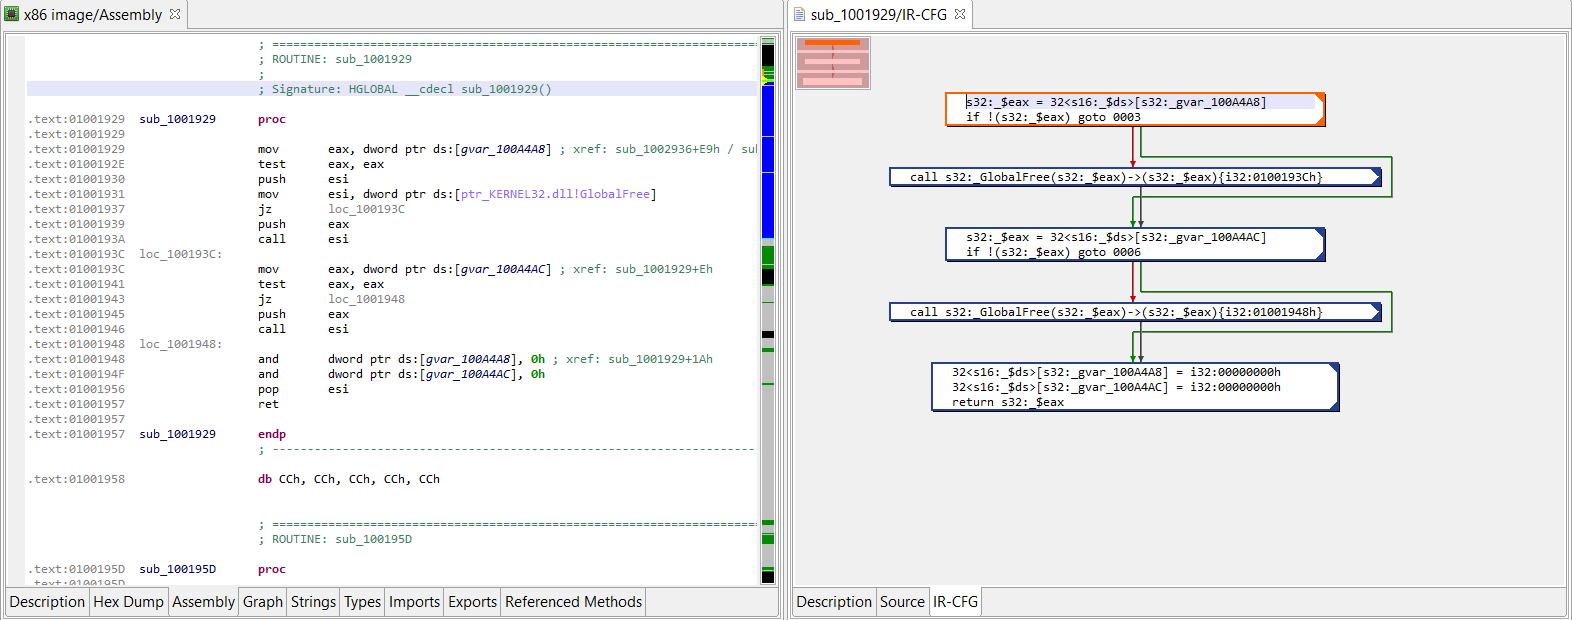
(Click to enlarge)
IR via API
The API is the preferred method when it comes to power-users wanting to manipulate the IR for specific needs, such as writing a custom optimizer, as we will see in the next blog in this series.
Reminder: JEB back-end plugins can be written in Java (preferably) or Python. JEB front-end scripts can be written in Python, and can run both in headless clients (eg, using the built-in command line client) or the UI client.
For now, let’s see how to write a Python script to:
- Retrieve a decompiled routine
- Get the generated Intermediate Representations
- Print it out
The following script does retrieve the first internal routine of a Native unit, decompiles it, retrieve the default (latest) IR, and prints out its CFG. The full scripts is available on GitHub.
# retrieve `unit`, the code unit

# GlobalAnalysis is assumed to be on (default)
decomp = DecompilerHelper.getDecompiler(unit)
if not decomp:
  print('No decompiler unit found')
  return

# retrieve a handle on the method we wish to examine
method = unit.getInternalMethods().get(0)#('sub_1001929')
src = decomp.decompile(method.getName(True))
if not src:
  print('Routine was not decompiled')
  return
print(src)

decompTargets = src.getDecompilationTargets()
print(decompTargets)

decompTarget = decompTargets.get(0)
ircfg = decompTarget.getContext().getCfg()
# CFG object reference
# see package com.pnfsoftware.jeb.core.units.code.asm.cfg
print("+++ IR-CFG for %s +++" % method)
print(ircfg.formatSimple())
Running on Desktop Client. Run this script in the UI client via File, Scripts, Run… (hotkey: F3). Remember to open a binary file first, with a version of JEB that ships with the decompiler for that file’s architecture.
Running on the command-line. You may also decide to run it on the command-line. Example, on Windows:
$ jeb_wincon.bat -c --srv2 --script=PrintNativeRoutineIR.py -- winxp32bit/notepad.exeExample output:
... <trimmed>
...
+++ IR-CFG for Method{sub_1001929}@1001929h +++
0000/1>  s32:_$eax = 32<s16:_$ds>[s32:_gvar_100A4A8]
0001/1:  if !(s32:_$eax) goto 0003
0002/1+  call s32:_GlobalFree(s32:_$eax)->(s32:_$eax){i32:0100193Ch}
0003/1+  s32:_$eax = 32<s16:_$ds>[s32:_gvar_100A4AC]
0004/1:  if !(s32:_$eax) goto 0006
0005/1+  call s32:_GlobalFree(s32:_$eax)->(s32:_$eax){i32:01001948h}
0006/1+  32<s16:_$ds>[s32:_gvar_100A4A8] = i32:00000000h
0007/1:  32<s16:_$ds>[s32:_gvar_100A4AC] = i32:00000000h
0008/1:  return s32:_$eax
Conclusion
That is it for part 1. In part 2, we will continue our exploration of the IR and see how we can hook into the decompilation pipeline to write our custom optimizers to clean packer-specific obfuscation, as well as make use of the data flow analysis components available with the IR-CFG. Stay tuned!
- Working on IR presents several advantages, two of which being: a/ the reduction of coupling between the analysis pipeline and the input native architecture; b/ and offering a side-effect free representation of a program. ↩
- The design choices of JEB IR are out-of-scope for this blog. They may be the subject of a separate document. ↩
- When decompiling routines, IR optimization passes will iteratively refactor and clean-up unnecessary operations. In practice, most flag assignments will end up being removed or consolidated. ↩
3 thoughts on “JEB Native Analysis Pipeline – Part 1: Intermediate Representation”