In this series: Part 1, Part 2, Part 3
What started as a ProGuard + basic string encryption + code reflection tool evolved into a multi-platform, complex solution including: control-flow obfuscation, complex and varied data and resources encryption, bytecode encryption, virtual environment and rooted system detection, application signature and certificate pinning enforcement, native code protection, as well as bytecode virtualization 1, and more.
This article presents the obfuscation techniques used by this app protector, as well as facility made available at runtime to protected programs 2. The analysis that follows was done statically, with JEB 3.20.
Identification
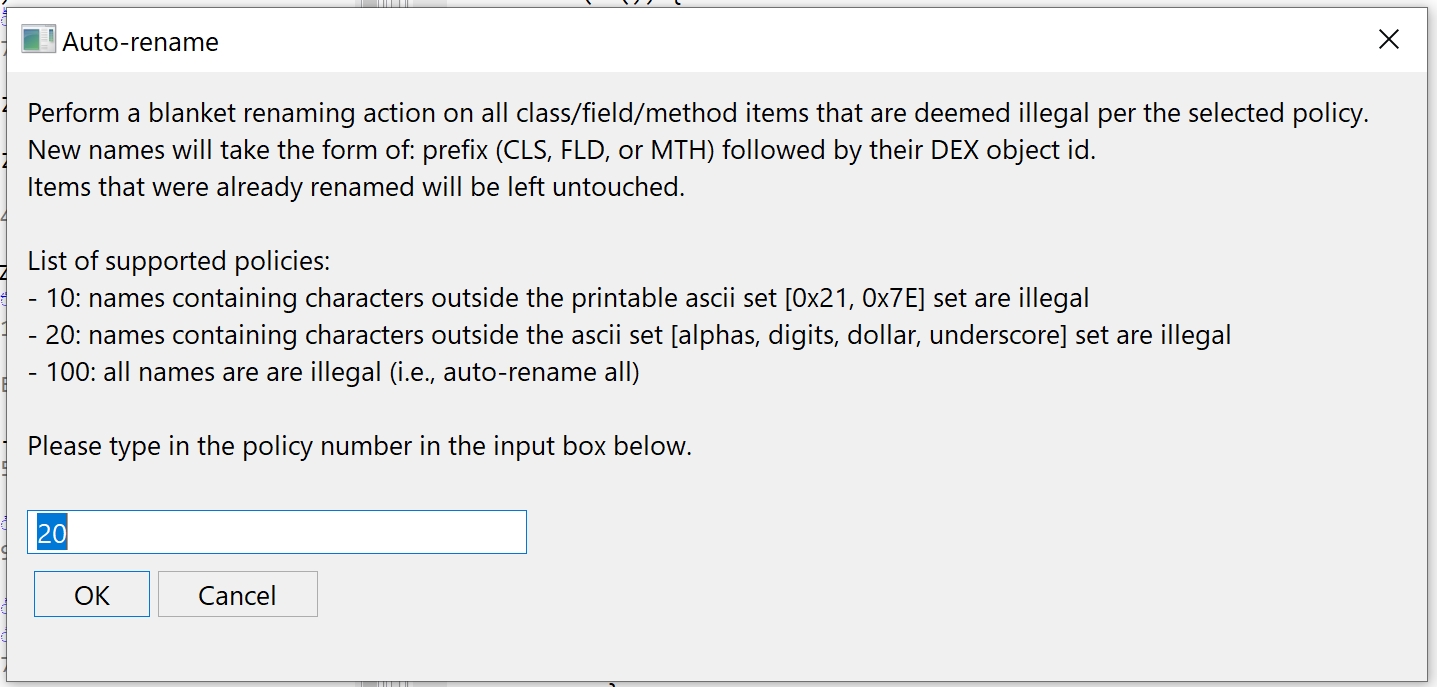
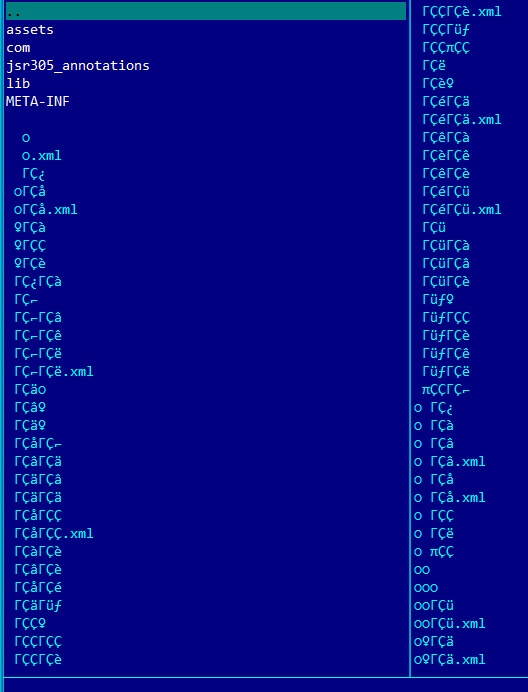
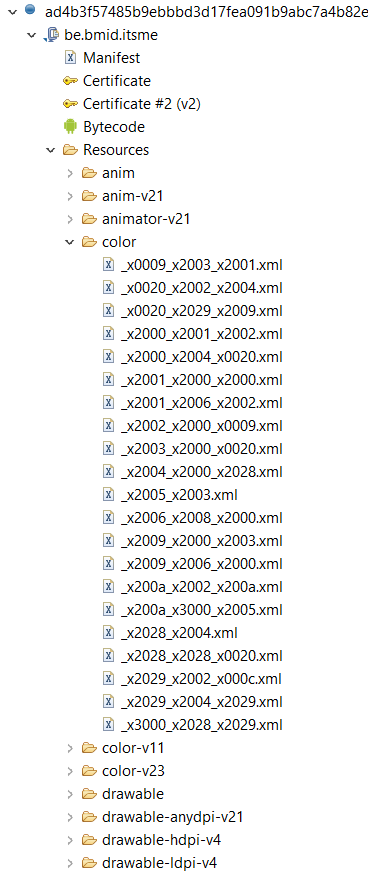
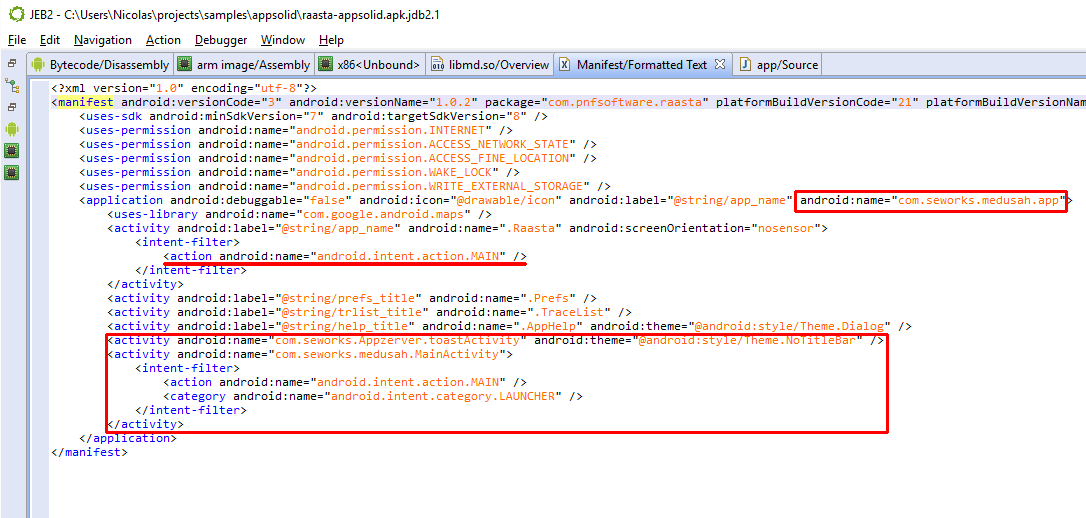
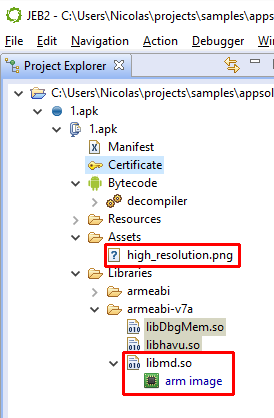
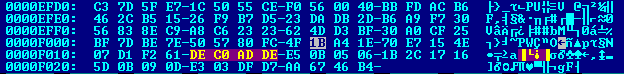
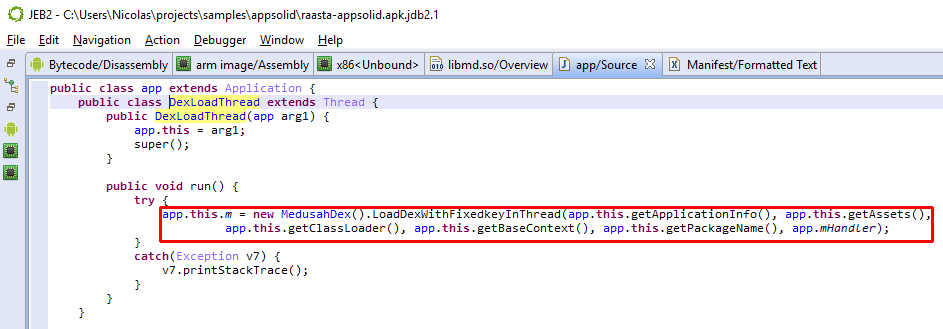
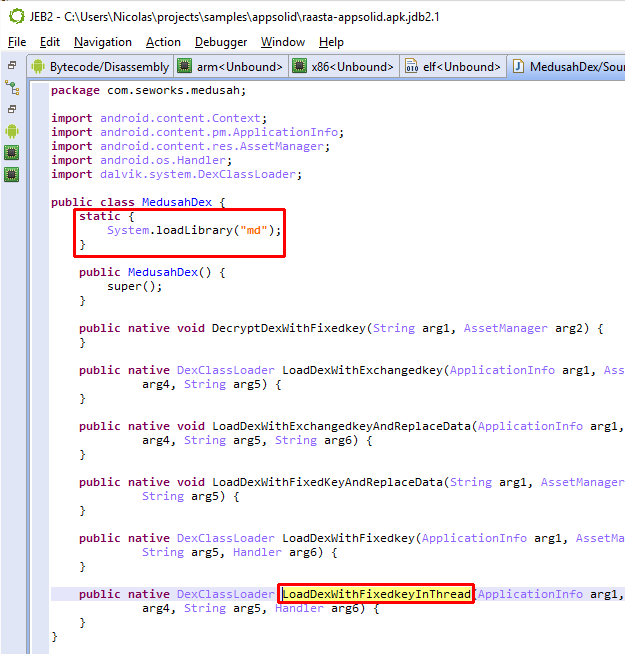
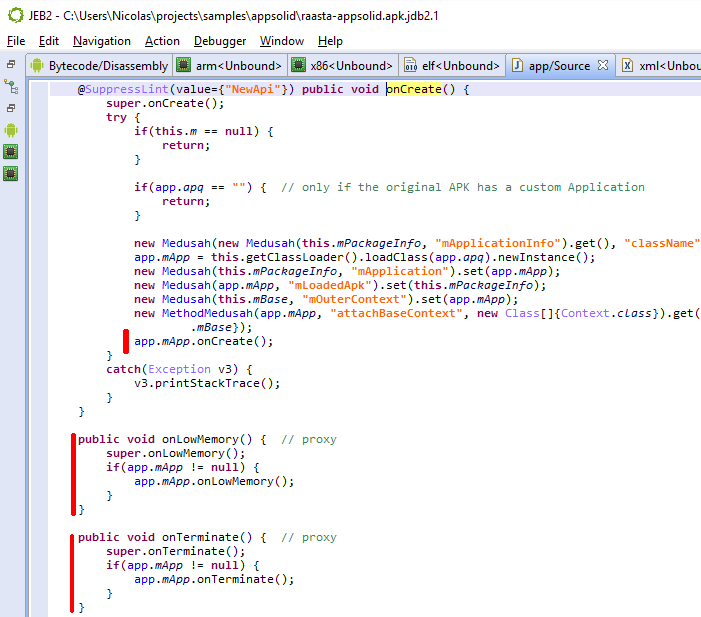
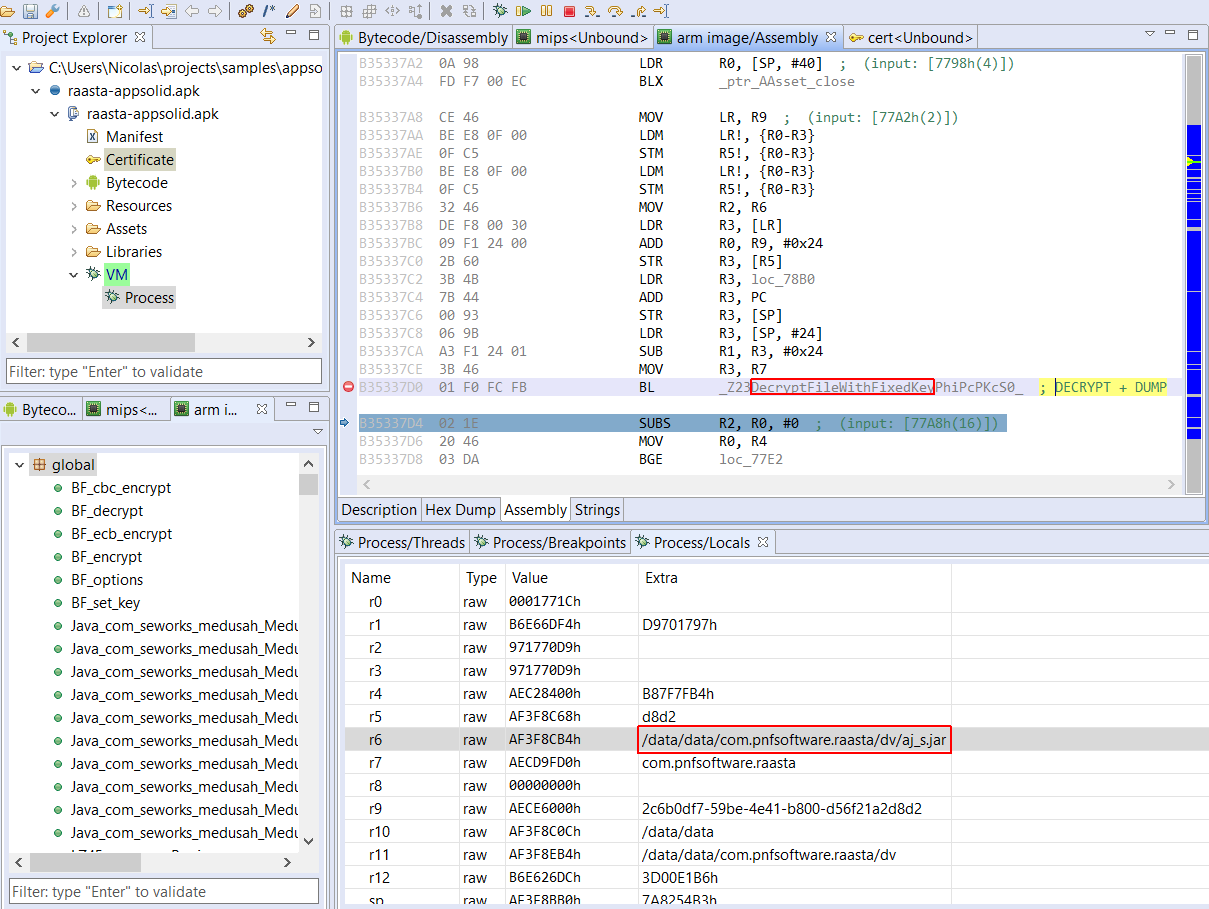
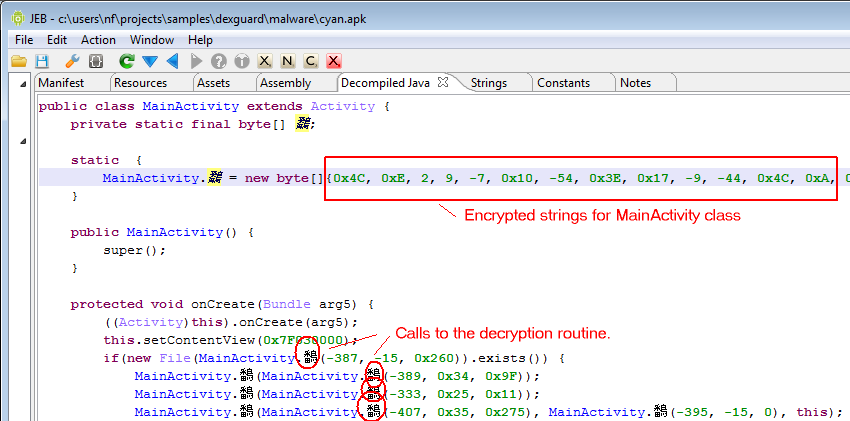
Identifying apps protected by this protector is relatively easy. It seems the default bytecode obfuscation settings place most classes in the o package, and some will be renamed to invalid names on a Windows system, such as con or aux. Closer inspection of the code will reveal stronger hints than obfuscated names: decryption stubs, specific encrypted data, the presence of some so library files, are all tell tale signs, as shown below.
Running a Global Analysis
Let’s run a Global Analysis (menu Android, Global analysis…) with standard settings on the file and see what gets auto-decrypted and auto-unreflected:
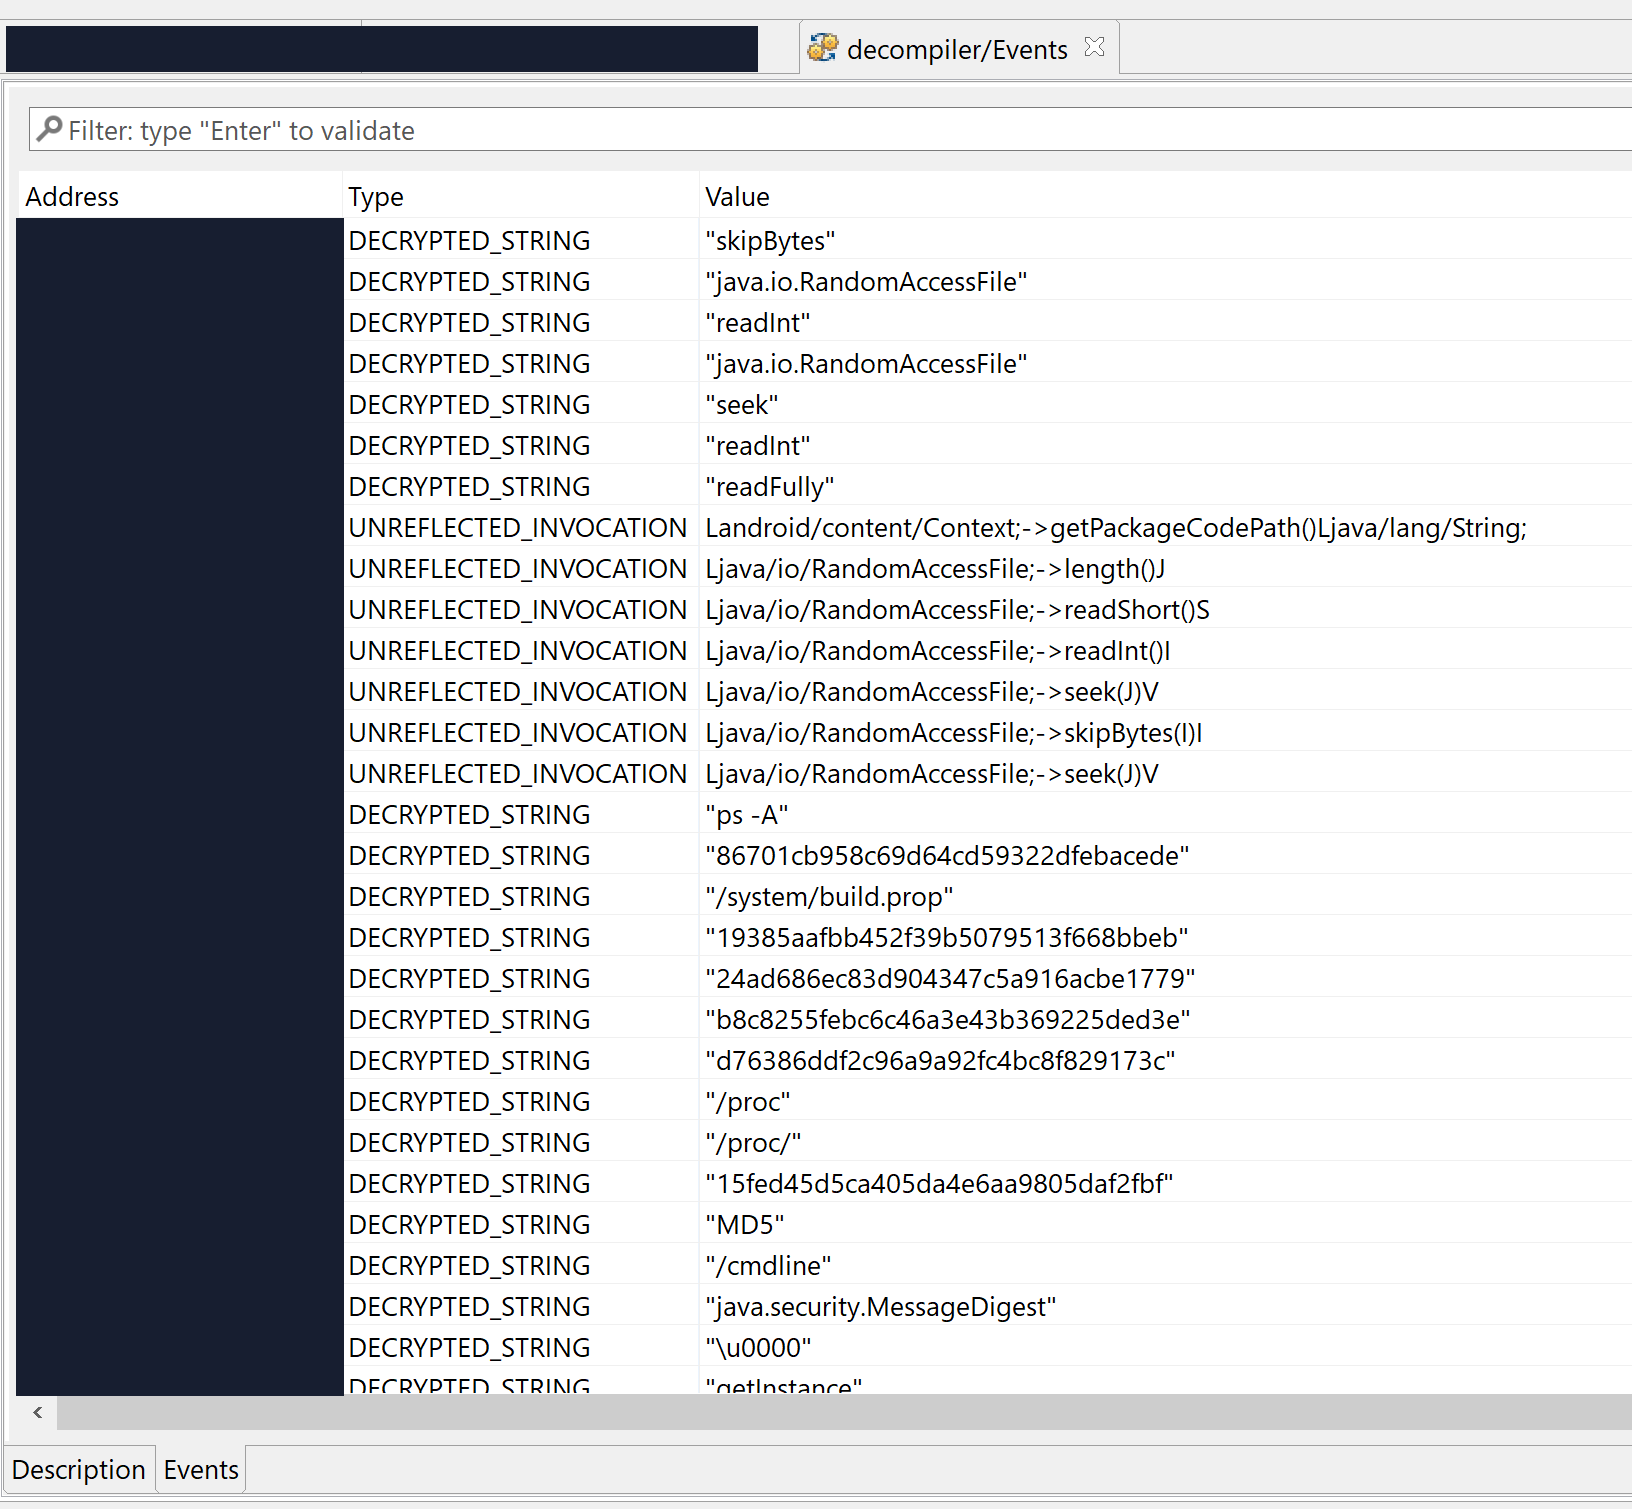
Lots of strings were decrypted, many of them specific to the app’s business logic itself, others related to RASP – that is, library code embedded within the APK, responsible for performing app signature verification for instance. That gives us valuable pointers into where we should be looking at if we’d like to focus on the protection code specifically.
Deobfuscating Code
The first section of this blog focuses on bytecode obfuscation and how JEB deals with it. It is mostly automated, but a final step requires manual assistance to achieve the best results.
Most obfuscated routines exhibit the following characteristics:
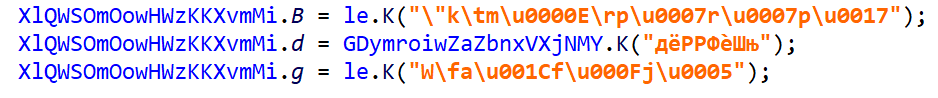
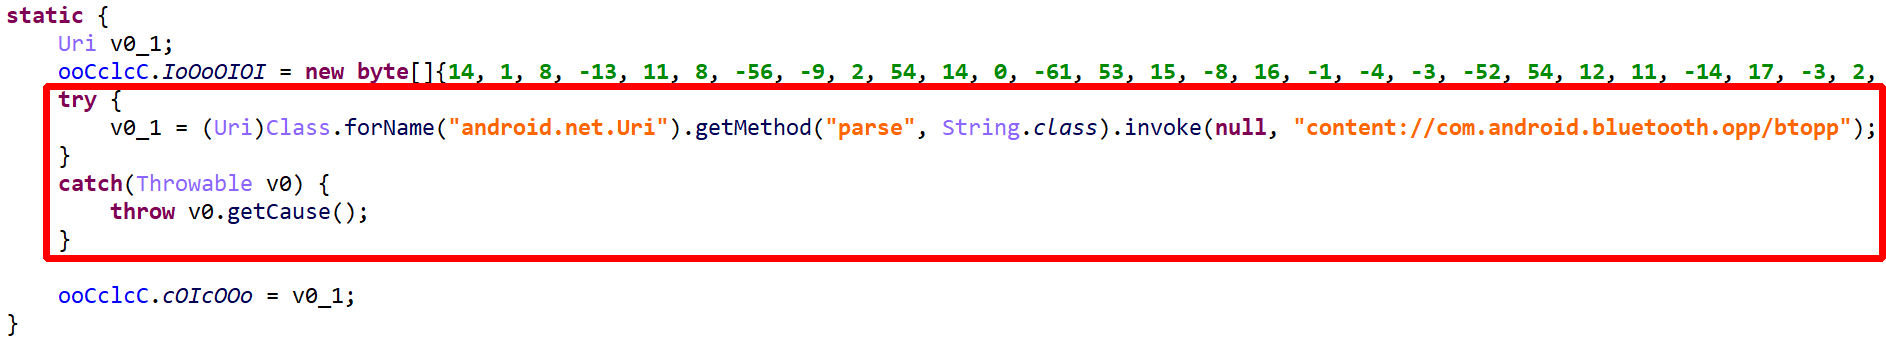
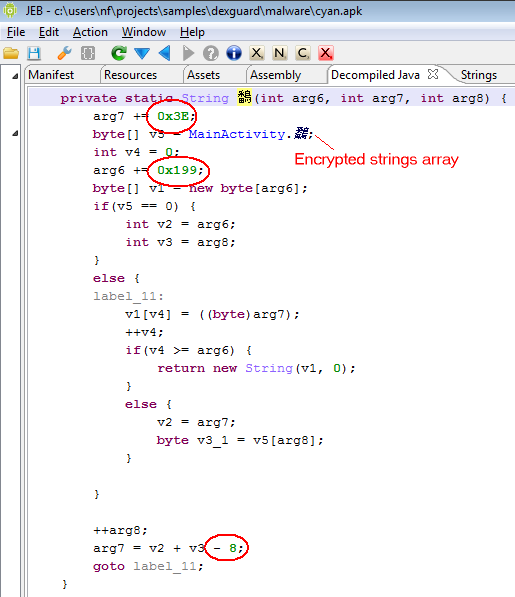
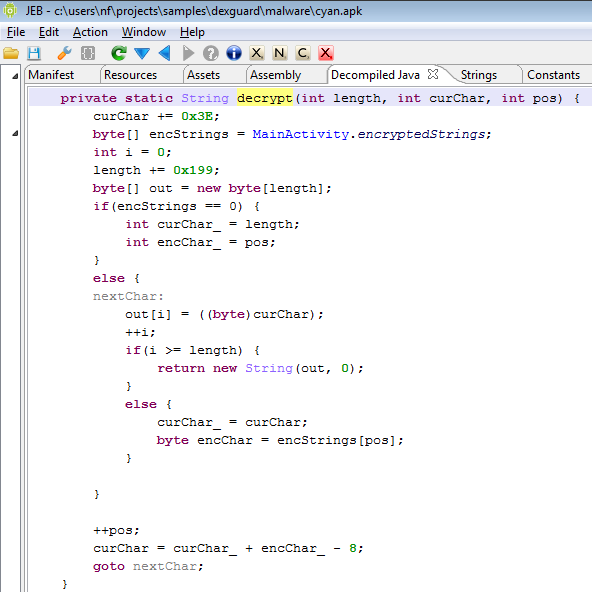
- Dynamically generated strings via the use of per-class decryption routines
- Most calls to external routines are done via reflection
- Flow obfuscation via the use of a couple of opaque integer fields – let’s call them OPI0, OPI1. They are class fields generally initialized to 0 and 1.
- Arithmetic operation obfuscation
- Garbage code insertion
- Unusual protected block structure, leading to fragmented try-blocks, unavoidable to produce semantically accurate raw code
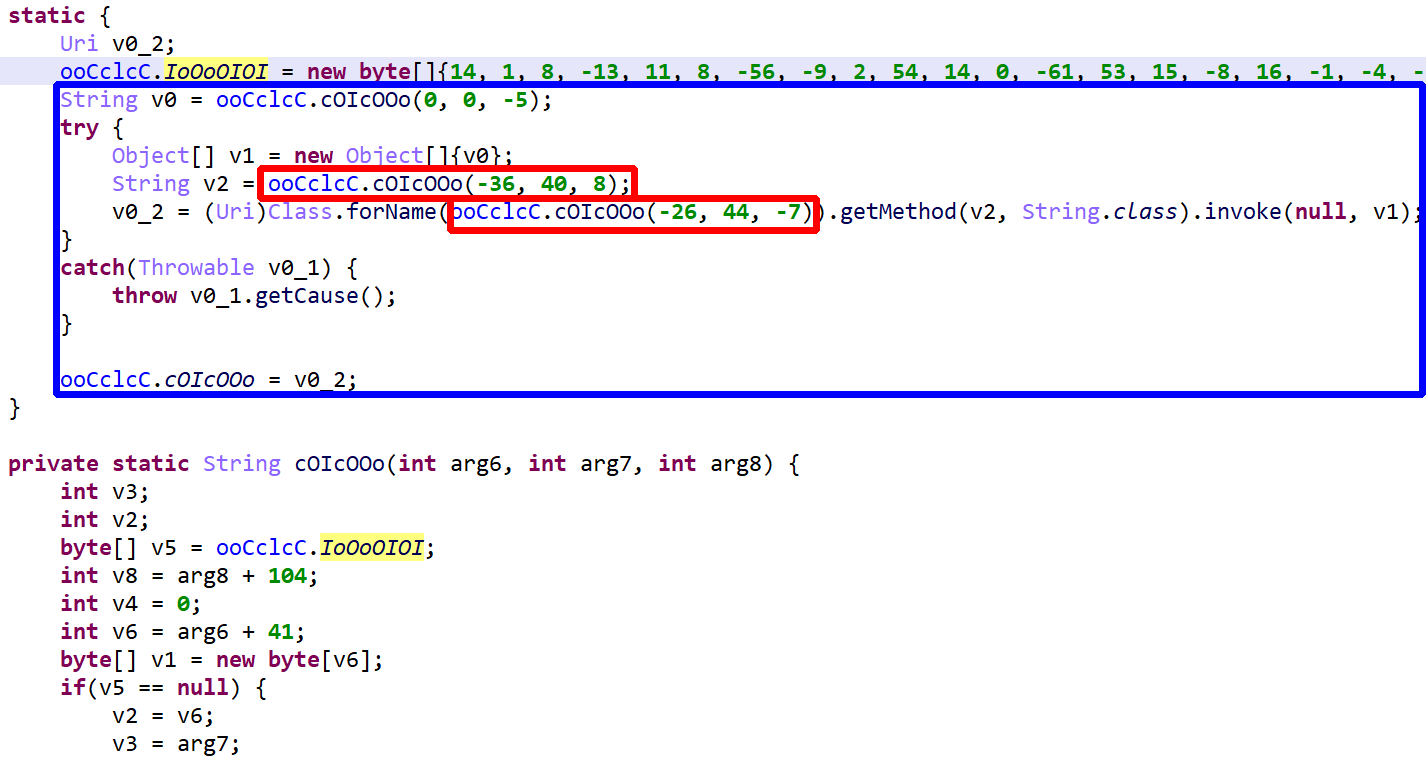
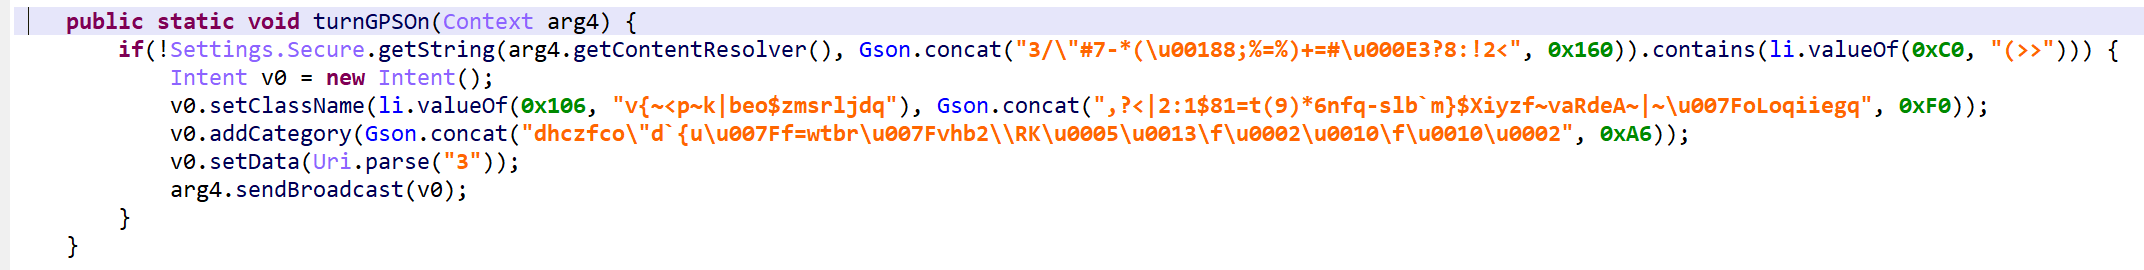
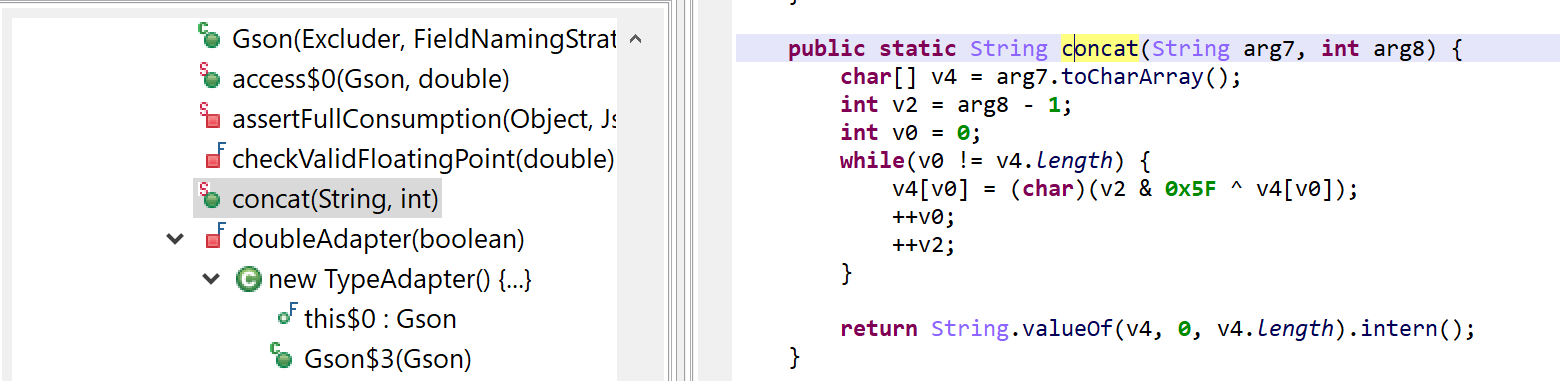
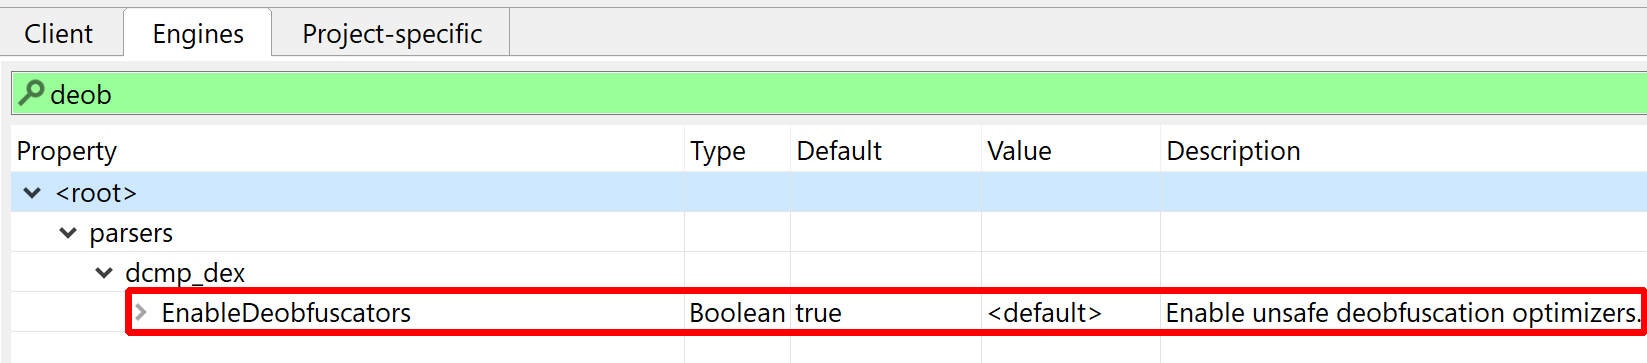
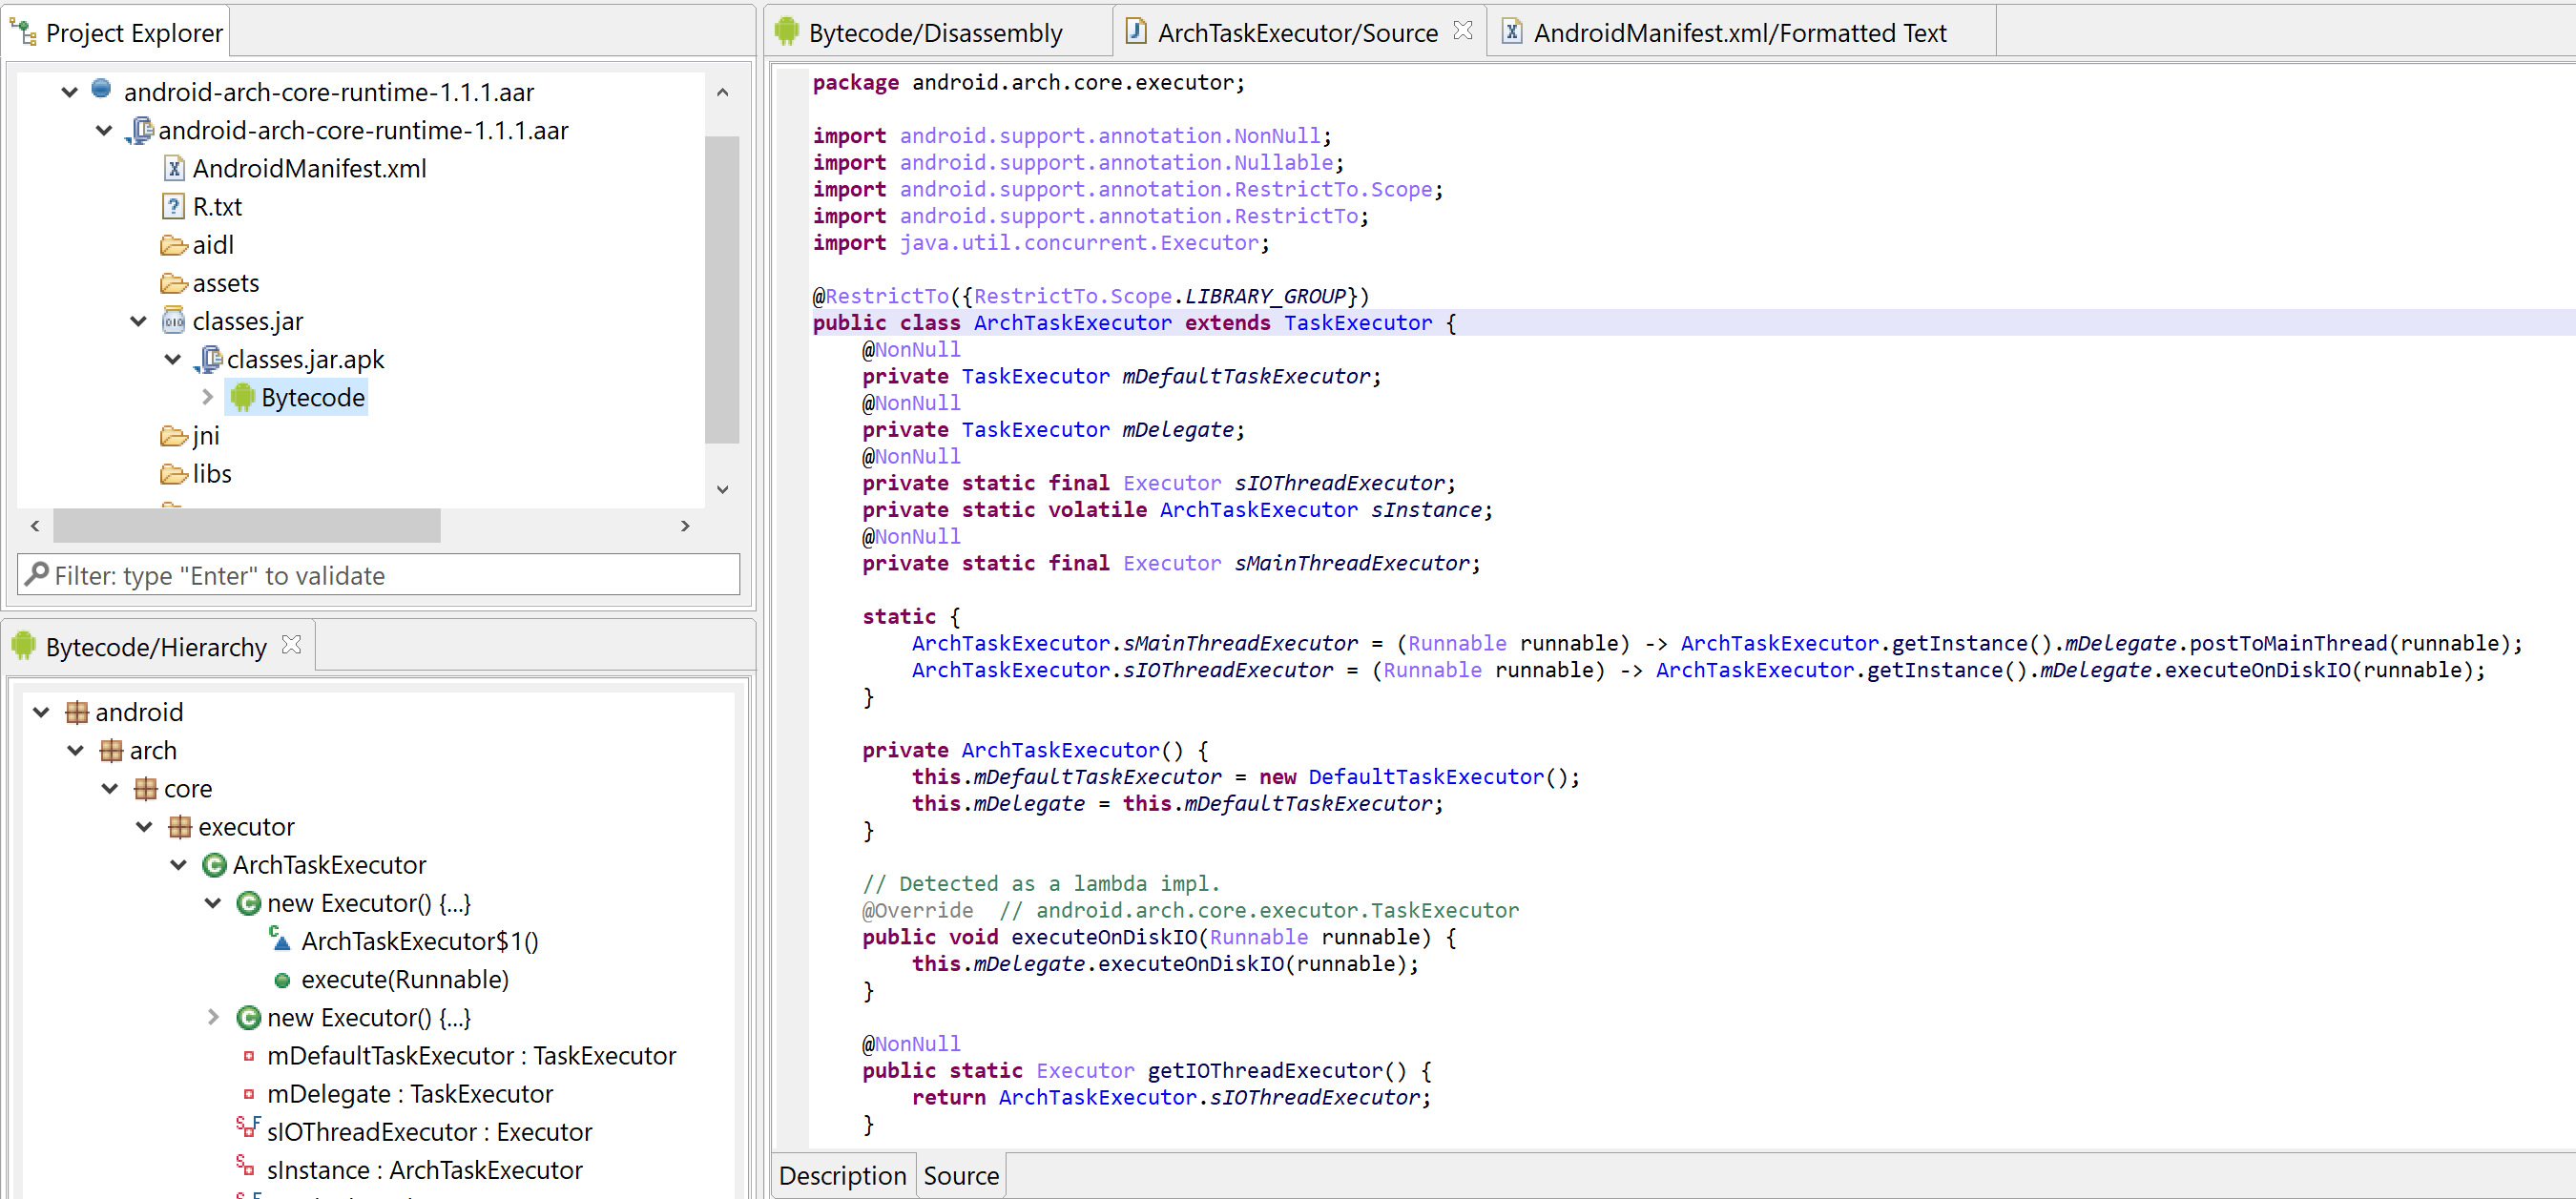
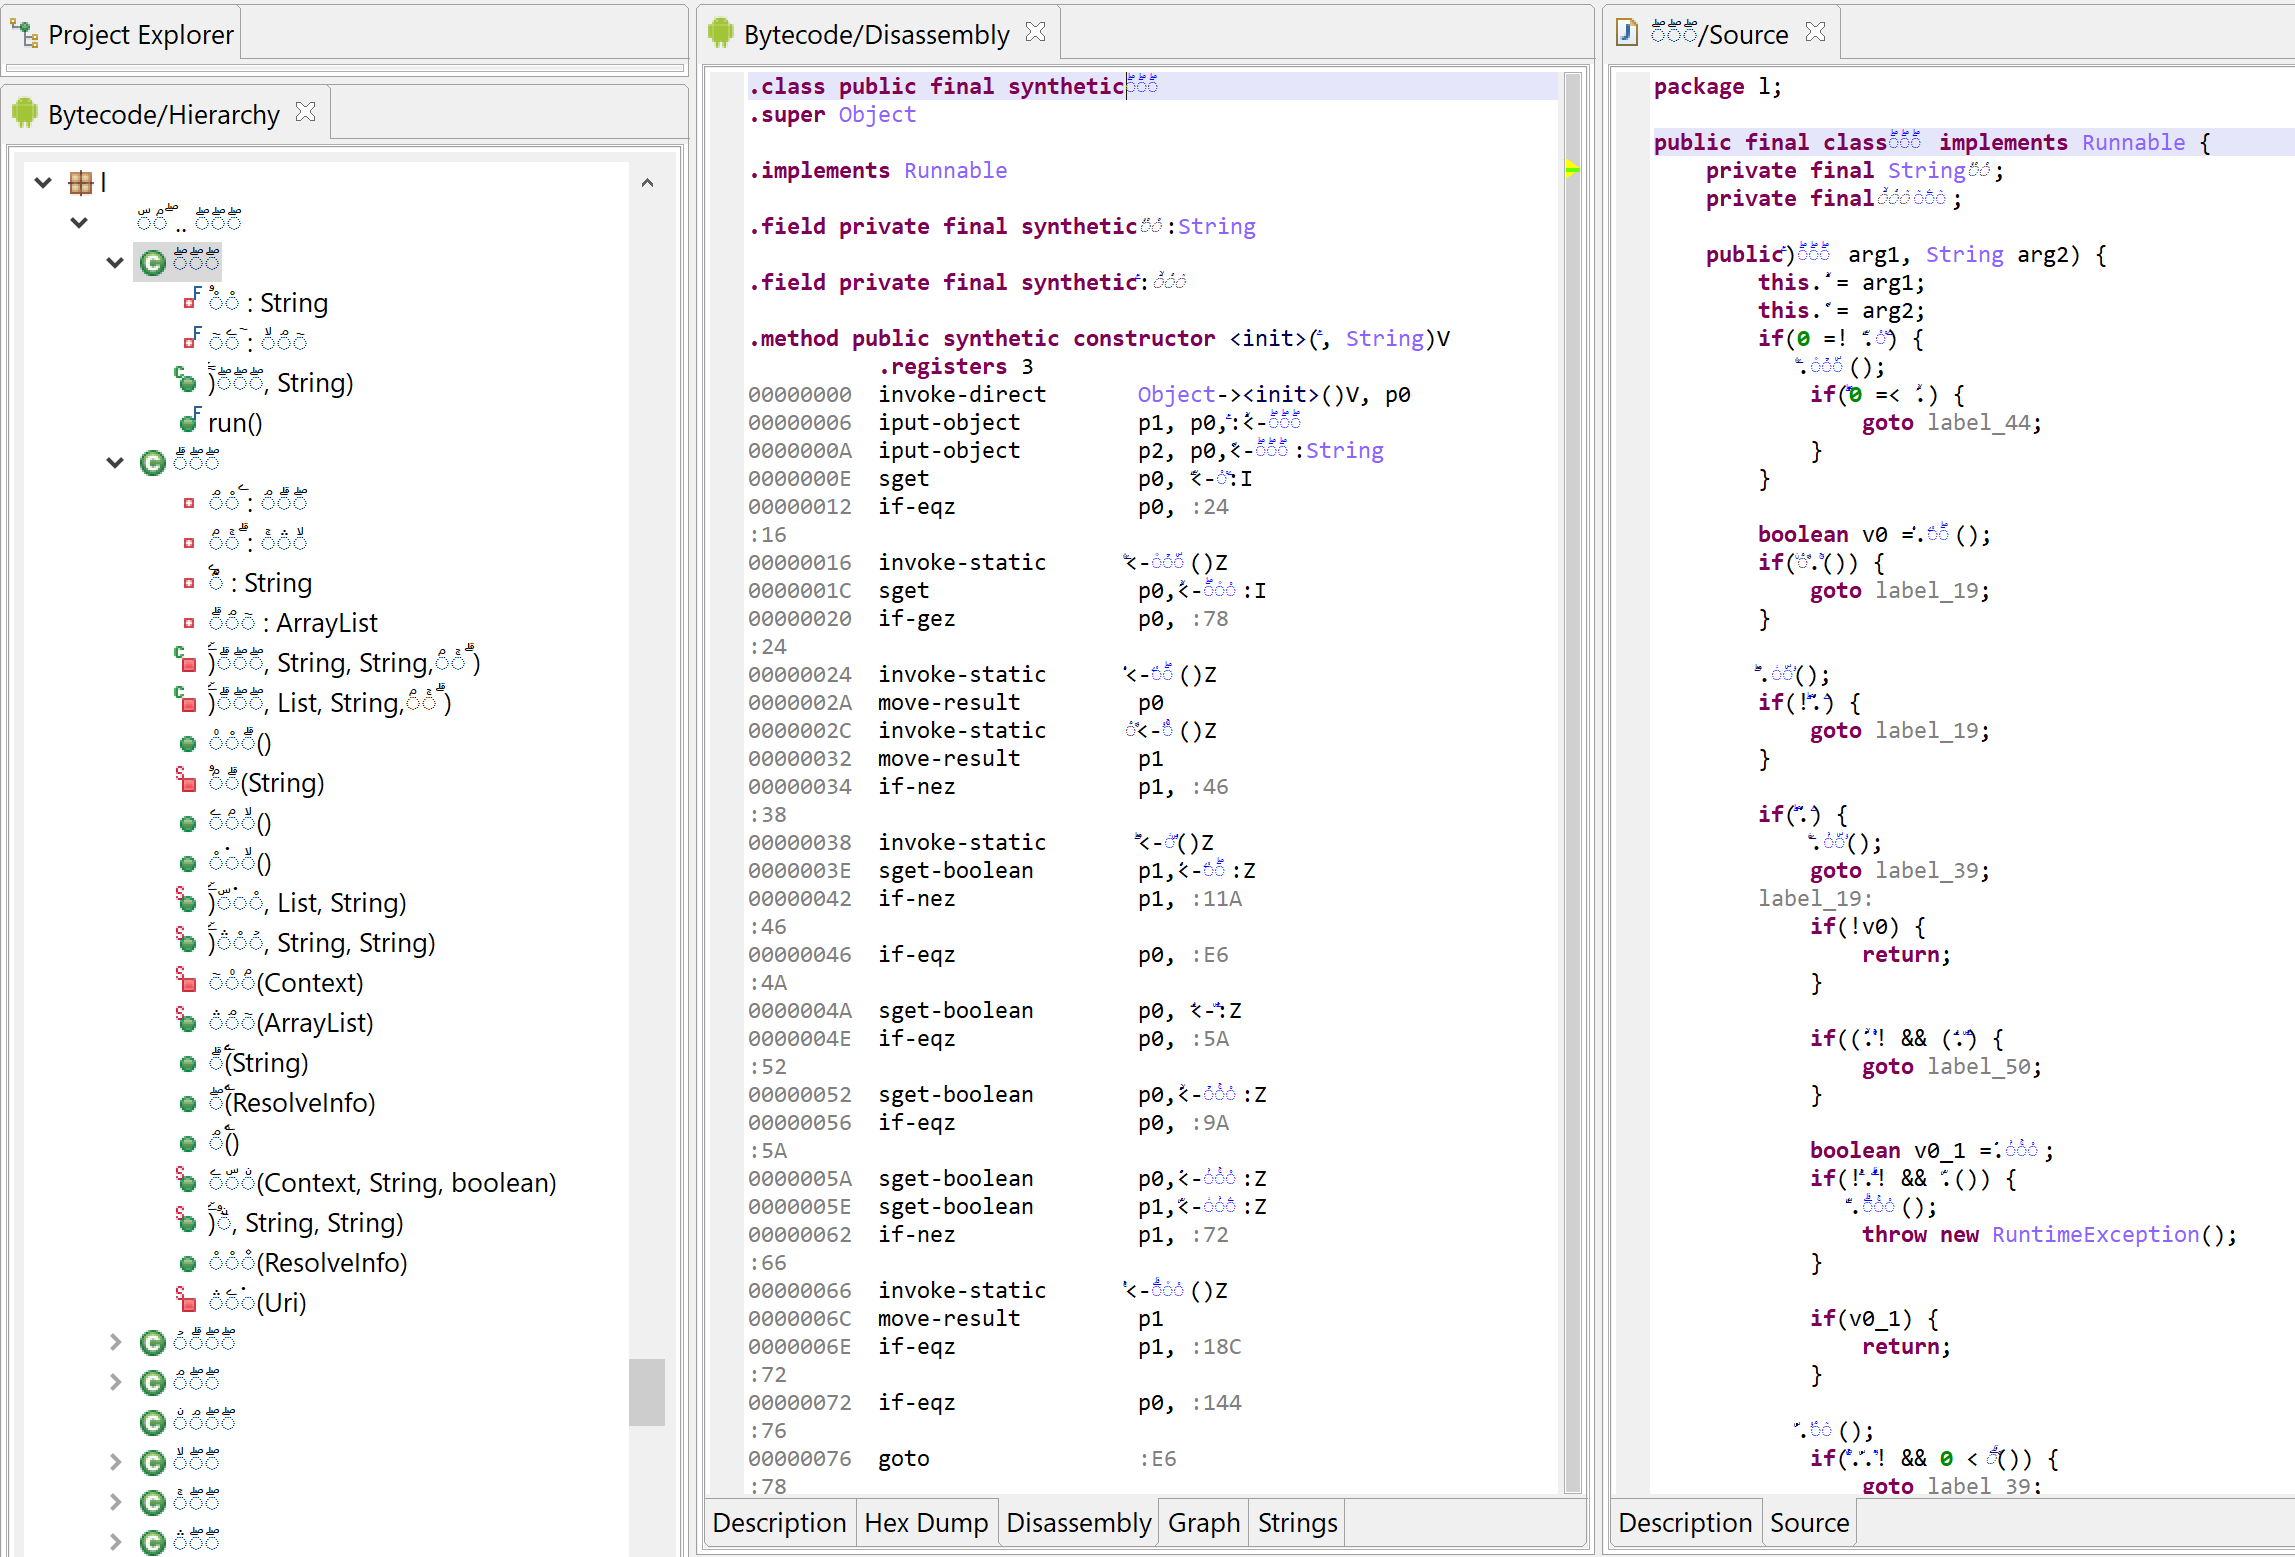
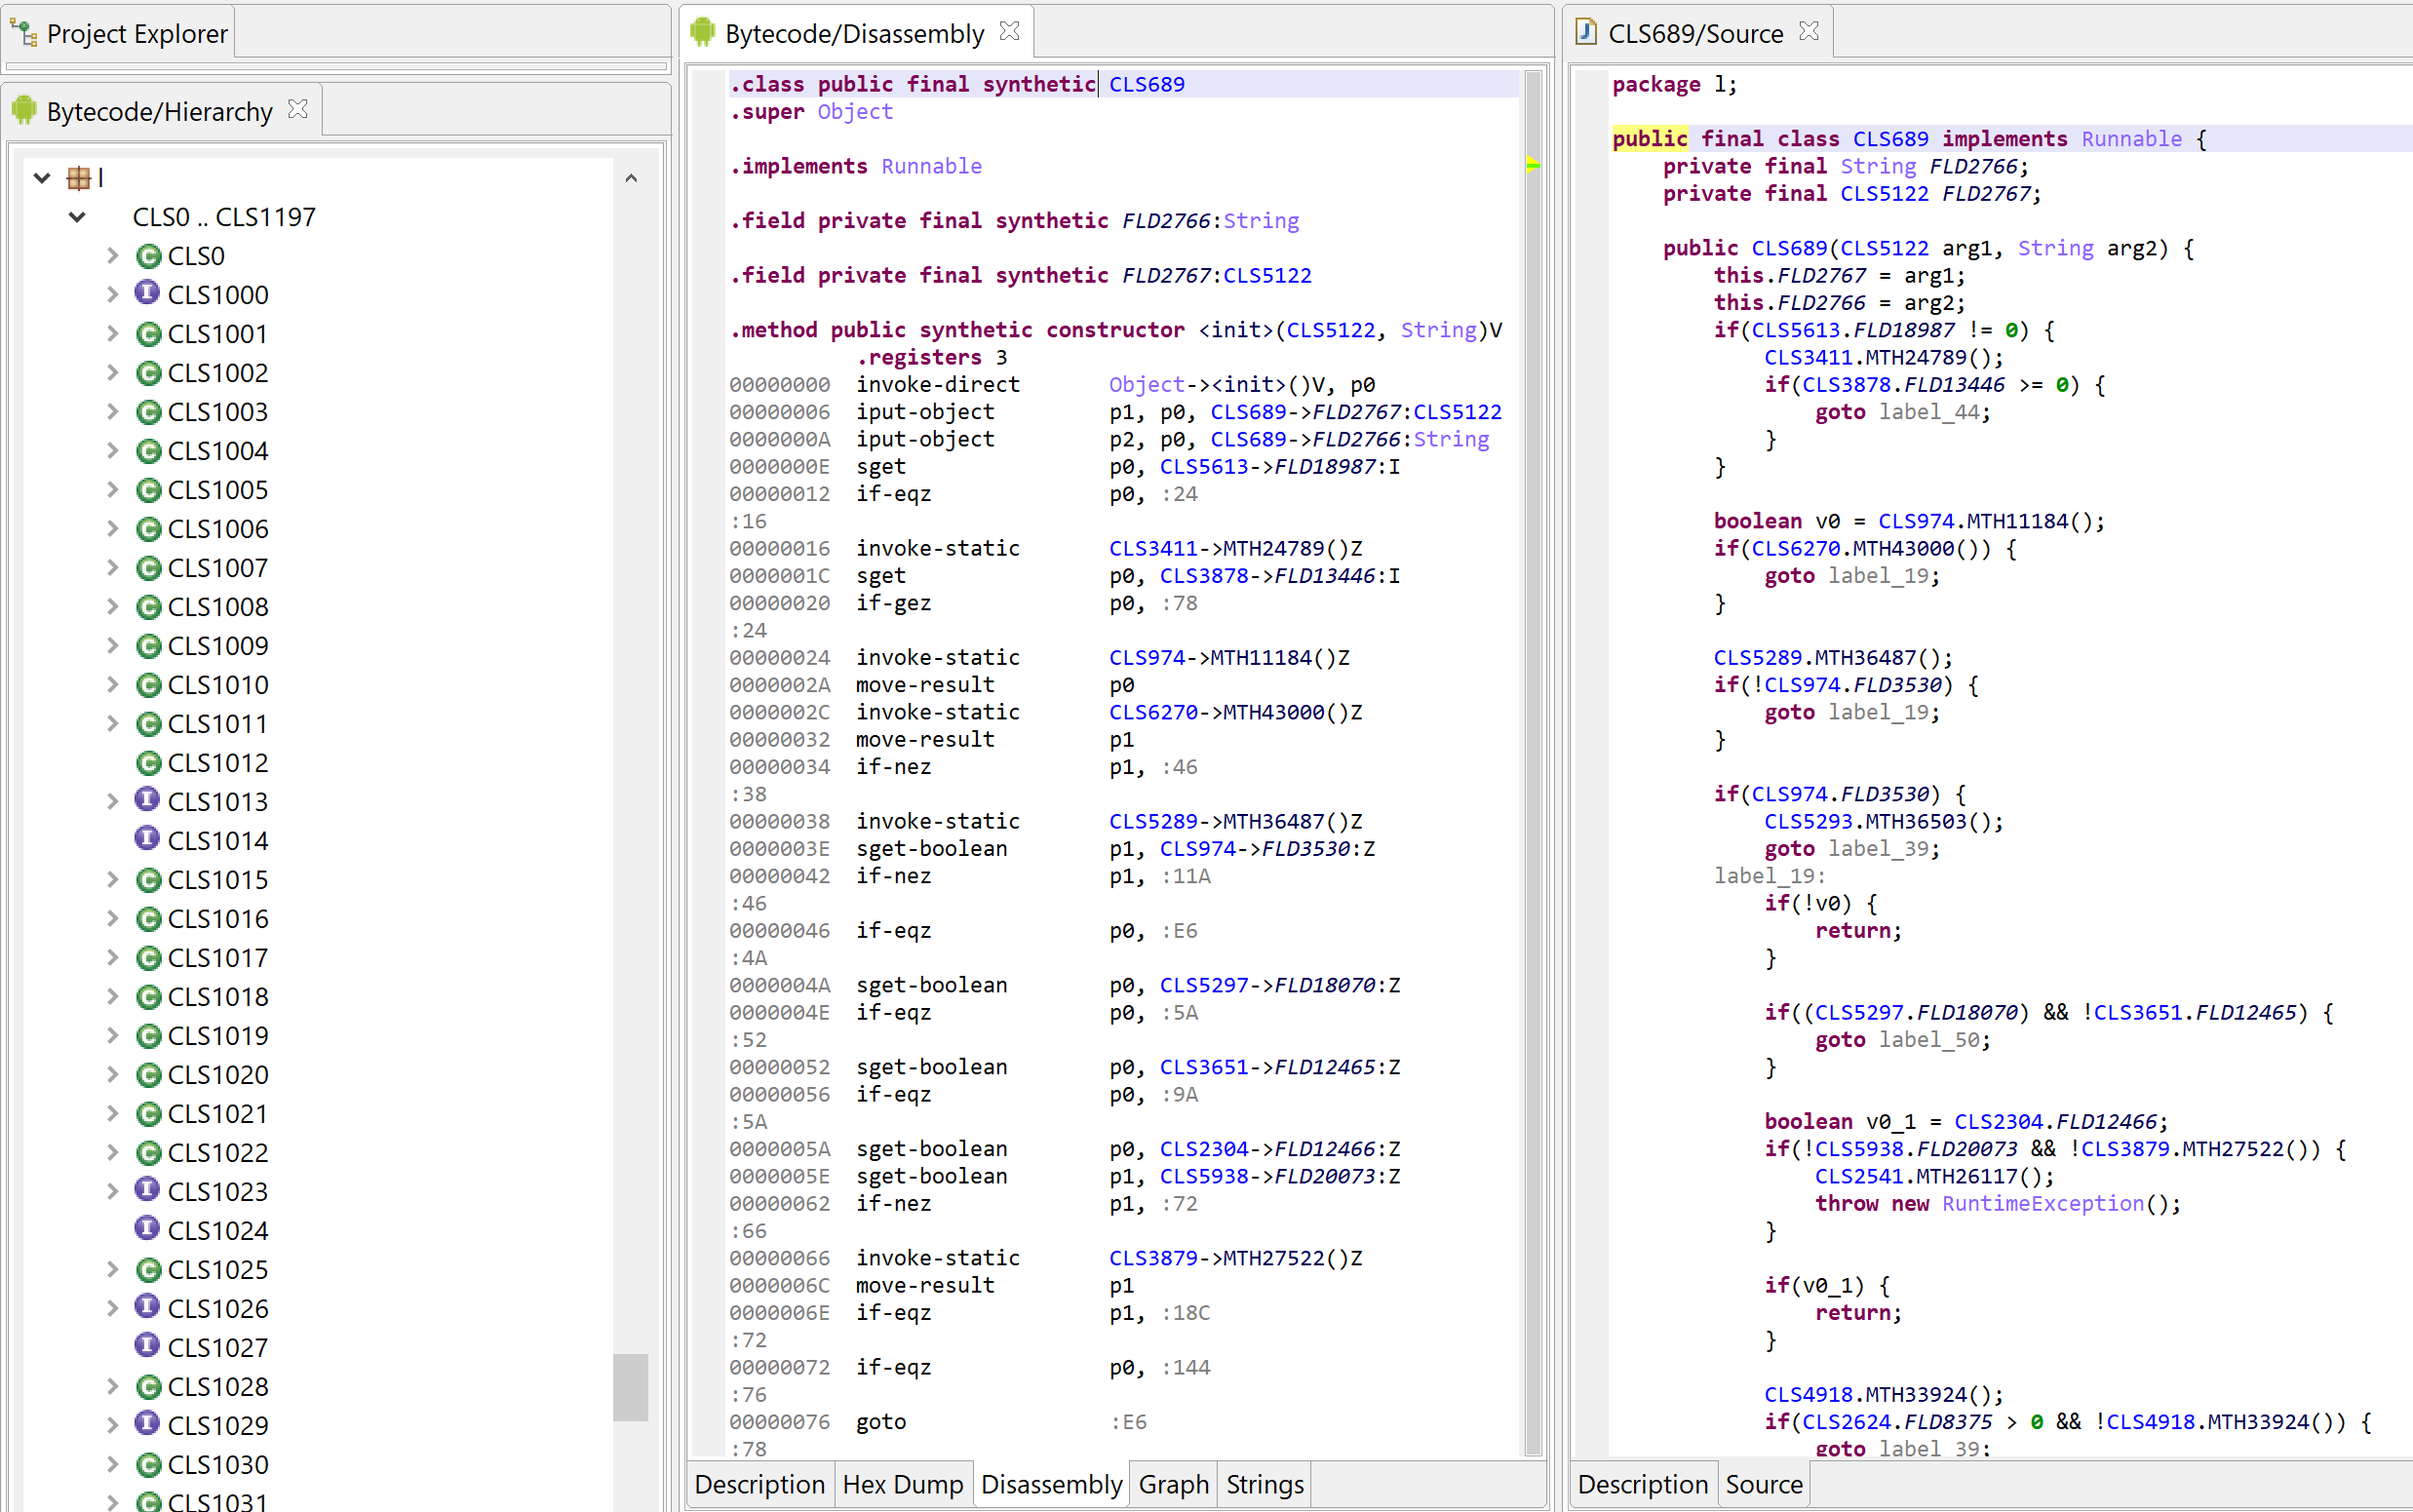
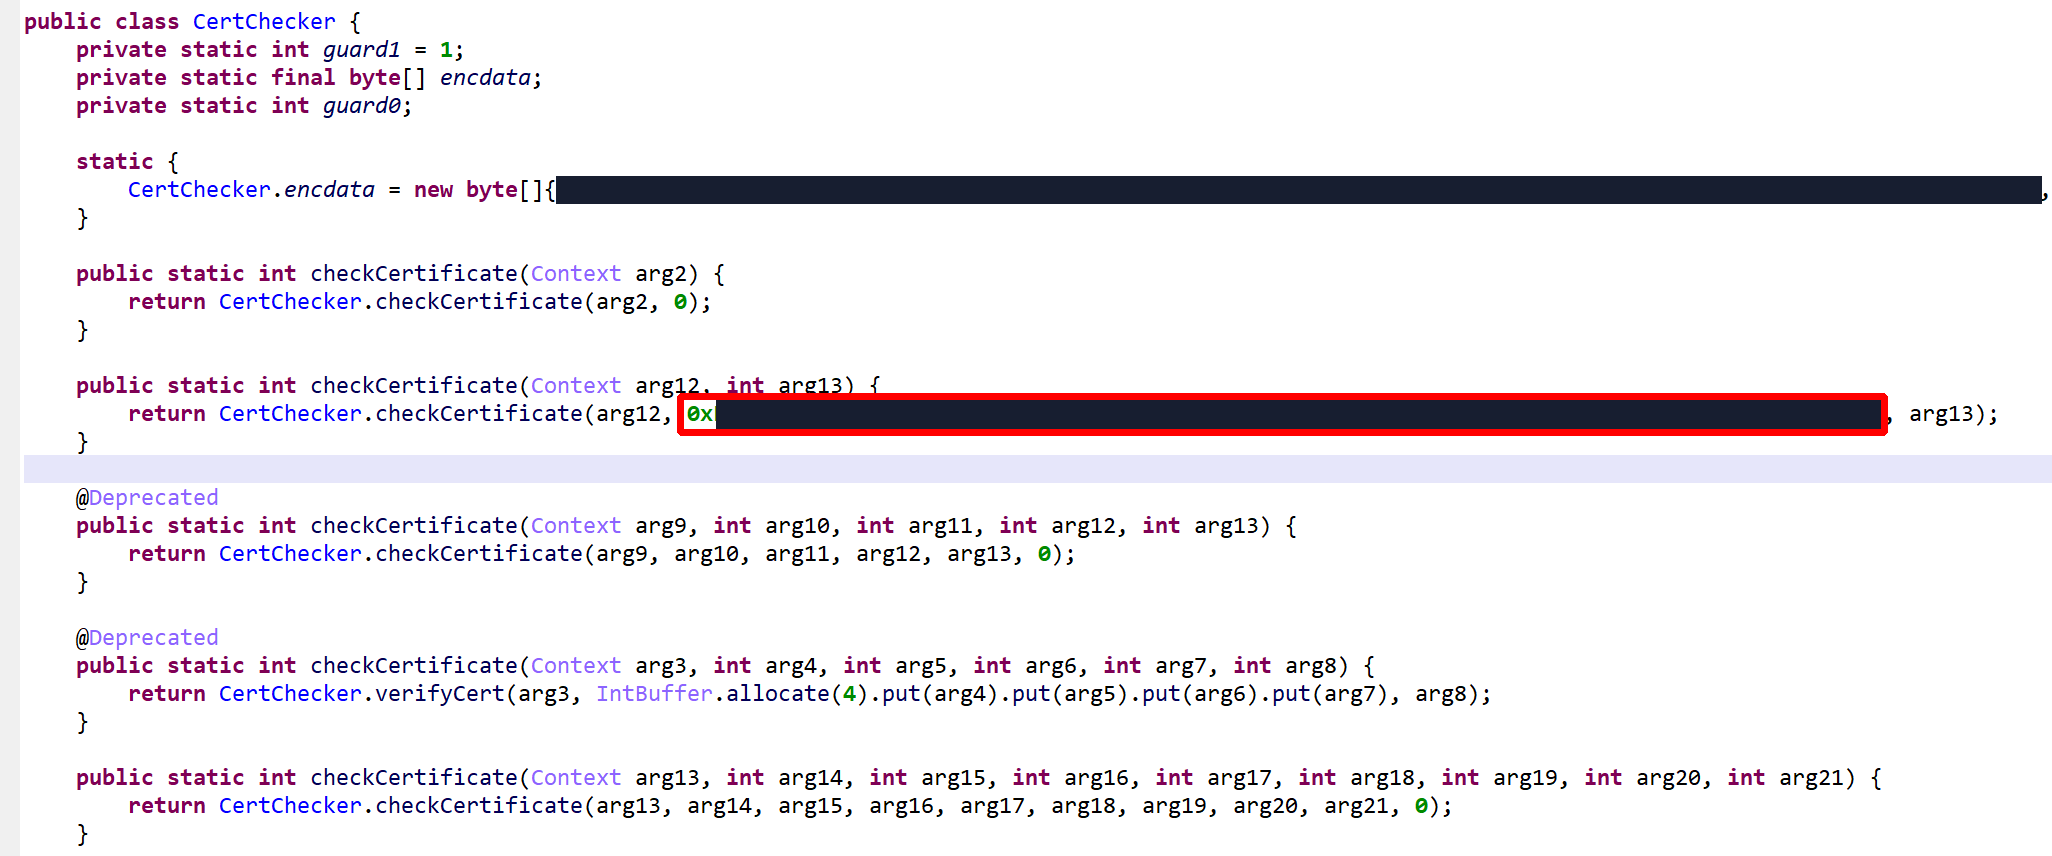
As an example, the following class is used to perform app certificate validation in order, for instance, to prevent resigned apps from functioning. A few items were renamed for clarity; decompilation is done with disabled Deobfuscators (MOD1+TAB, untick “Enable deobfuscators”):
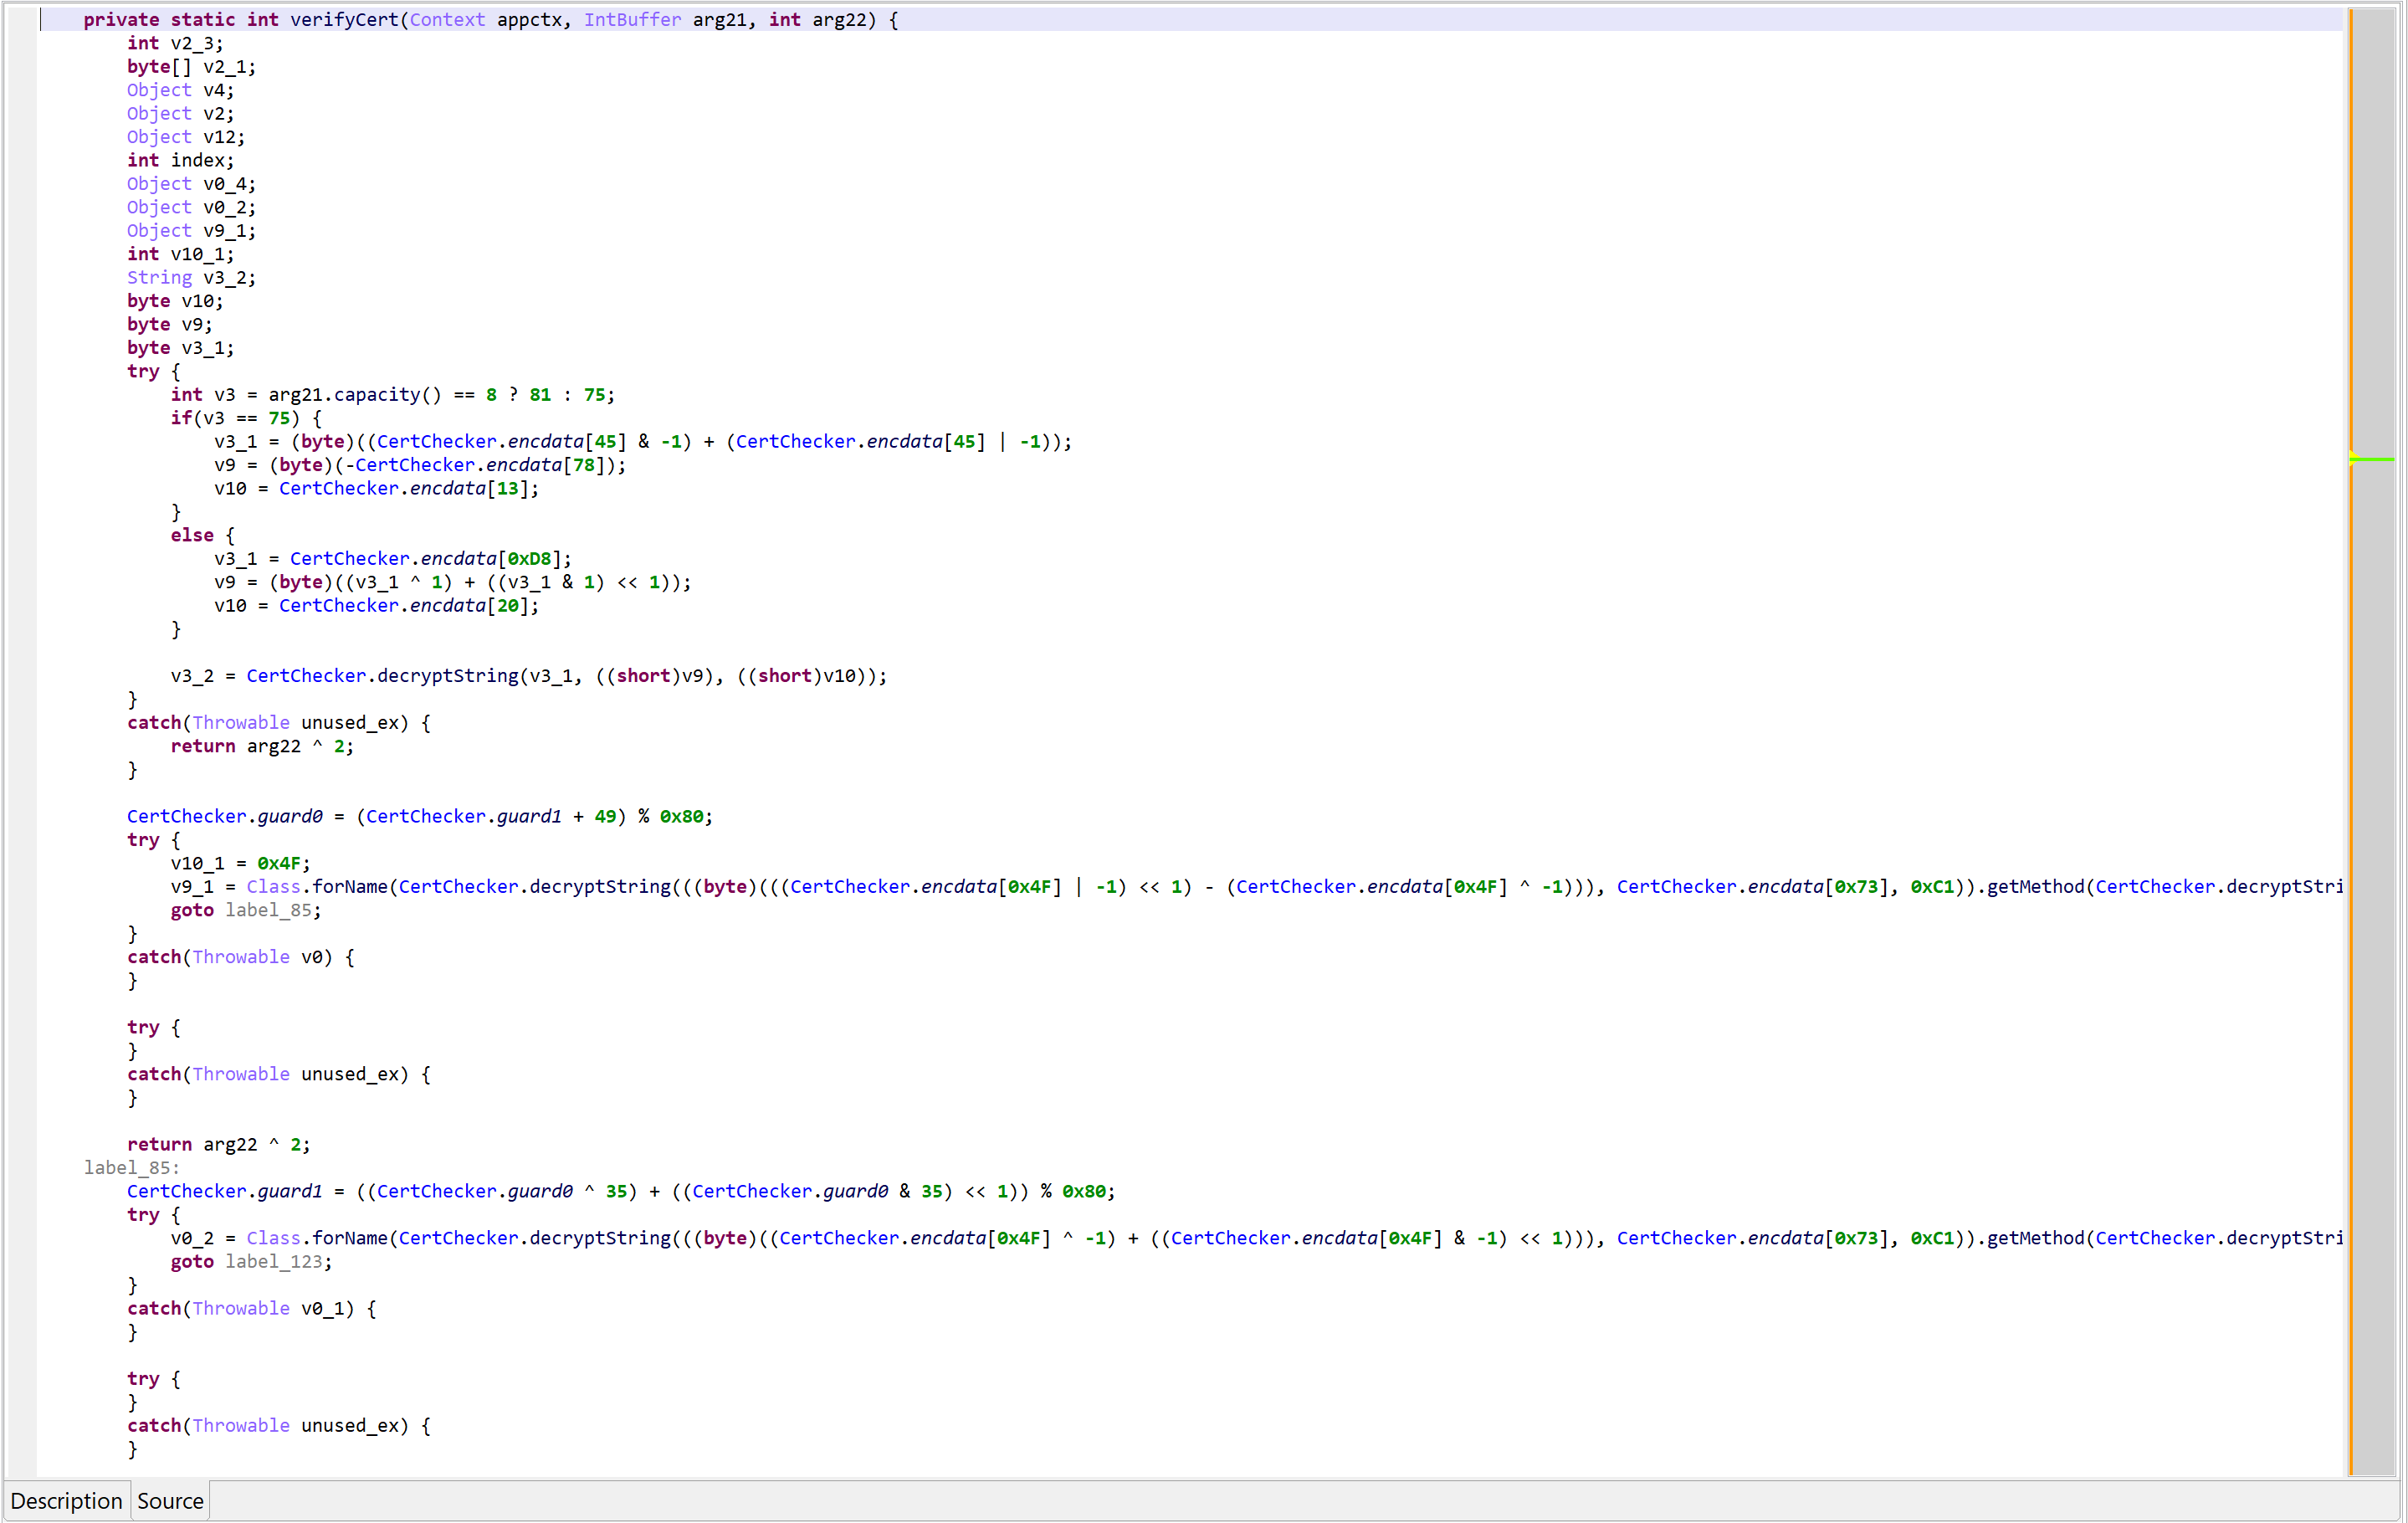
In practice, such code is quite hard to comprehend on complex methods. With obfuscators enabled (the default setting), most of the above will be cleared.
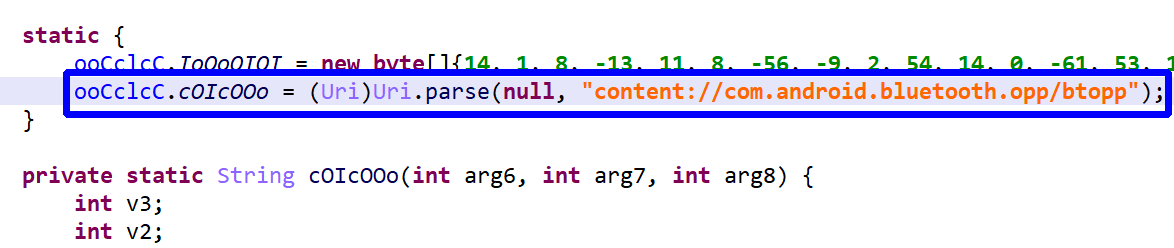
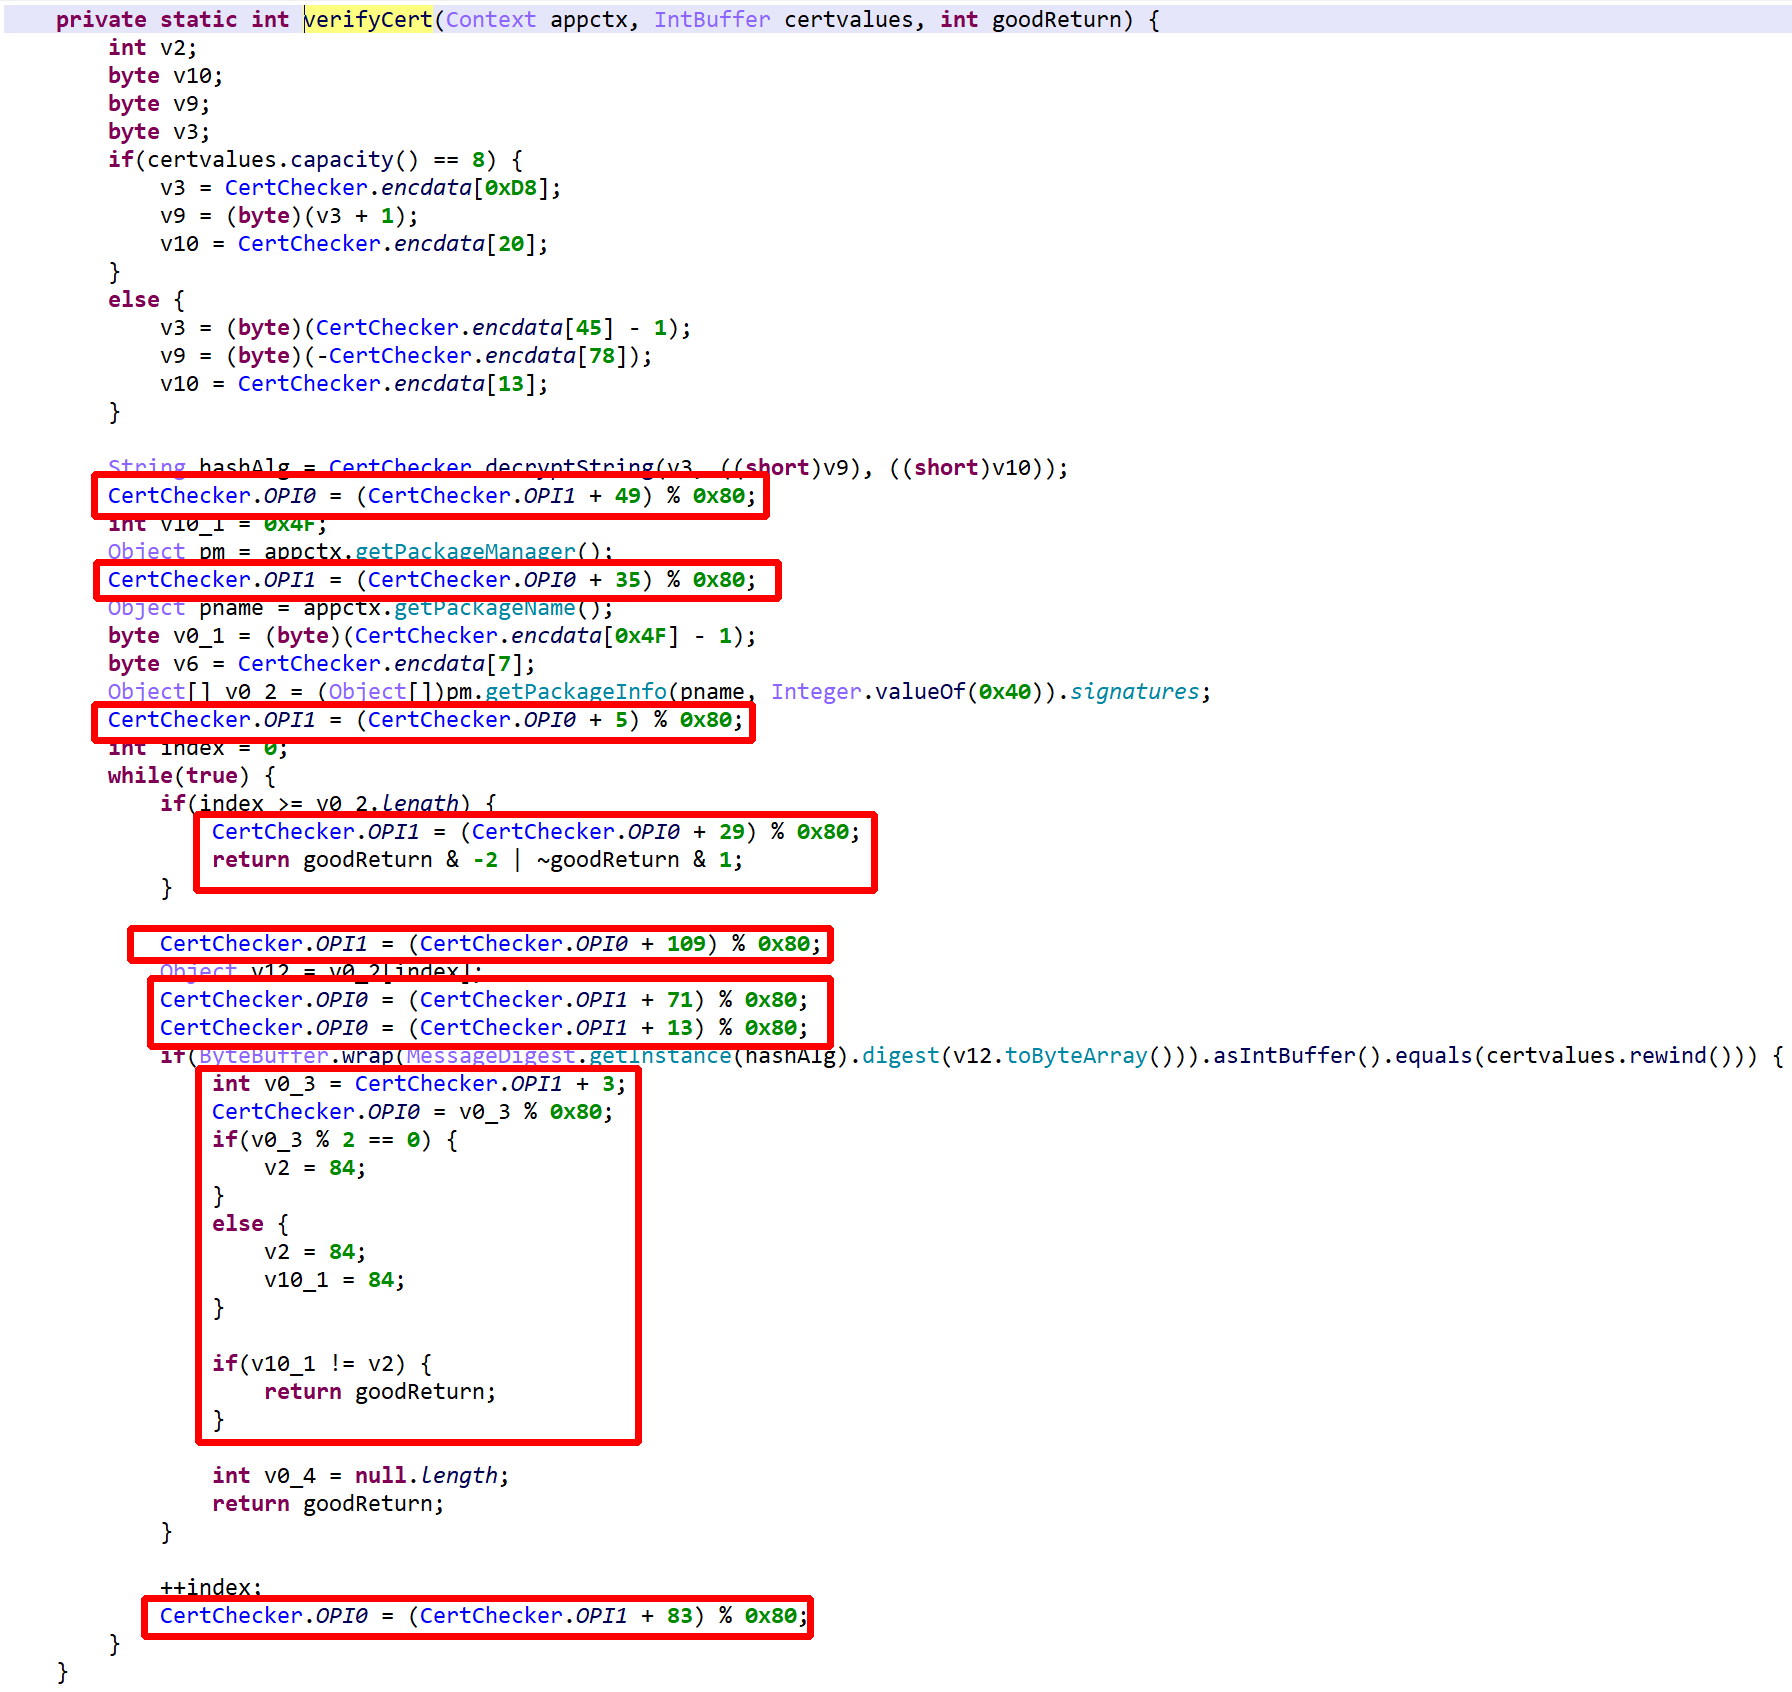
See the re-decompilation of the same class, below.
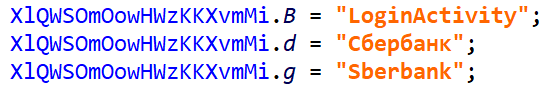
- strings are decrypted…
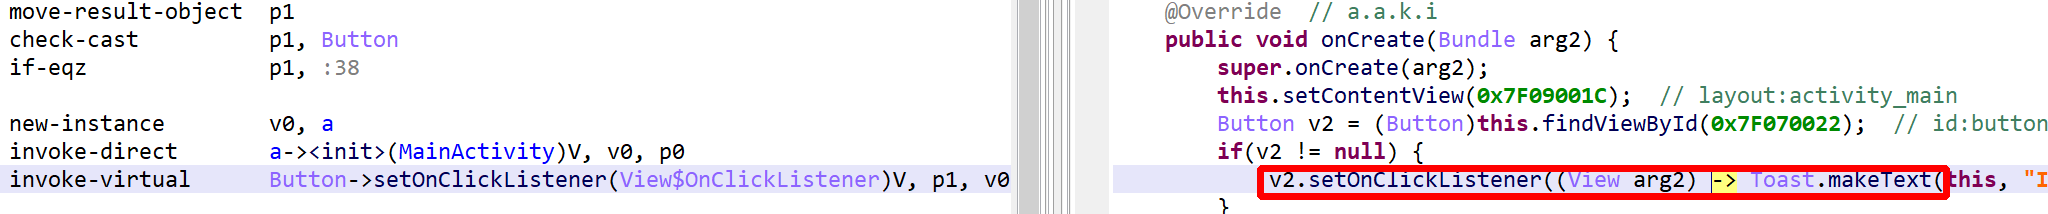
- …enabling unreflection
- most obfuscation is removed…
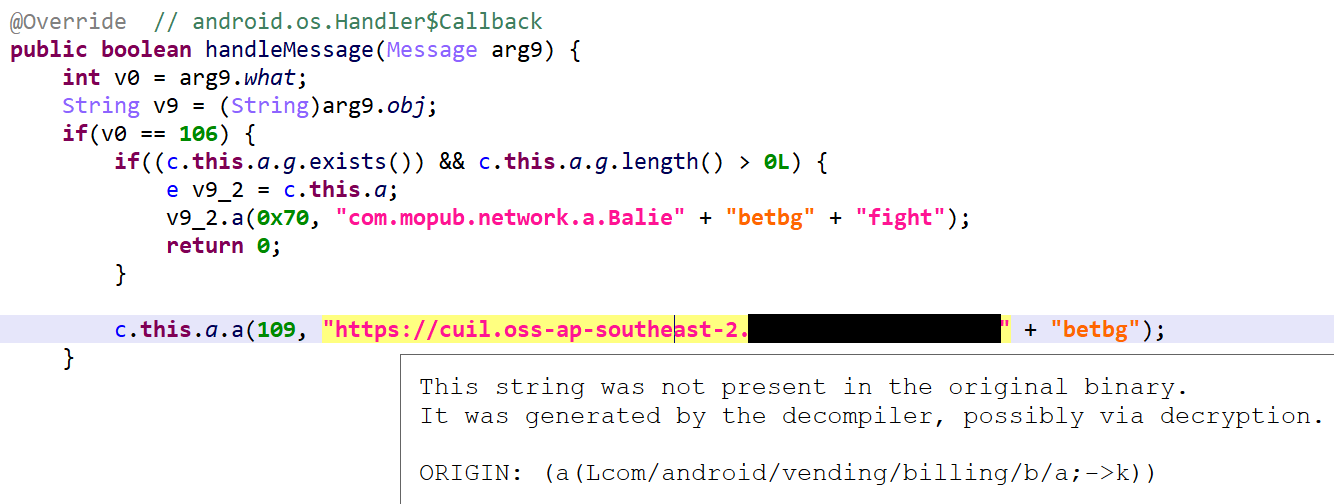
- except for some control flow obfuscation that remains because JEB was unable to process OPI0/OPI1 directly (below,
Let’s give a hint to JEB as to what OPI0/OPI1 are.
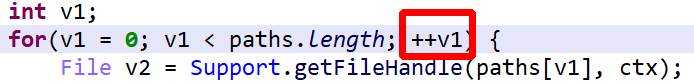
- When analyzing protected apps, you can rename OPI0 and OPI1 to guard0 and guard1, respectively, to allow JEB go aggressively clean the code
- Redecompile the class after renaming the fields
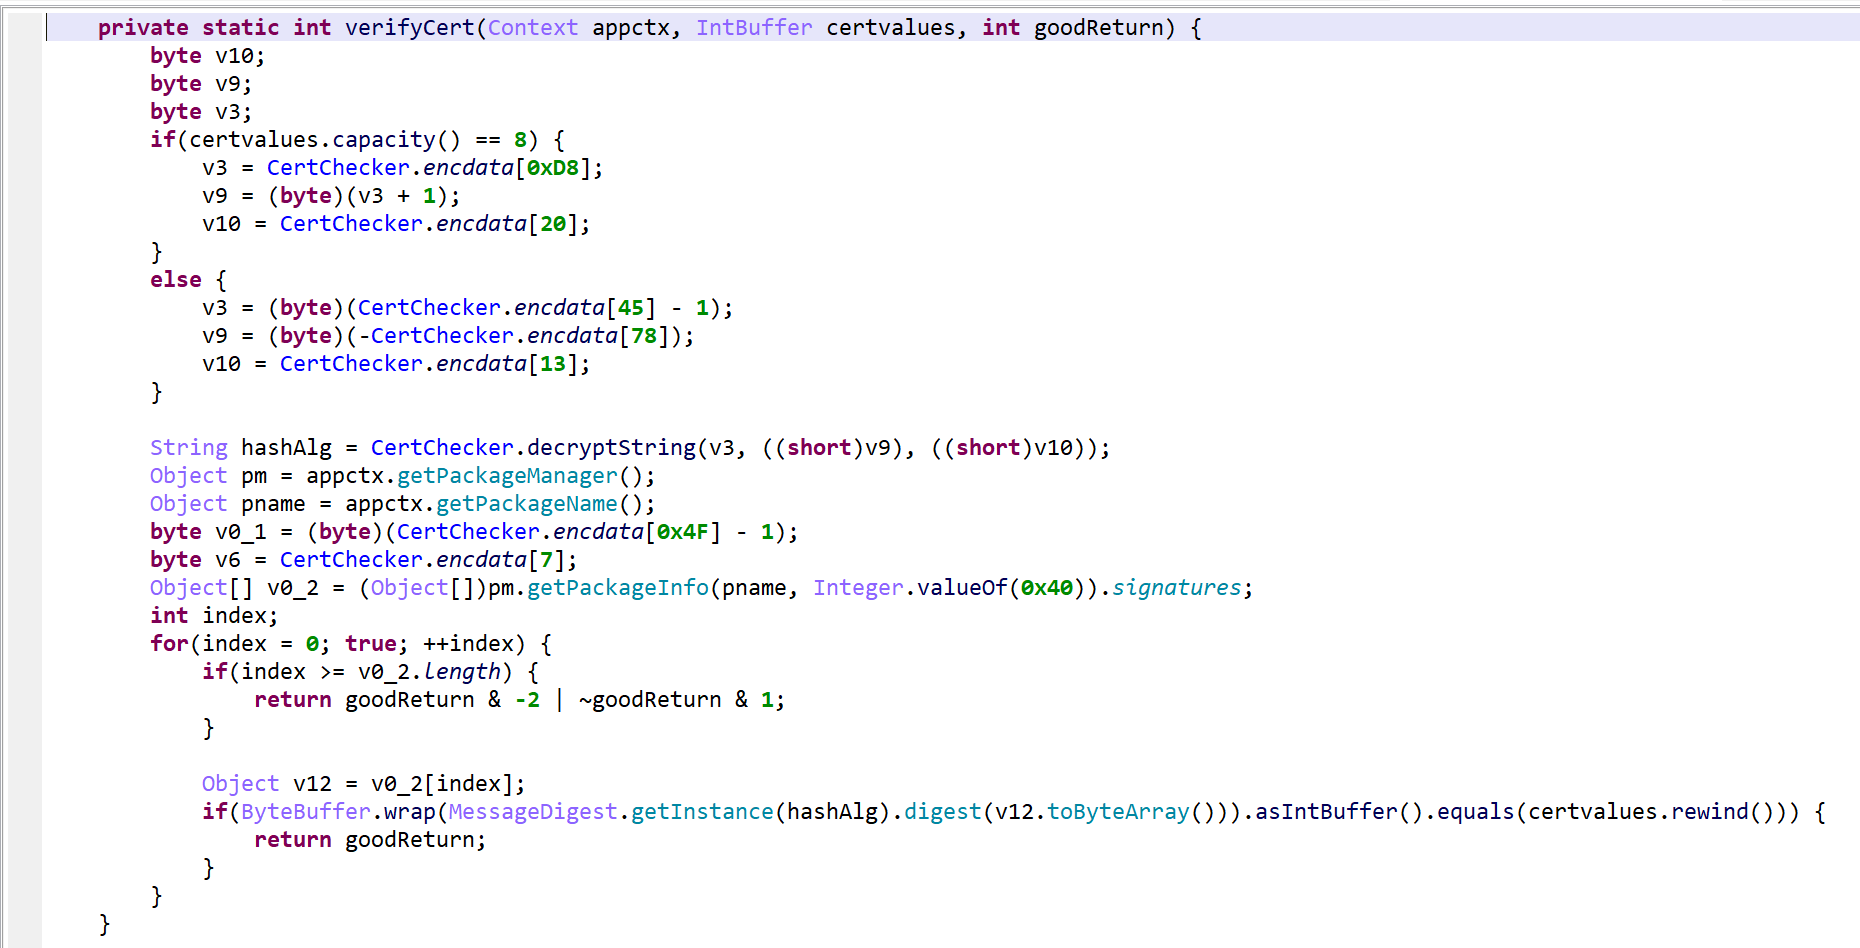
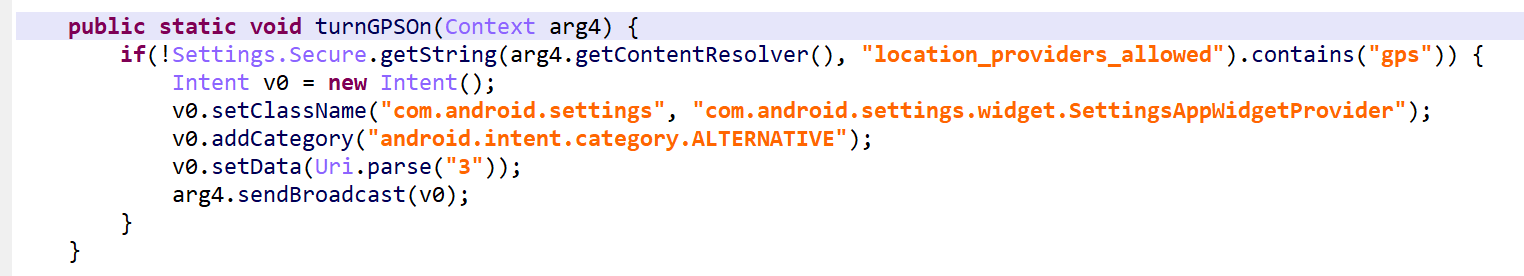
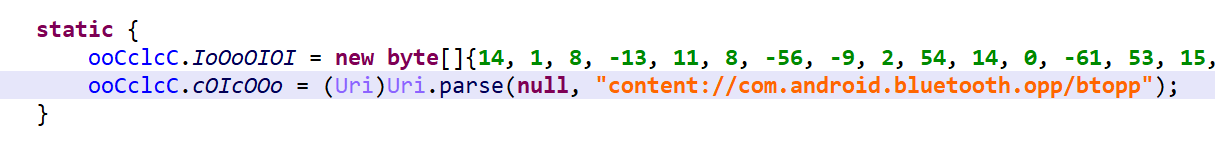
That final output is clean and readable.
Other obfuscation techniques not exposed in this short routine above are arithmetic obfuscation and other operation complexification techniques. JEB will seamlessly deal with many of them. Example:

is optimized to
To summarize bytecode obfuscation:
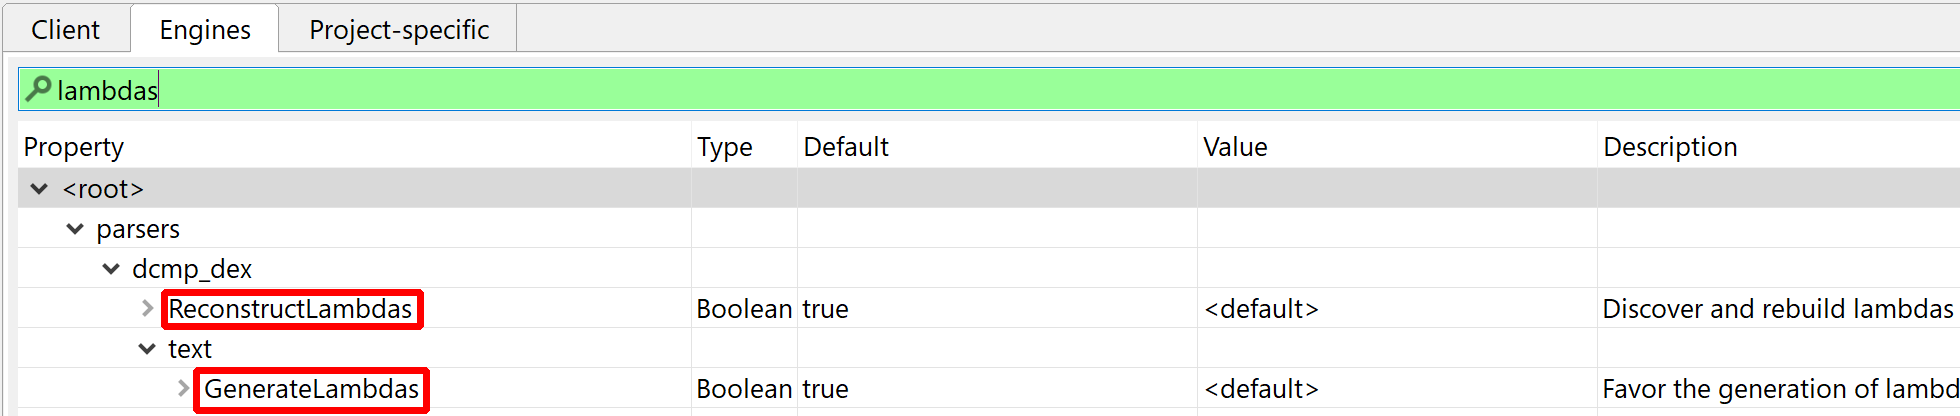
- decryption and unreflection is done automatically 3
- garbage clean-up, code clean-up is also generic and done automatically
- control flow deobfuscation needs a bit of guidance to operate (guard0/guard1 renaming)
Runtime Verification
RASP library routines are used at the developers’ discretion. They consist of a set of classes that the application code can call at any time, to perform tasks such as:
- App signing verification
- Debuggability/debugger detection
- Emulator detection
- Root detection
- Instrumentation toolkits detection
- Certificate pinning
- Manifest check
- Permission checks
The client decides when and where to use them as well as what action should be taken on the results. The code itself is protected, that goes without saying.
App Signing Verification
- Certificate verification uses the PackageManager to retrieve app’s signatures:
PackageManager.getPackageInfo(packageName, GET_SIGNATURES).signatures - The signatures are hashed and compared to caller-provided values in an
IntBufferorLongBuffer.
Debug Detection
Debuggability check
The following checks must pass:
- assert that
Context.ctx.getApplicationInfo().flags & ApplicationInfo.FLAG_DEBUGGABLEis false - check the
ro.debuggableproperty, in two ways to ensure consistency- using
android.os.SystemProperties.get()(private API) - using the
getprop‘s binary
- using
- verify that no hooking framework is detected (see specific section below)
Debugging session check
The following checks must pass:
- assert that
android.os.Debug.isDebuggerConnected()is false - verify no tracer process:
tracerpidentry in/proc/<pid>/statusmust be <= 0 - verify that no hooking framework is detected (see specific section below)
Debug key signing
- enumerate the app’s signatures via
PackageInfo.signatures - use
getSubjectX500Principal()to verify that no certificate has a subject distinguished name (DN) equals to"CN=Android Debug,O=Android,C=US", which is the standard DN for debug certificates generated by the SDK tools
Emulator Detection
Emulator detection is done by checking any of the below.
1) All properties defined in system/build.prop are retrieved, hashed, and matched against a small set of hard-coded hashes:
86701cb958c69d64cd59322dfebacede -> property ???
19385aafbb452f39b5079513f668bbeb -> property ???
24ad686ec83d904347c5a916acbe1779 -> property ???
b8c8255febc6c46a3e43b369225ded3e -> property ???
d76386ddf2c96a9a92fc4bc8f829173c -> property ???
15fed45d5ca405da4e6aa9805daf2fbf -> property ??? (unused)
Unfortunately, we were not able to reverse those hashes back to known property strings – however, it was tried only on AOSP emulator images. If anybody wants to help and run the below on other build.prop files, feel free to let us know what property strings those hashes match to. Here is the hash verification source, to be run be on build.prop files.
2) The following file is readable:
/sys/devices/system/cpu/cpu0/cpufreq/cpuinfo_cur_freq
3) Verify if any of those qemu, genymotion and bluestacks emulator files exist and are readable:
/dev/qemu_pipe
/dev/socket/baseband_genyd
/dev/socket/genyd
/dev/socket/qemud
/sys/qemu_trace
/system/lib/libc_malloc_debug_qemu.so
/dev/bst_gps
/dev/bst_time
/dev/socket/bstfolderd
/system/lib/libbstfolder_jni.so
4) Check for the presence of wired network interfaces: (via NetworkInterface.getNetworkInterfaces)
eth0
eth1
5) If the app has the permission READ_PHONE_STATE, telephony information is verified, an emulator is detected if any of the below matches (standard emulator image settings):
- "getLine1Number": "15555215554", "15555215556", "15555215558", "15555215560", "15555215562", "15555215564", "15555215566", "15555215568", "15555215570", "15555215572", "15555215574", "15555215576", "15555215578", "15555215580", "15555215582", "15555215584"
- "getNetworkOperatorName": "android"
- "getSimSerialNumber": "89014103211118510720"
- "getSubscriberId": "310260000000000"
- "getDeviceId": "000000000000000", "e21833235b6eef10", "012345678912345"
6) /proc checks:
/proc/ioports: entry "0ff :" (unknown port, likely used by some emulators)
/proc/self/maps: entry "gralloc.goldfish.so" (GF: older emulator kernel name)
7) Property checks (done in multiple ways with a consistency checks, as explained earlier), failed if any entry is found and start with one of the provided values:
- "ro.product.manufacturer": "Genymotion", "unknown", "chromium"
- "ro.product.device": "vbox86p", "generic", "generic_x86", "generic_x86_64"
- "ro.product.model": "sdk", "emulator", "App Runtime for Chrome", "Android SDK built for x86", "Android SDK built for x86_64"
- "ro.hardware": "goldfish", "vbox86", "ranchu"
- "ro.product.brand": "generic", "chromium"
- "ro.kernel.qemu": "1"
- "ro.secure": "0"
- "ro.build.product": "sdk", "vbox86p", "full_x86", "generic_x86", "generic_x86_64"
- "ro.build.fingerprint": "generic/sdk/generic", "generic_x86/sdk_x86/generic_x86", "generic/google_sdk/generic", "generic/vbox86p/vbox86p", "google/sdk_gphone_x86/generic_x86"
- "ro.bootloader": "unknown"
- "ro.bootimage.build.fingerprint": "Android-x86"
- "ro.build.display.id": "test-"
- "init.svc.qemu-props" (any value)
- "qemu.hw.mainkeys" (any value)
- "qemu.sf.fake_camera" (any value)
- "qemu.sf.lcd_density" (any value)
- "ro.kernel.android.qemud" (any value)
Hooking Systems Detection
The term covers a wide range of techniques designed to intercept regular control flow in order to examine and/or modify execution.
1) Xposed instrumentation framework detection, by attempting to load any of the classes:
de.robv.android.xposed.XposedBridge
de.robv.android.xposed.XC_MethodHook
Class loading is done in different ways in an attempt to circumvent hooking itself, using Class.forName with a variety of class loaders, custom class loaders and ClassLoader.getLoadedClass, as well as lower-level private methods, such as Class.classForName.
2) Cydia Substrate instrumentation framework detection.
3) ADBI (Android Dynamic Binary Instrumentation) detection
4) Stack frame verification: an exception is generated in order to retrieve a stack frame. The callers are hashed and compared to an expected hard-coded value.
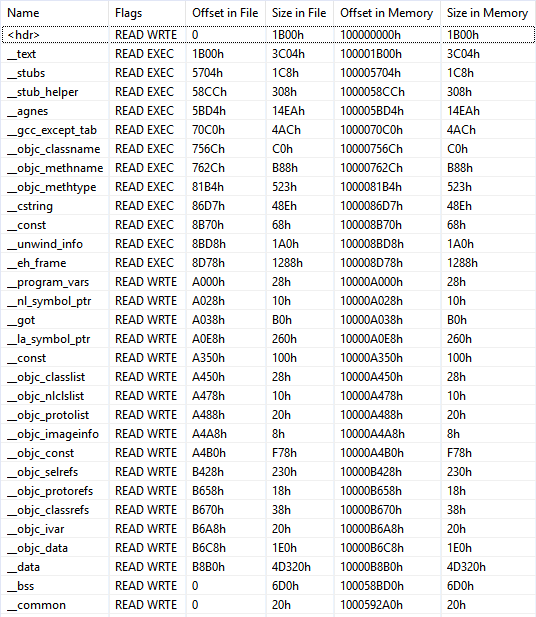
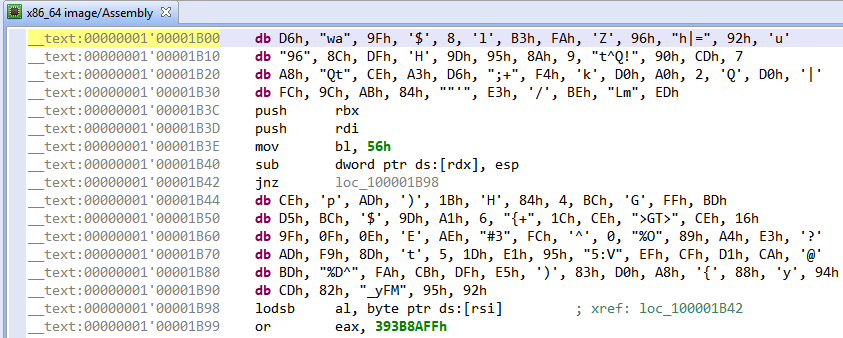
5) Native code checks. This will be detailed in another blog, if time allows.
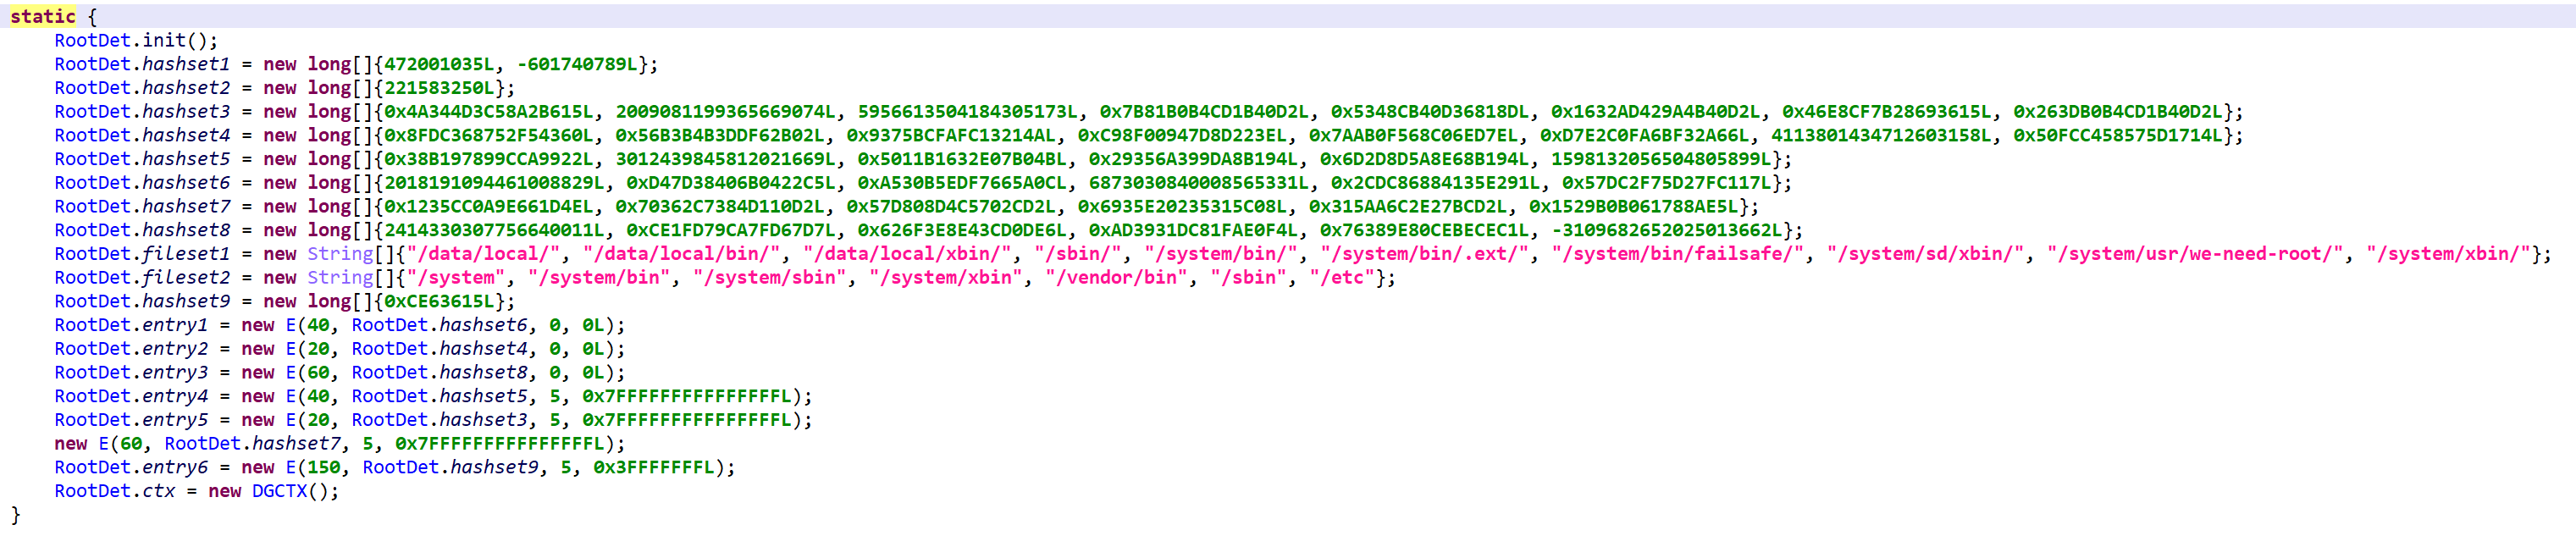
Root Detection
While root detection overlaps with most of the above, it is still another layer of security a determined attacker would have to jump over (or walk around) in order to get protected apps to run on unusual systems. Checks are plenty, and as is the case for all the code described here, heavily obfuscated. If you are analyzing such files, keeping the Deobfuscators enabled and providing guard0/guard1 hints is key to a smooth analysis.
Build.prop checks. As was described in emulator detection.
su execution. Attempt to execute su, and verify whether su -c id == root
su presence. su is looked up in the following locations:
/data/local/
/data/local/bin/
/data/local/xbin/
/sbin/
/system/bin/
/system/bin/.ext/
/system/bin/failsafe/
/system/sd/xbin/
/system/usr/we-need-root/
/system/xbin/
Magisk detection through mount. Check whether mount can be executed and contains databases/su.db (indicative of Magisk) or whether /proc/mounts contains references to databases/su.db.
Read-only system partitions. Check if any system partition is mounted as read-write (when it should be read-only). The result of mount is examined for any of the following entries marked rw:
/system
/system/bin
/system/sbin
/system/xbin
/vendor/bin
/sbin
/etc
Verify installed apps in the hope of finding one whose package name hashes to the hard-coded value:
0x9E6AE9309DBE9ECFL
Unfortunately, that value was not reversed, let us know if you find which package name generates this hash – see the algorithm below:
    public static long hashstring(String str) {
        long h = 0L;
        for(int i = 0; i < str.length(); i++) {
            int c = str.charAt(i);
            h = h << 5 ^ (0xFFFFFFFFF8000000L & h) >> 27 ^ ((long)c);
        }
        return h;
    }
NOTE: App enumeration is performed in two ways to maximize chances of evading partial hooks.
- Straightforward:
PackageManager.getInstalledApplications - More convoluted: iterate over all known
MAINintents:PackageManager.queryIntentActivities(new Intent("android.intent.action.MAIN")), derive the package name from the intent viaResolveInfo.activityInfo.packageName
SElinux verification. If the file /sys/fs/selinux/policy cannot be read, the check immediately passes. If it is readable, the policy is examined and hints indicative of a rooted device are looked for by hash comparison:
472001035L
-601740789L
The hashing algorithm is extremely simple, see below. For each byte of the file, the crc is updated and compared to hard-coded values.
long h = 0L;
//for each byte:
    h = (h << 5 ^ ((long)(((char)b)))) & 0x3FFFFFFFL;
    // check h against known list
Running processes checks. All running processes and their command-lines are enumerated and hashed, and specific values are indirectly looked up by comparing against hard-coded lists.
APK Check
This verifier parses compressed entries in the APK (zip) file and compares them against well-known, hard-coded CRC values.
Manifest Check
Consistency checks on the application Manifest consists of enumerating the entries using two different ways and comparing results. Discrepancies are reported.
- Open the archive’s MANIFEST.MF file via
Context.getAssets(), parse manually - Use
JarFile(Context.getPackageCodePath()).getManifest().getEntries()
Discrepancies in the Manifest could indicate system hooks attempting to conceal files added to the application.
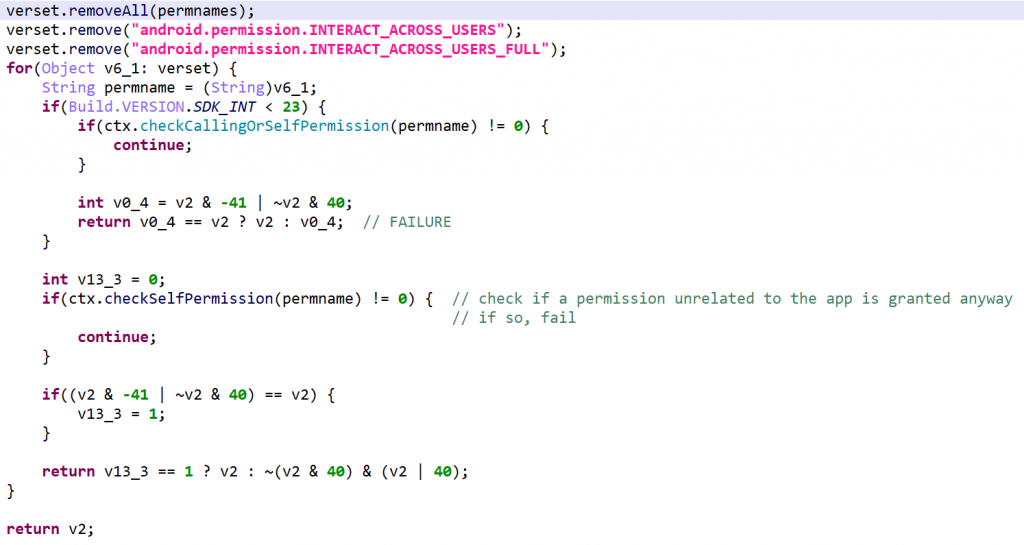
Permissions Check
This routine checks for permission discrepancies between what’s declared by the app and what the system grant the app.
- Set A: App permission gathering: all permissions requested and defined by the app, as well as all permissions offered by the system, plus the
INTERACT_ACROSS_USERSandINTERACT_ACROSS_USERS_FULLpermissions, - Set B: Retrieve all permissions that exist on the system
- Define set C = B – A
- For every permission in C, use
checkCallingOrSelfPermission(API 22-) orcheckSelfPermission(API 23+) to verify that the permission is not granted.
Permission discrepancies could be used to find out system hooks or unorthodox execution environments.
Miscellaneous
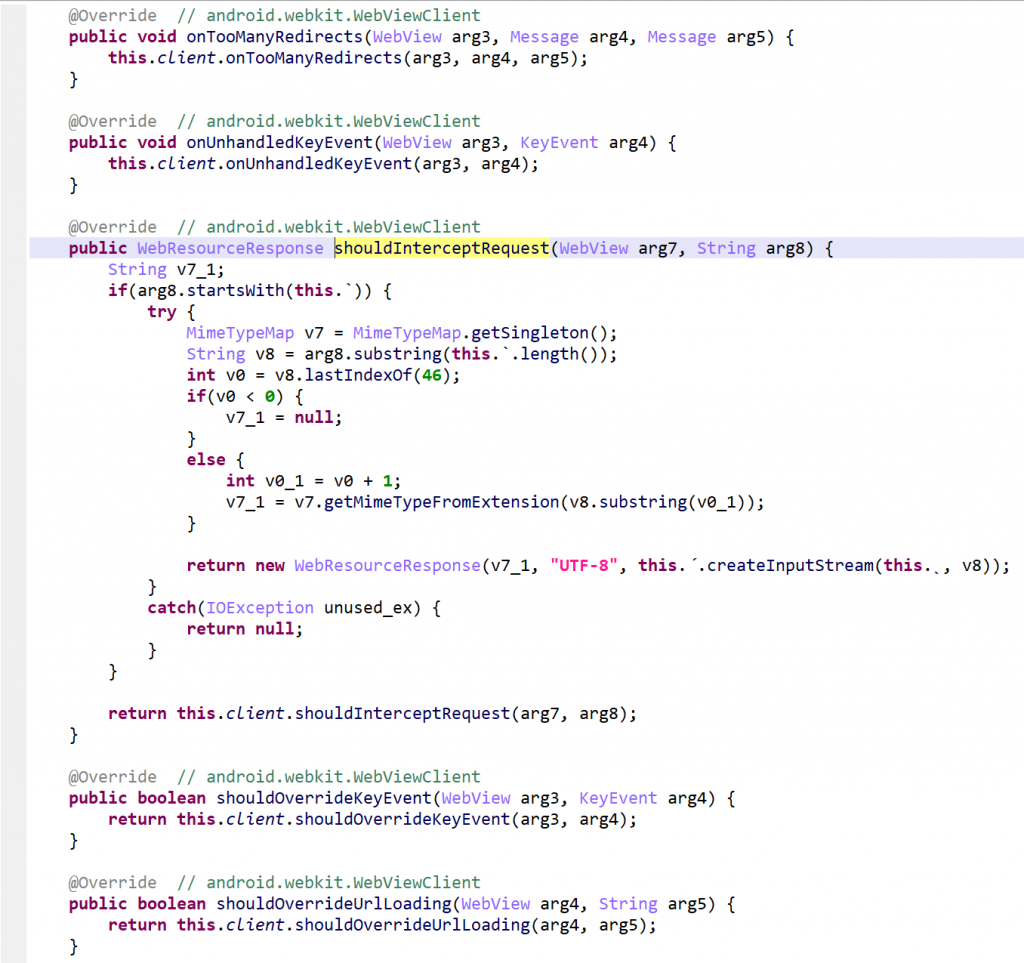
Other runtime components include library code to perform SSL certificate pinning, as well as obfuscated wrappers around web view clients. None of those are of particular interest.
Conclusion
That’s it for the obfuscation and runtime protection facility. Key take-away to analyze such protected code:
- Keep the obfuscators enabled
- Locate the opaque integers, rename them to guard0/guard1 to give JEB a hint on where control flow deobfuscation should be performed, and redecompile the class
The second part in the series presents bytecode encryption and assets encryption.
- VM in VM, repeat ad nauseam – something not new to code protection systems, it’s existed on x86 for more than a decade, but new on Android, and other players in this field, commercial and otherwise, seem to be implementing similar solutions. ↩
- So-called “RASP”, a relatively new acronym for Runtime Application Self-Protection ↩
- Decryption and unreflection are generic processes of dexdec (the DEX Decompiler plugin); there is nothing specific to this protector here. The vast majority or encrypted data, regardless of the protection system in place, will be decrypted. ↩