As the latest update makes its way to all users (changelog), it is a good time to quickly recap additions related to Android analysis that made it into JEB versions 3.1.4, 3.1.5, and 3.2.
Dalvik Decompiler Updates
The newest releases of JEB contain several improvements to the Dalvik decompiler. I will highlight only a couple that users may find interesting. 1
Enumerations
Compiled Java enumerations can be complicated beasts. JEB attempts to re-sugar them to the best of its ability. On failure, regular classes extending java.lang.Enum will be rendered.
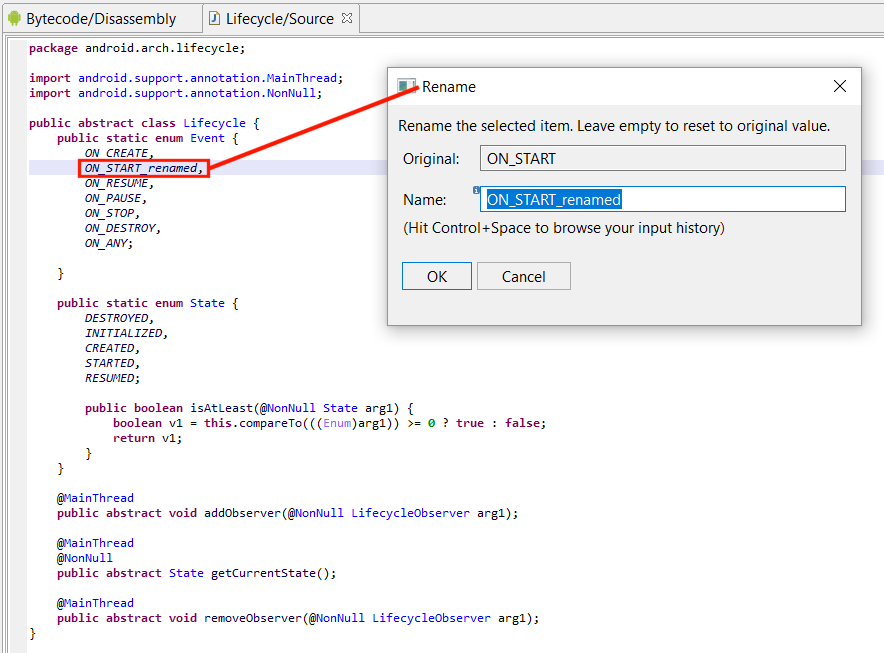
Obfuscation sometimes destroy important synthetic fields and structures that allow recovery heuristics to work. However, support should function reasonably well, even on enumeration data that was intentionally shuffled to generate decompilation errors. Moreover, and to keep with the spirit of interactivity in JEB, enumerated fields can be renamed – and it is done consistently over the code base, including over reconstructed switches making use of such enums.
Decompiled enums in android.arch.lifecycle. Renaming and cross-referencing enumerated constants is supported.
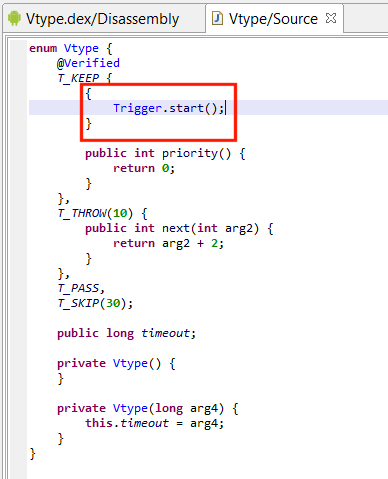
Custom enumerated constants are also properly reconstructed, including:
Field annotations
Custom initializers (see below)
Additional methods and method overrides
In this complex enumeration, the red block shows a custom initializer. Other interesting bits are the use of overrides and custom methods, annotations, as well as default and non-default constructors.
Switches
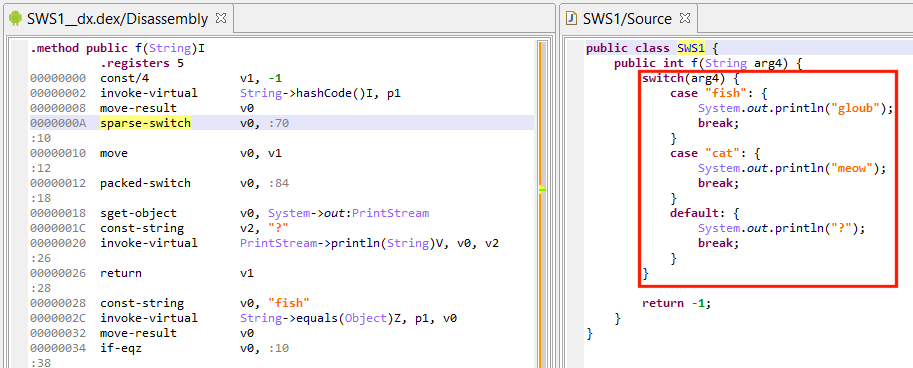
Support was recently added for switch-on-enum and switch-on-string (partial support for the latter, to be continued in the next software update).
This successfully reconstructed switch-on-string is implemented as a double-switch idiom by dx (a sparse switch on hashCode/equals to generate custom indices i, followed by a packed-switch on i). Not all switches are implemented like this. Regular if-conditional trees may be strategically generated by optimizing compilers.
Inner classes, Anonymous classes
We improved rendering support for named- and anonymous-inner classes. Properly rendering anonymous classes in particular is made difficult by the fact that some of its arguments are captured from the outer classes. Properly rendering anonymous constructors, with exact argument types and position, is also challenging.
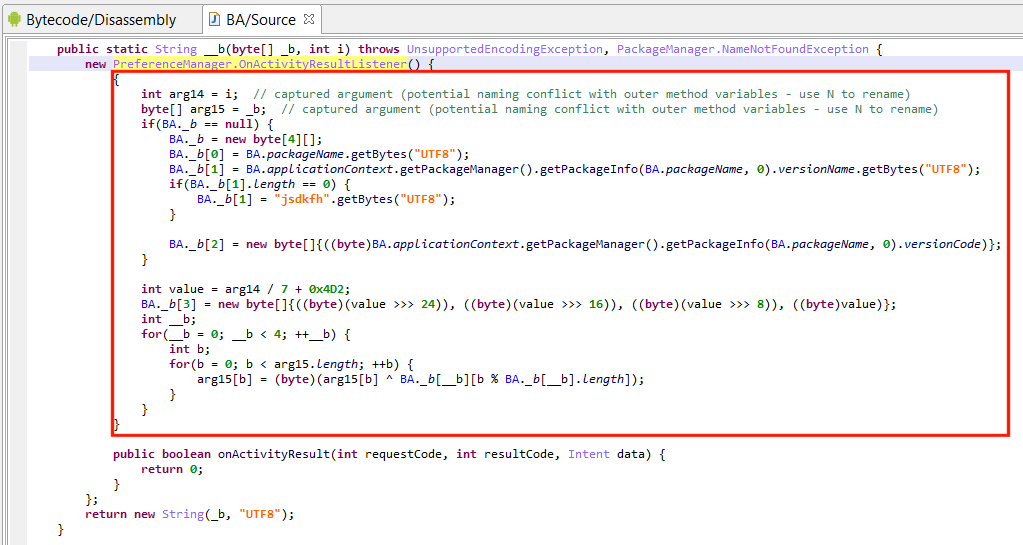
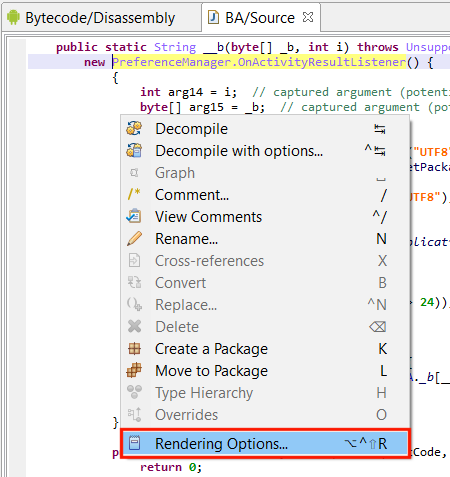
Lately, a user sent us a sample making use of an anonymous class initializer to hide string decryption code. See below:
The anonymous class extends Android’s OnActivityResultListener, instantiates the object, and tosses it immediately.
Decryption code takes place in the initializer. Note the captured arguments from the outer container method __m: i, _b. Access to other private class fields is made via synthetic accessor calls that were re-sugared into seemingly direct field access (BA._b).
Pseudo-moot anonymous class with an instance initializer attempting to conceal string decryption code.
Plugin options
Remember that some decompiler properties are publicly available in the options: (menu: Edit, Options, Advanced, Engines)
All Dalvik decompilation options: see the .parsers.dcmp_dex.* namespace
All Java rendering options of decompiled code: see the .parsers.dcmp_dex.text.* namespace
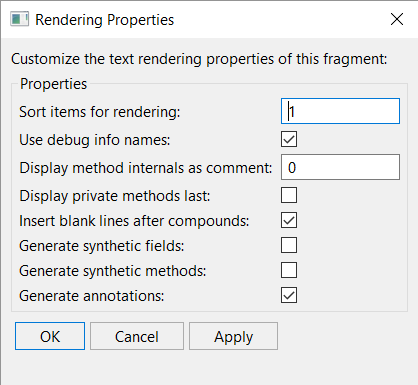
1)Rendering options are real-time options that can be changed after the fact to customize the output. Right-click on a decompiled class output, and select Rendering Options:
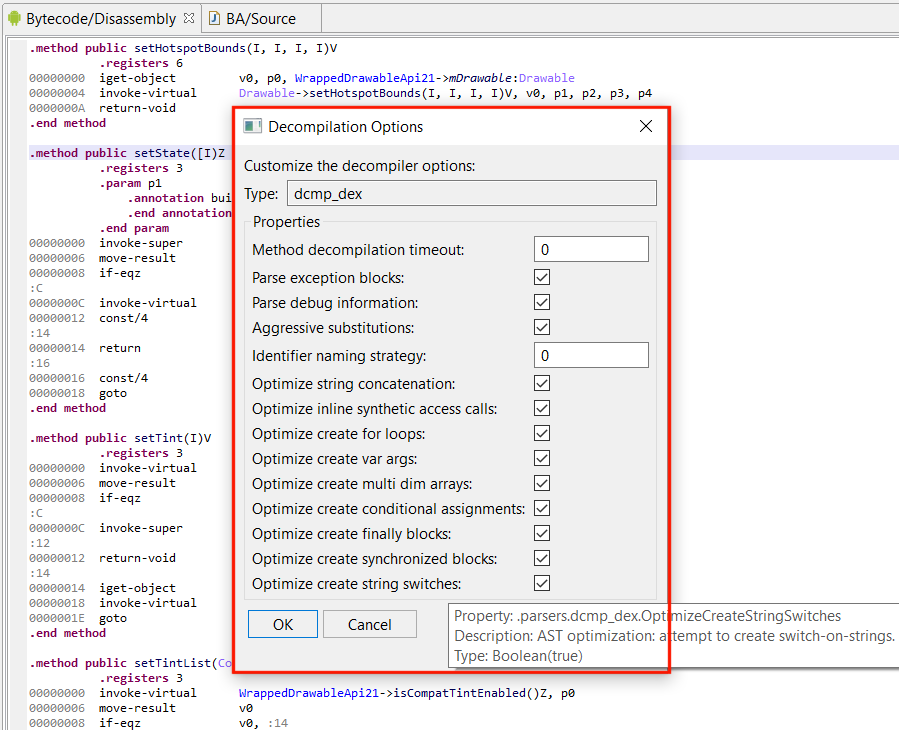
2) Decompilation options are used to guide and customize the decompilation. They can be changed in the Engines options, or more simply, when performing a decompilation itself, by invoking “Decompile with Options…” instead of “Decompile”.
Keyword for “Decompile with Options”: CTRL+TAB (Windows, Linux) or COMMAND+TAB (macOS)
Bring up the “Decompile with Options” dialog by using CTRL+TAB/COMMAND+TAB when decompiling. Hover over properties to get extra documentation in the tooltip.
API additions
Essential updates to:
IJavaSwitch: additional methods to access switch-on-enum and switch-on-string data
IJavaForEach: additional type introduced to manipulate for-each statements: for(Type var: iterator_or_array) { … }
Other changes, What next
JEB 3.2 contains other improvements, such as:
Better auto-naming, including default usage of debug data, if present (can be disabled in the options)
Improved typing and type propagation
Additional IR and AST optimizations
Better exceptional flow processing
Rendering of try-catch, synchronized blocks, etc.
Decompilation of invoke-polymorphic (invoke-custom is not supported, see below the part on lambdas on method handles)
We have more planned for the coming releases, including:
Improved support for switch-on-string. As said earlier, some of those switches, when properly detected, are re-sugared into legal Java-8 switch-on-string. However, the nature of those high-level constructs (they are implemented as double-conditionals, sometimes double-switches) makes it quite hard in some cases to provide proper reconstruction. It is something that will be improved in the future.
Support for generics. We had decided to not implement Java 5-style type generic since the information, when provided, is stored as pure metadata and should not be trusted. However, in practice, it turns out to be helpful when auditing legitimate, non-obfuscated compiled apps. We will add optional support for that in a coming release.
Support for try-with-resources.try(resource)/catch/finally are difficult very-high-level idioms to reconstruct. Optimizing compilers generate a substantial amount of additional, highly optimized code to implicitly catch exceptions and auto-close resources, making it extra difficult to reconstruct in the general case. We will likely introduce partial support before the summer.
Lambdas. It is a planned addition. We will soon be re-sugaring Android implementations of Java 8+ lambdas into proper lambda functions. Same goes for method handles (::). That’s quite exciting and may pave the way for a hypothetical Kotlin decompiler, since that language implicitly and explicitly rely on lambdas extensively.
Debuggable APK Generation
For several reasons, it is easier to debug Android applications explicitly marked debuggable in their Manifest.
Debugging non-debuggable APK requires root access to the operating system. Which means rooting a production phone, using an emulator 2 image built as userdebug, or building a custom userdebug image from AOSP.
Any of the above solutions have shortcomings: rooted production builds and userdebug builds expose features that non-rooted production builds do not have, and can be fingerprinted as such; Debugging native code of applications on non-rooted devices requires replacing system-level utilities; the API level and OS features also play a role, eg, SE-Android needs to be disabled on recent OS in order for debugging to work.
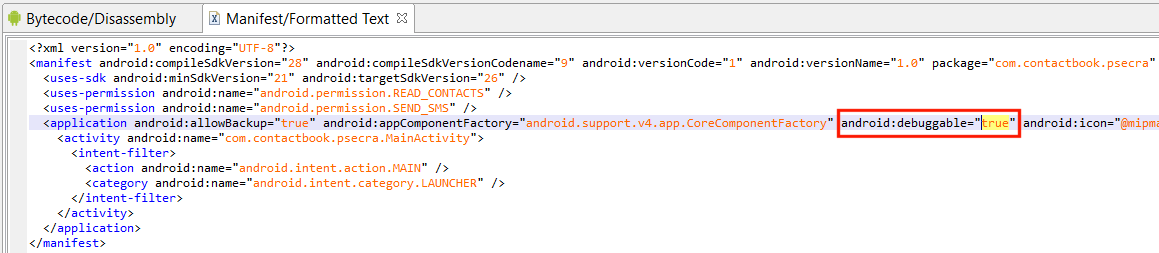
In many cases, rebuilding a release app into a debug-mode app (with <application android:debuggable=”true” …>) is a viable solution, and one that does not require using root, obviously. Many users are implementing this solution via apktool. However it is frequent for the tool to fail decoding complex APKs, let alone rebuild them with different settings.
We have introduced a feature in JEB that makes rebuilding non-debuggable APK to debuggable APK easy and fast:
$ jeb_wincon.bat -c --makeapkdebug -- file.apk
Upon success, file_debuggable.apk will be generated. Sign it (Android SDK’s apksigner), install it on your device, and start debugging. Remember that this solution has its shortcomings as well! Anti-debugging code may check at runtime that the app is not debuggable, as would be expected. More elaborate solutions implement certificate pinning-style checks, where the code verifies that it is signed using a specific certificate. Be careful when debugging rebuilt APK.
This malware app was made debuggable
Keyboard Shortcuts for Script
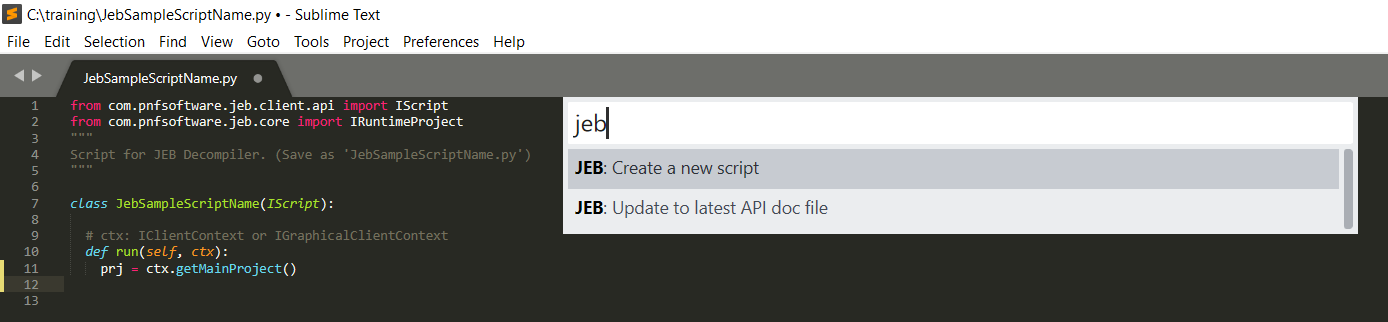
Bind your JEB Python scripts to keyboard shortcut by adding a line at the top of your script:
#?shortcut=xxx
where xxx is your keyboard shortcut, eg: Ctrl+Shift+T
Permitted keyboard modifiers are Ctrl, Shift, Alt, as well as the generic Mod1, mapping to macOS’s Command (Apple) key, or Control on Windows/Linux.
Sublime Text 3 Extension
Are you writing Python scripts to automate your JEB reversing tasks? If so, give a try to using the “JEB Script Development Helper” package available on Sublime Text’s Package Control.
Update (Nov 29): the plugin was open-sourced on our GitHub repository. JEB 3.0.7+ is required to load and run it.
Java applications can call native methods stored in dynamic libraries via the Java Native Interface (JNI) framework. Android apps can do the same: developers can use the NDK to write their own .so library to use and distribute.
In this post, we briefly present how the binding mechanisms work, allowing a piece of bytecode to invoke native code routines.
Named Convention Method
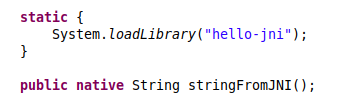
The easiest way to call native method is as such:
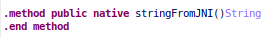
In Java, class com.example.hellojni.HelloJni:
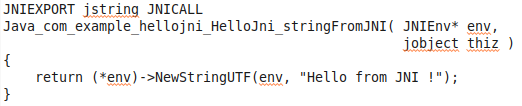
In C:
The native method name adheres to the standard JNI naming convention, allowing automatic resolution and binding.
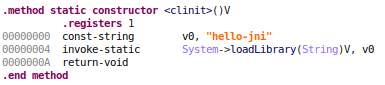
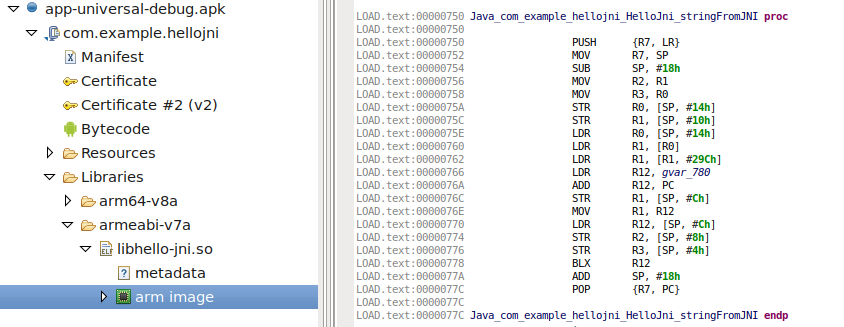
The corresponding Dalvik bytecode is:
and here are the the corresponding ARM instructions:
JEB automatically binds those methods together, to allow easy debugging from bytecode to native code.
However, there is another way to bind native code to Java.
Dynamic JNI Method
One can decide to bind any function to Java without adhering to the naming convention, by using the JNIEnv->RegisterNatives method.
For example, the following line of code dynamically binds the Java method add(II)I to the native method add():
Due to its dynamic nature, statically resolving those bindings can prove difficult in practice, e.g. if names were removed or mangled, or if the code is obfuscated. Therefore, not all calls to RegisterNatives may be found and/or successfully processed.
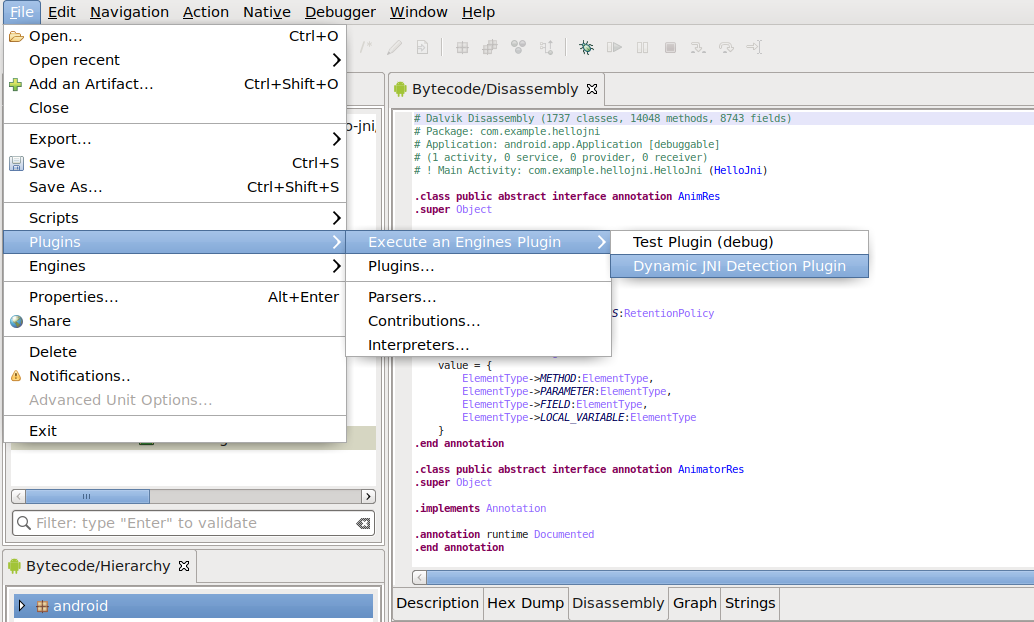
However, JEB 3.0-beta.2 (to be released this week) ships with an EnginesPlugin to heuristically detect – some of – these methods, and perform binding – and of course, you will also be able to debug into them.
Execute the plugin via the File, Plugins menu
Once run, it will :
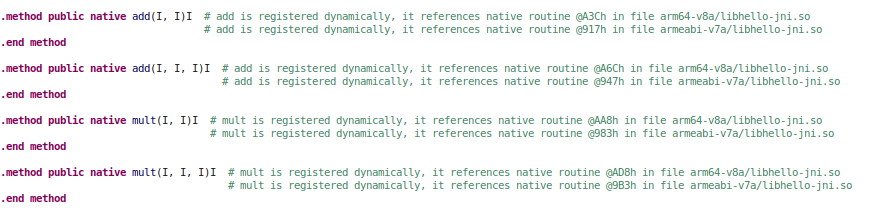
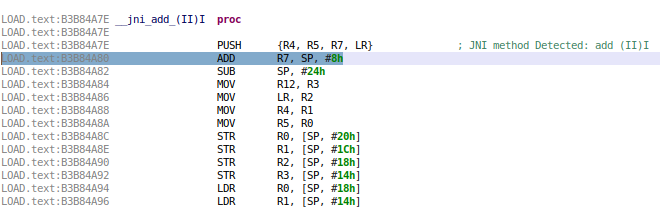
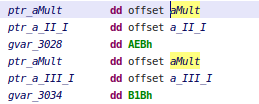
annotate the dex code with the target addresses:
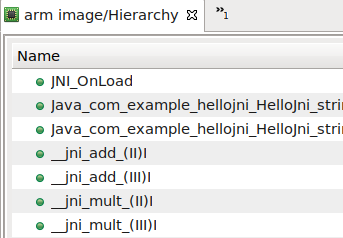
rename targets (prefixing names with __jni_) :
enable you to seamlessly debug into them (jump from Java to this JNI method)
Heuristics
As of this writing, the plugin uses several heuristics, implemented for ARM and ARM64 (Aarch64):
The first is the simplest one: the JNIEnv->RegisterNatives method is commonly called from the standard JNI initialization function JNI_OnLoad, so JEB searches for this method and attempt to find calls to RegisterNatives.
Once the ‘BL RegisterNatives‘ is found, JEB uses the decompiler to create an IR representation of the block, and determines the values of R2 and R3 (X2 and X3 on Aarch64). R3 indicates the number of native methods to register, R2 is a pointer to the array of JNI native methods (structure with a pointer to method name, a pointer to method signature and a pointer to the native function bound):
Even if accurate, this method does not work when a Branch is issued via a register (BL R4) or method name is hidden.
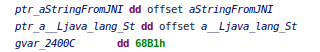
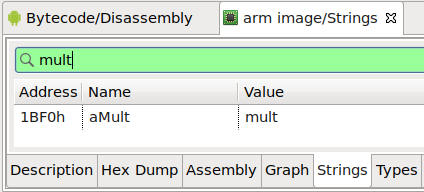
The second heuristic is based on method name. First, in Dalvik, we search for all invocations to native methods. Then, for each method found, we search in binaries if there is a String reference matching the method name. (This heuristic is dangerous but yields decent results. A future plugin update may allow users to disable it.)
If found, the plugin looks at cross references of this String and checks if it looks like the expected JNI structure.
The third and last heuristic is the same as the previous one, but based on arguments. Since names can be shortened, they may not be interpreted as String, and thus not referenced, whereas it is easier to find argument signatures.
These three heuristics only work when methods are defined as a static array variable. Dynamic variables would need some emulation of the JNI_OnLoad method to be resolved.
As you can see, detection is currently based on heuristics, so obfuscated methods may be missing. Feel free to tweak and improve the plugin, it is available on our GitHub repository. As usual, feel free to reach out to us (email, Twitter, Slack) if you have questions or suggestions.
JEB 2.3.11 is out – We’re getting close to completion on our 2.3 branch! 1
Before we get into the matter of this blog post, a couple of noteworthy changes in terms of licensing:
The Android Basic builds require an active Internet connection; however, if the JEB license is current, we allow a much longer grace period before requesting a connection with our licensing server. This is to take care of scenarios where the connectivity would drop for a relatively extended period of time on either end.
Most interestingly, expired licenses of all types may now be used past their expiration date to reload and work on existing JDB2. New projects cannot be created with expired licenses though.
In terms of features, JEB 2.3.11 includes upgrades to our ARM64, MIPS64 and x86-64 parsers 2, as well as fixes and additions to the DEX parser. One interesting update, which prompted writing this blog post, is the support of DEX 39 opcodes.
Version 39 of the DEX format will be supported with the release of Android P 3. DEX 38 had been introduced to support Oreo’s new opcodes related to dynamic programming. We wrote a lengthy post about them on this very blog.
The new instructions const-method-handle and const-method-types are natural additions to retrieve method handles (basically, the same as a function pointer in C, a concept foreign to the JVM until lambdas and functional-style programming made its way into the language) and method prototypes. Those opcodes simply query into the prototypes and handles pools.
In fact, support for those two opcodes was added in JEB months ago, right after their introduction in ART, which dates back to September 2017 (AOSP commit). Now, if you’ve been following through the Dalvik, DEX and ART intricacies, you may know that we are facing opcode overlaps:
The original non-optimized DEX instruction set spans from 0 to 0xFF, with undefined ranges (inclusive brackets omitted for clarity): 3E-43, 73, 79-7A, E3-FF
DEX 38 defines the range FA-FD (4x new invoke-xxx)
DEX 39 defines the range FE-FE for the aforementioned new opcodes (2x new const-method-xxx)
The now defunct optimized DEX (ODEX) set, predating ART, used the reserved sub-range E3-FE
The deadborn extended set used FF as an extension code to address 2-byte opcodes (FFxx); they were defined but unimplemented in Ice Cream Sandwich, and removed soon after in Jelly Bean.
Finally, ART opcodes: also used for optimizing DEX execution, those opcodes use the 73 and E3-FF ranges
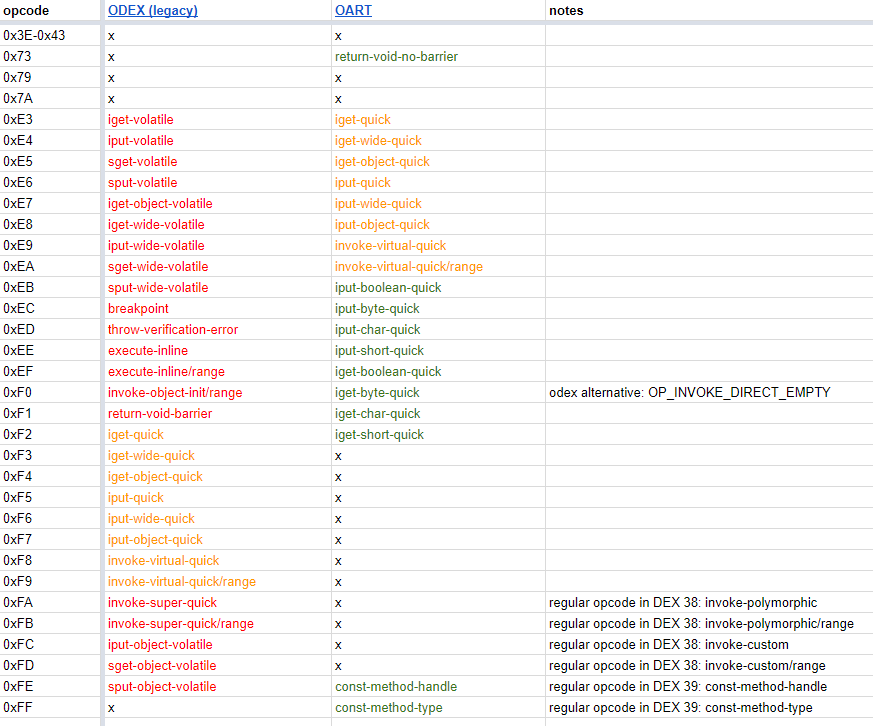
ART opcodes in E3-FE are not necessarily the same as the original ODEX’s! The following table recaps the differences between ODEX and OART:
legend: red= removed in ART, orange= moved, green= added in ART
When you feed a piece of optimized DEX file to JEB, it may not know which instruction set to use. Normally, the following rules apply:
For stand-alone (within or outside an APK) DEX files advertising a version code less than or equal to 37, the legacy ODEX set would be used if any opcodes within that range are encountered;
For DEX files with version 38 or above, or that are part of an OAT ELF file, the newer ART set will be used.
However, if the determination is incorrect (eg, you are opening a stand-alone DEX 37 file using ART opcodes), you may manually specify which optimized opcodes set the Dalvik parser should use by opening the project’s settings (Edit/Options, Advanced…), and setting the property DalvikParserMode4 to:
0: legacy DEX (default value)
50: ART
100: DEX 38
110: DEX 39
1000: latest
That’s it for today’s DEX clarifications. Remember to upgrade to JEB 2.3.11. On a side-note, let us know if you’d like to be part of our group of early testers: those users receive beta builds ahead of time (eg, JEB 2.3.12-beta this week).
Thank you.
—
A couple more updates are in the pipe before we start publishing betas of JEB 3. ↩
The x86 modules now support the newest AVX-512 instruction set, although we do not decompile it ↩
Per Google’s habits, we may expect a beta of Android P with API level 28 this Spring ↩
That property is not as accessible as we’d like; an upcoming update will clarify and improve the UX around that. ↩
The latest JEB release ships with our all-new Android resources (ARSC) decoder, designed to reliably handle tweaked, obfuscated, and sometimes malformed resource files.
As it appears that optimizing resources for space (eg, the WeChat team has made their compressor/refactoring module publicly available, etc.) or complexity (eg, commercial app protectors have been doing it for some time now) is becoming more and more commonplace, we hope that our users will come to appreciate this new module.
Here are the key points, followed by examples of what to expect from the new module.
ARSC Decoder Workflow
In terms of workflow, nothing changes: starting with JEB 2.3.10, the new Android Resources decoder module is enable by default.
If you ever need to switch back to the legacy module, simply open the Options, Advanced panel, filter on AndroidResourcesDecoderSelector and set the value to 1 (instead of 2).
ARSC Decoder Output
In terms of output, users should see improvements in at least three areas:
First, the module can deal with obfuscated resources and malformed files better, resulting in lower failure rates. Ideally, we’d like to get as close as possible to a 0-failure, so please report issues!
Second, flattened, renamed, or generally refactored resources are handled as well, and the original res/ folder will be reconstructed, resulting in a readable Resources sub-tree.
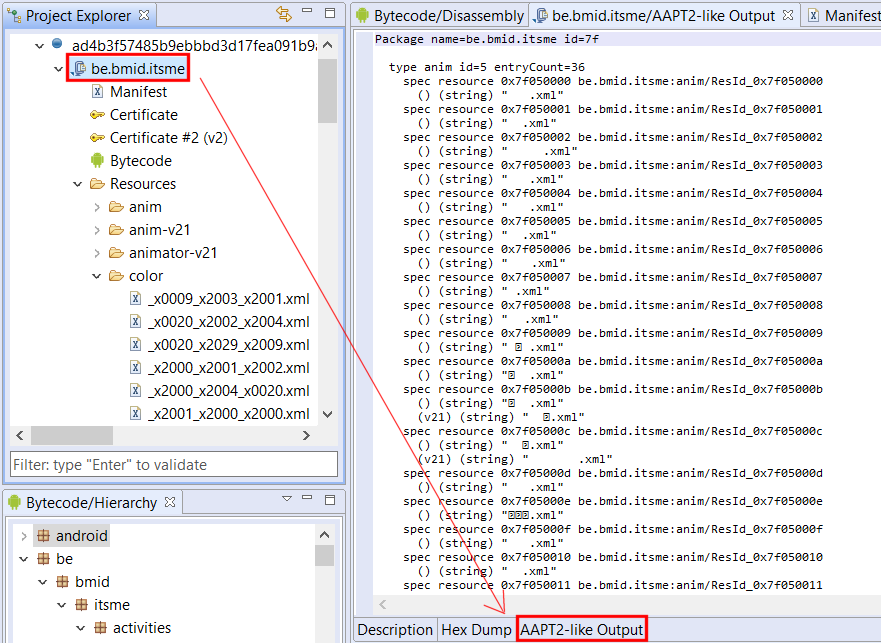
Finally, the module can generate an aapt2-like text output to cope with the limitations of AOSP’s aapt/aapt2 (eg, crashes); the output can be quite large, so currently, aapt2-like output generation is disabled by default. To enable it, go to the Options, Advanced panel, filter on AndroidResourcesGenerateAapt2LikeOutput and set the value to true. The output will be visible as an additional fragment of the APK unit view:
aapt2-like output on a file that failed aapt2
Additional Input (APK Frameworks)
By default, the latest Android framework (currently API 27) is dropped by JEB in [HOME_FOLDER]/.jeb-android-frameworks/1.apk.
If an app you are analyzing requires additional framework libraries, drop them as [package_id].apk in that folder, and you should be good to go.
Example 1: flattened resources in a banking app
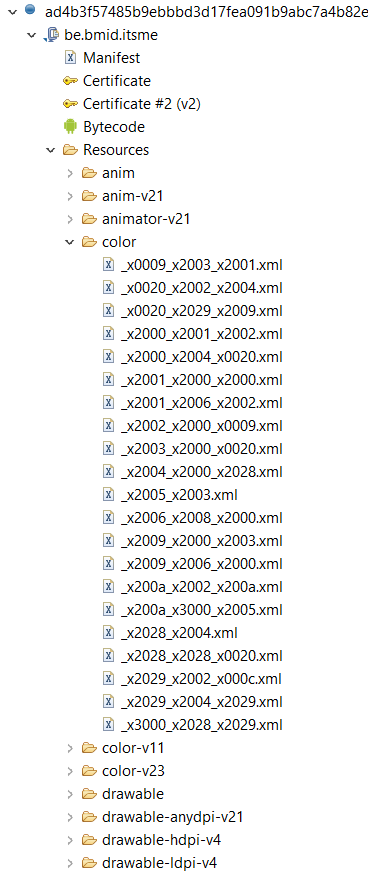
Here’s a sample that demonstrates what the output looks like with an app found on VirusTotal. The app is called itsme, the apk is protected by resources refactoring (res/ folder flattening) and trimming (renaming of files, name-less resource objects, etc.).
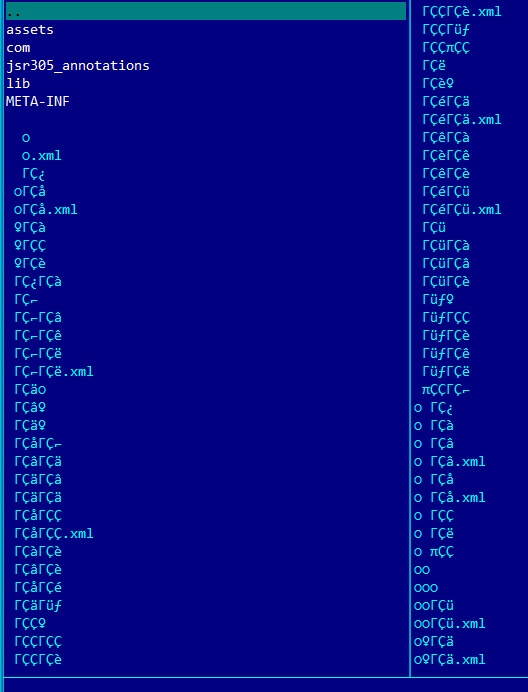
Have a look at the APK contents:
Protected app contents
aapt2 fails on it (resource id overlap):
error: trying to add resource 'be.bmid.itsme:attr/' with ID 0x7f010001 but resource already has ID 0x7f010000.
apktool 2.3.1 cannot reconstruct the resource tree either. Resources are moved to an unknown/ folder; on non-Linux system, resources manipulation also fail due to illegal character names.
JEB does its best to rebuild the resources tree, and renames illegally named resources as well across the Resources base, consistently:
A rebuilt resources tree, originally obfuscated by GuardSquare (?)
Example 2: tweaked xml
The second file is a version of the Xapo Bitcoin wallet app 1, also found on VirusTotal. This app does not fail aapt2, however, it does fail other tools, including apktool 2.3.1
I: Using Apktool 2.3.1 on 96cbabe2fb11c78a283348b2f759dc742f18368e0d65c5d0a15aefb4e0bdc645
I: Loading resource table...
I: Decoding AndroidManifest.xml with resources...
I: Loading resource table from file: [...]/1.apk
Exception in thread "main" java.lang.ArrayIndexOutOfBoundsException: 8601
The resources are flattened and renamed; the XML resources are oddly structured and stretch the XML specifications as well.
JEB handles things smoothly.
Conclusion
There are many more examples of “stretched” resources in APKs we’ve come across, however we cannot share them at the moment.
If you come across unsupported scenarios or bugs, feel free to issue a report, we’ll happily investigate and update the module.
This post highlights changes and additions related to Android app processing that shipped with JEB 2.3.5 (and the upcoming 2.3.6 release). Per usual, consult the full changelog for a complete list of changes.
Contributions for Units
We added plugin support for unit contributions. These back-end extensions can be written in Python! Practically, contributions for text documents (eg, disassembly) take the form of pop-ups when the user hovers the mouse over a text item. Several JEB modules already ship with contributions, eg the Live Registers view of the jdb/gdb/lldb debbuggers plugins.
With JEB 2.3.6, users may write their own contribution in Java or Python. They extend the IUnitContribution interface and are fairly straightforward to implement. (We will upload an example of a cross-unit contribution written in Python on GitHub shortly.)
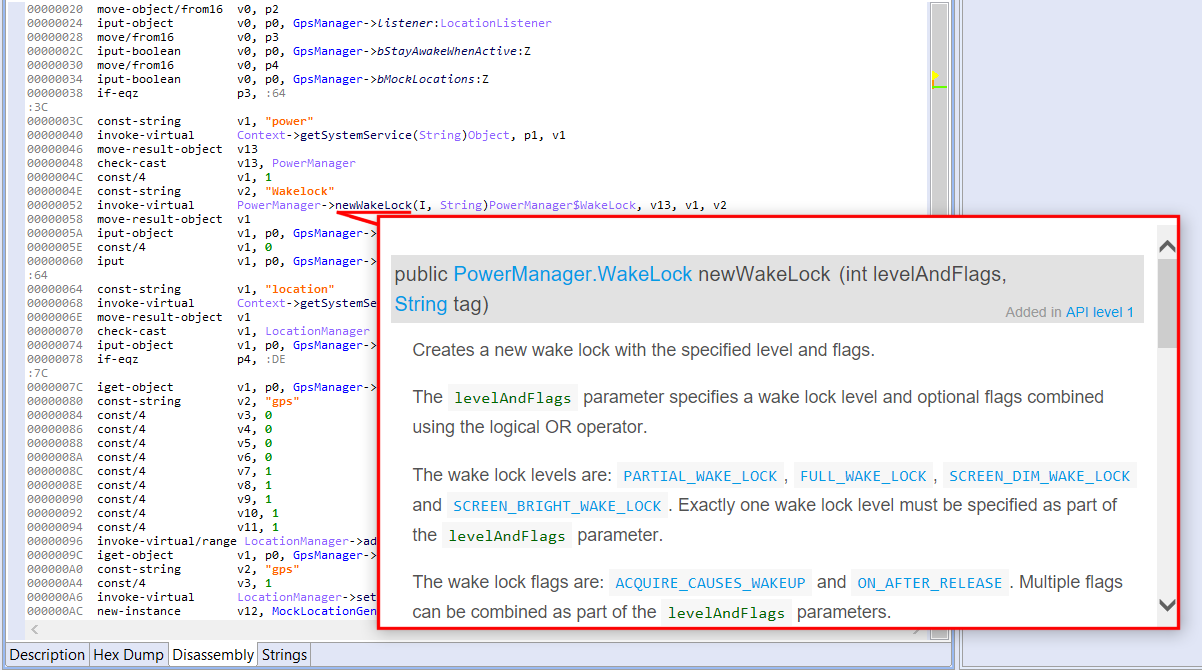
JEB 2.3.5 ships with a Javadoc contribution, whose immediate use can be seen in the Dalvik disassembly view of an APK: hover over an interactive code item to display its documentation. (The plugin works whether your system is connected to the Internet or not.)
The javadoc contribution kicks-in when hovering on a type name or method name, here, newWakeLock().
DEX Header Summary
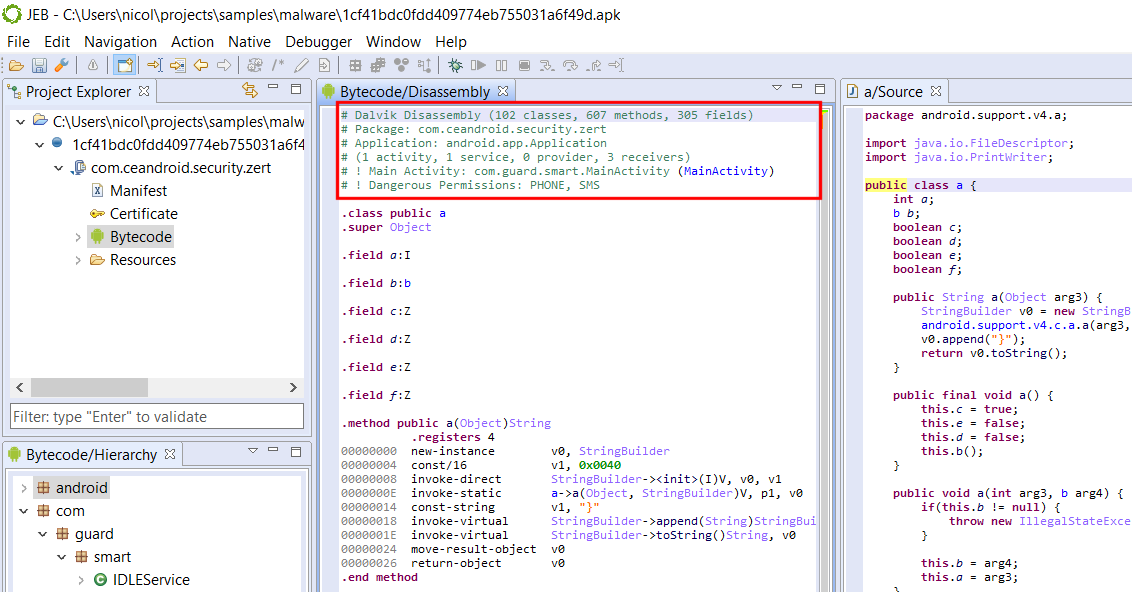
The DEX disassembly view now starts with a comment header summarizing the principal features of the bytecode, and optionally, its containing application (APK) unit.
Basic information is identified, such as package names, application details (if there is one1), activities and other end-point classes, as well as dangerous permission groups.
Various APK and DEX features of a known Android malware; notice that some phone and text permissions are requested by the app.
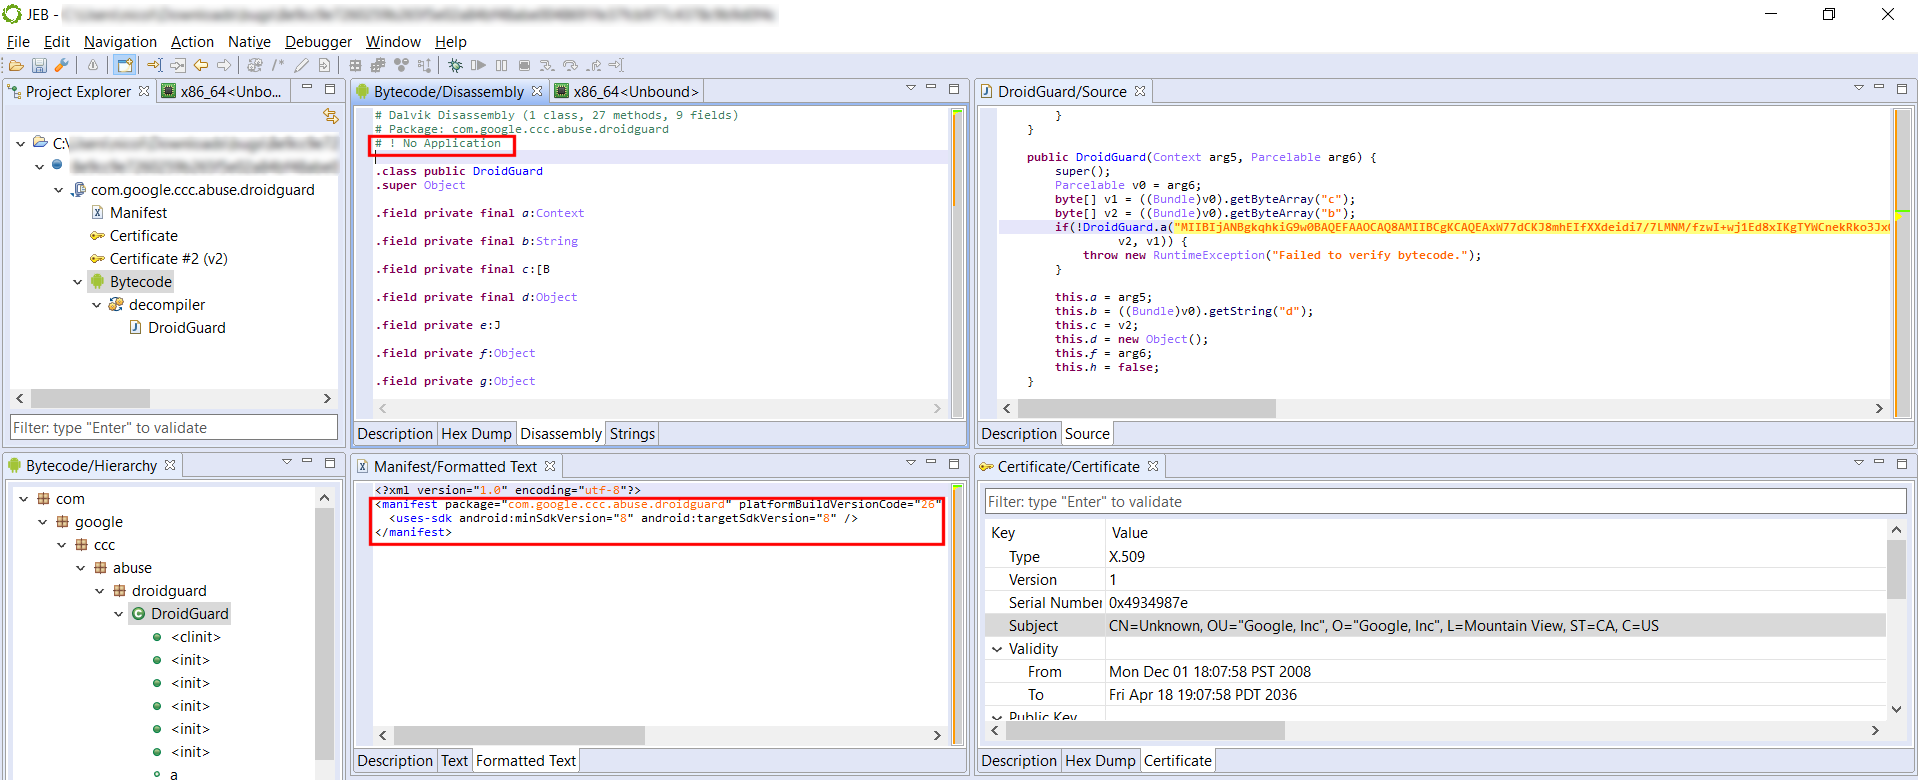
This legitimate APK is not an application, and the disassembly header emphasizes this fact.
Full Field and Method Refactoring
Up until JEB 2.3.4, renaming fields and methods only renamed the directly accessed field/method reference. We now support renaming “related” references as well, to cover cases like method overrides or “out-of-class” field access.
Here is a simple example with fields:
class A {
    int x;
    void f() {x = 1;}    //(1)
}

class B extends A {
    void g() {x = 2;}    //(2)
}
Technically, accessing x in (1) is not the same as in (2): f() uses a reference to A; g() uses a reference to B. However, the same concrete field is being accessed — because B is not defining (masking in this case) its own field named x. Even if B were to define its own field x (of type int or else), we could still access A.x by casting thisto B. Similar issues arise with methods, with the added complexity of interface definitions and overrides.
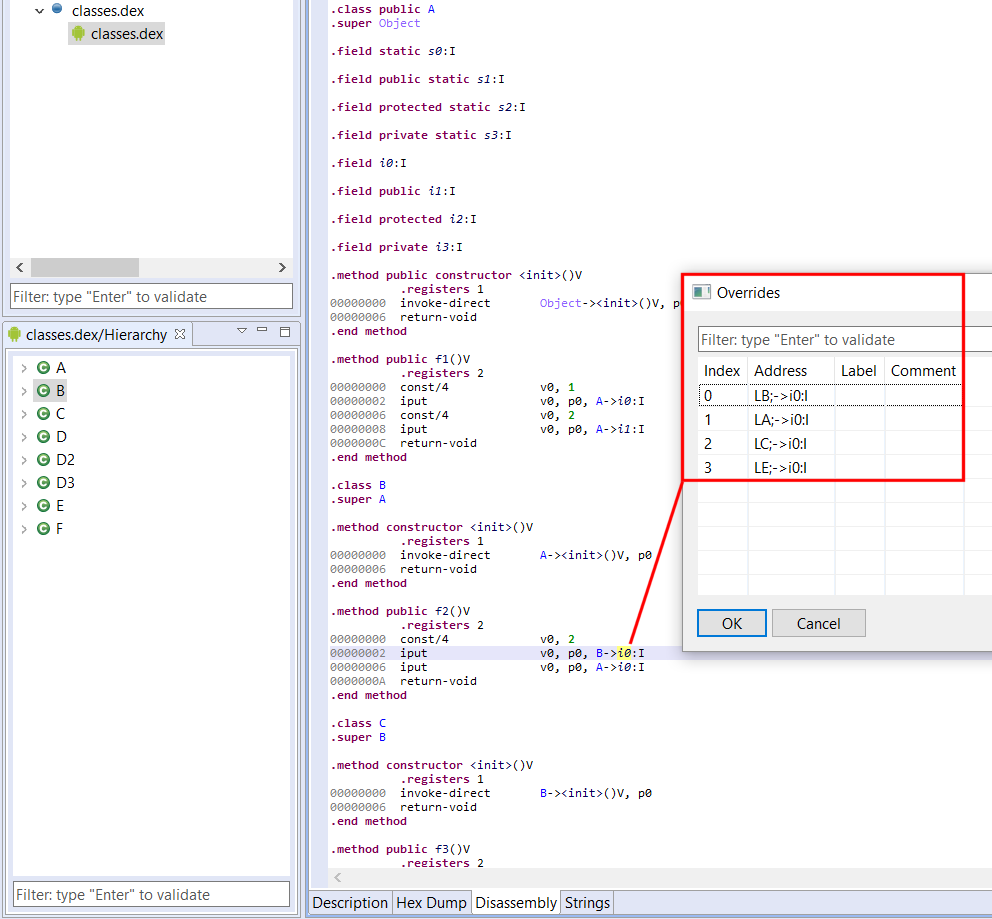
JEB now handles renaming those references properly. Also remember that viewing the list of cross-references (key: X) does not display related references. You can see those by executing the Overrides action (key: O).
Various accesses to field A.i0 (here accessing it via type B) can be seen by using the O key. The O key also works for method references.
Miscellaneous API Updates
The API was augmented in various places. This blog being focused on Android changes, have a look at the definition updates in those interfaces:
IDexUnit and IDexFile: those interfaces have been present since day 1 or almost; we added a few convenience routines such as getDisassembly(). Remember that IDexUnit represents an entire DEX unit, possibly the result of an underlying merger of several DEX files, if the app in question is a multi-DEX one. If you need to access physical details of a given classesX.dex, use the corresponding IDexFile object, which can be retrieved via the master IDexUnit.
IApkUnit: also a well-known interface; several convenience methods were added to access common Android Manifest properties, such as activities, services, providers, receivers, etc. Obviously, you may access the Manifest directly (it is an IXmlUnit) and perform your own XML navigation.
IXApkUnit: this new interface represents Extended APK (XAPK) files and is self-explanatory.
ICertificateUnit: the certificate unit is also self-explanatory. It offers a direct reference to a parsed X509 certificate object.
Unlike what the official doc says, a Manifest tag may not contain an Application element. ↩
The JEB 2.3.2 release contains several enhancements of our JDWP and GDB/LLDB1 debugger clients used to debug both the Dalvik bytecode and native code of Android applications.
Dynamically loaded DEX files
In this post, we wanted to highlight a neat addition to our Dalvik debugger. Up until now, we did not support debugging several DEX files within a single debugging session. 2
So, we decided to add support for debugging DEX files loaded in a dynamic fashion. Below is a use-case, step-by-step study of a simple app whose workflow goes along these lines:
A routine in the principal classes.dex file looks for an encrypted asset
That asset is extracted and decrypted; it is a Jar file containing additional DEX bytecode
The Jar file is dynamically loaded using DexClassLoader, and its code is executed
Now, we want to debug that additional bytecode. How do we proceed?
An example of debugging dynamically loaded bytecode
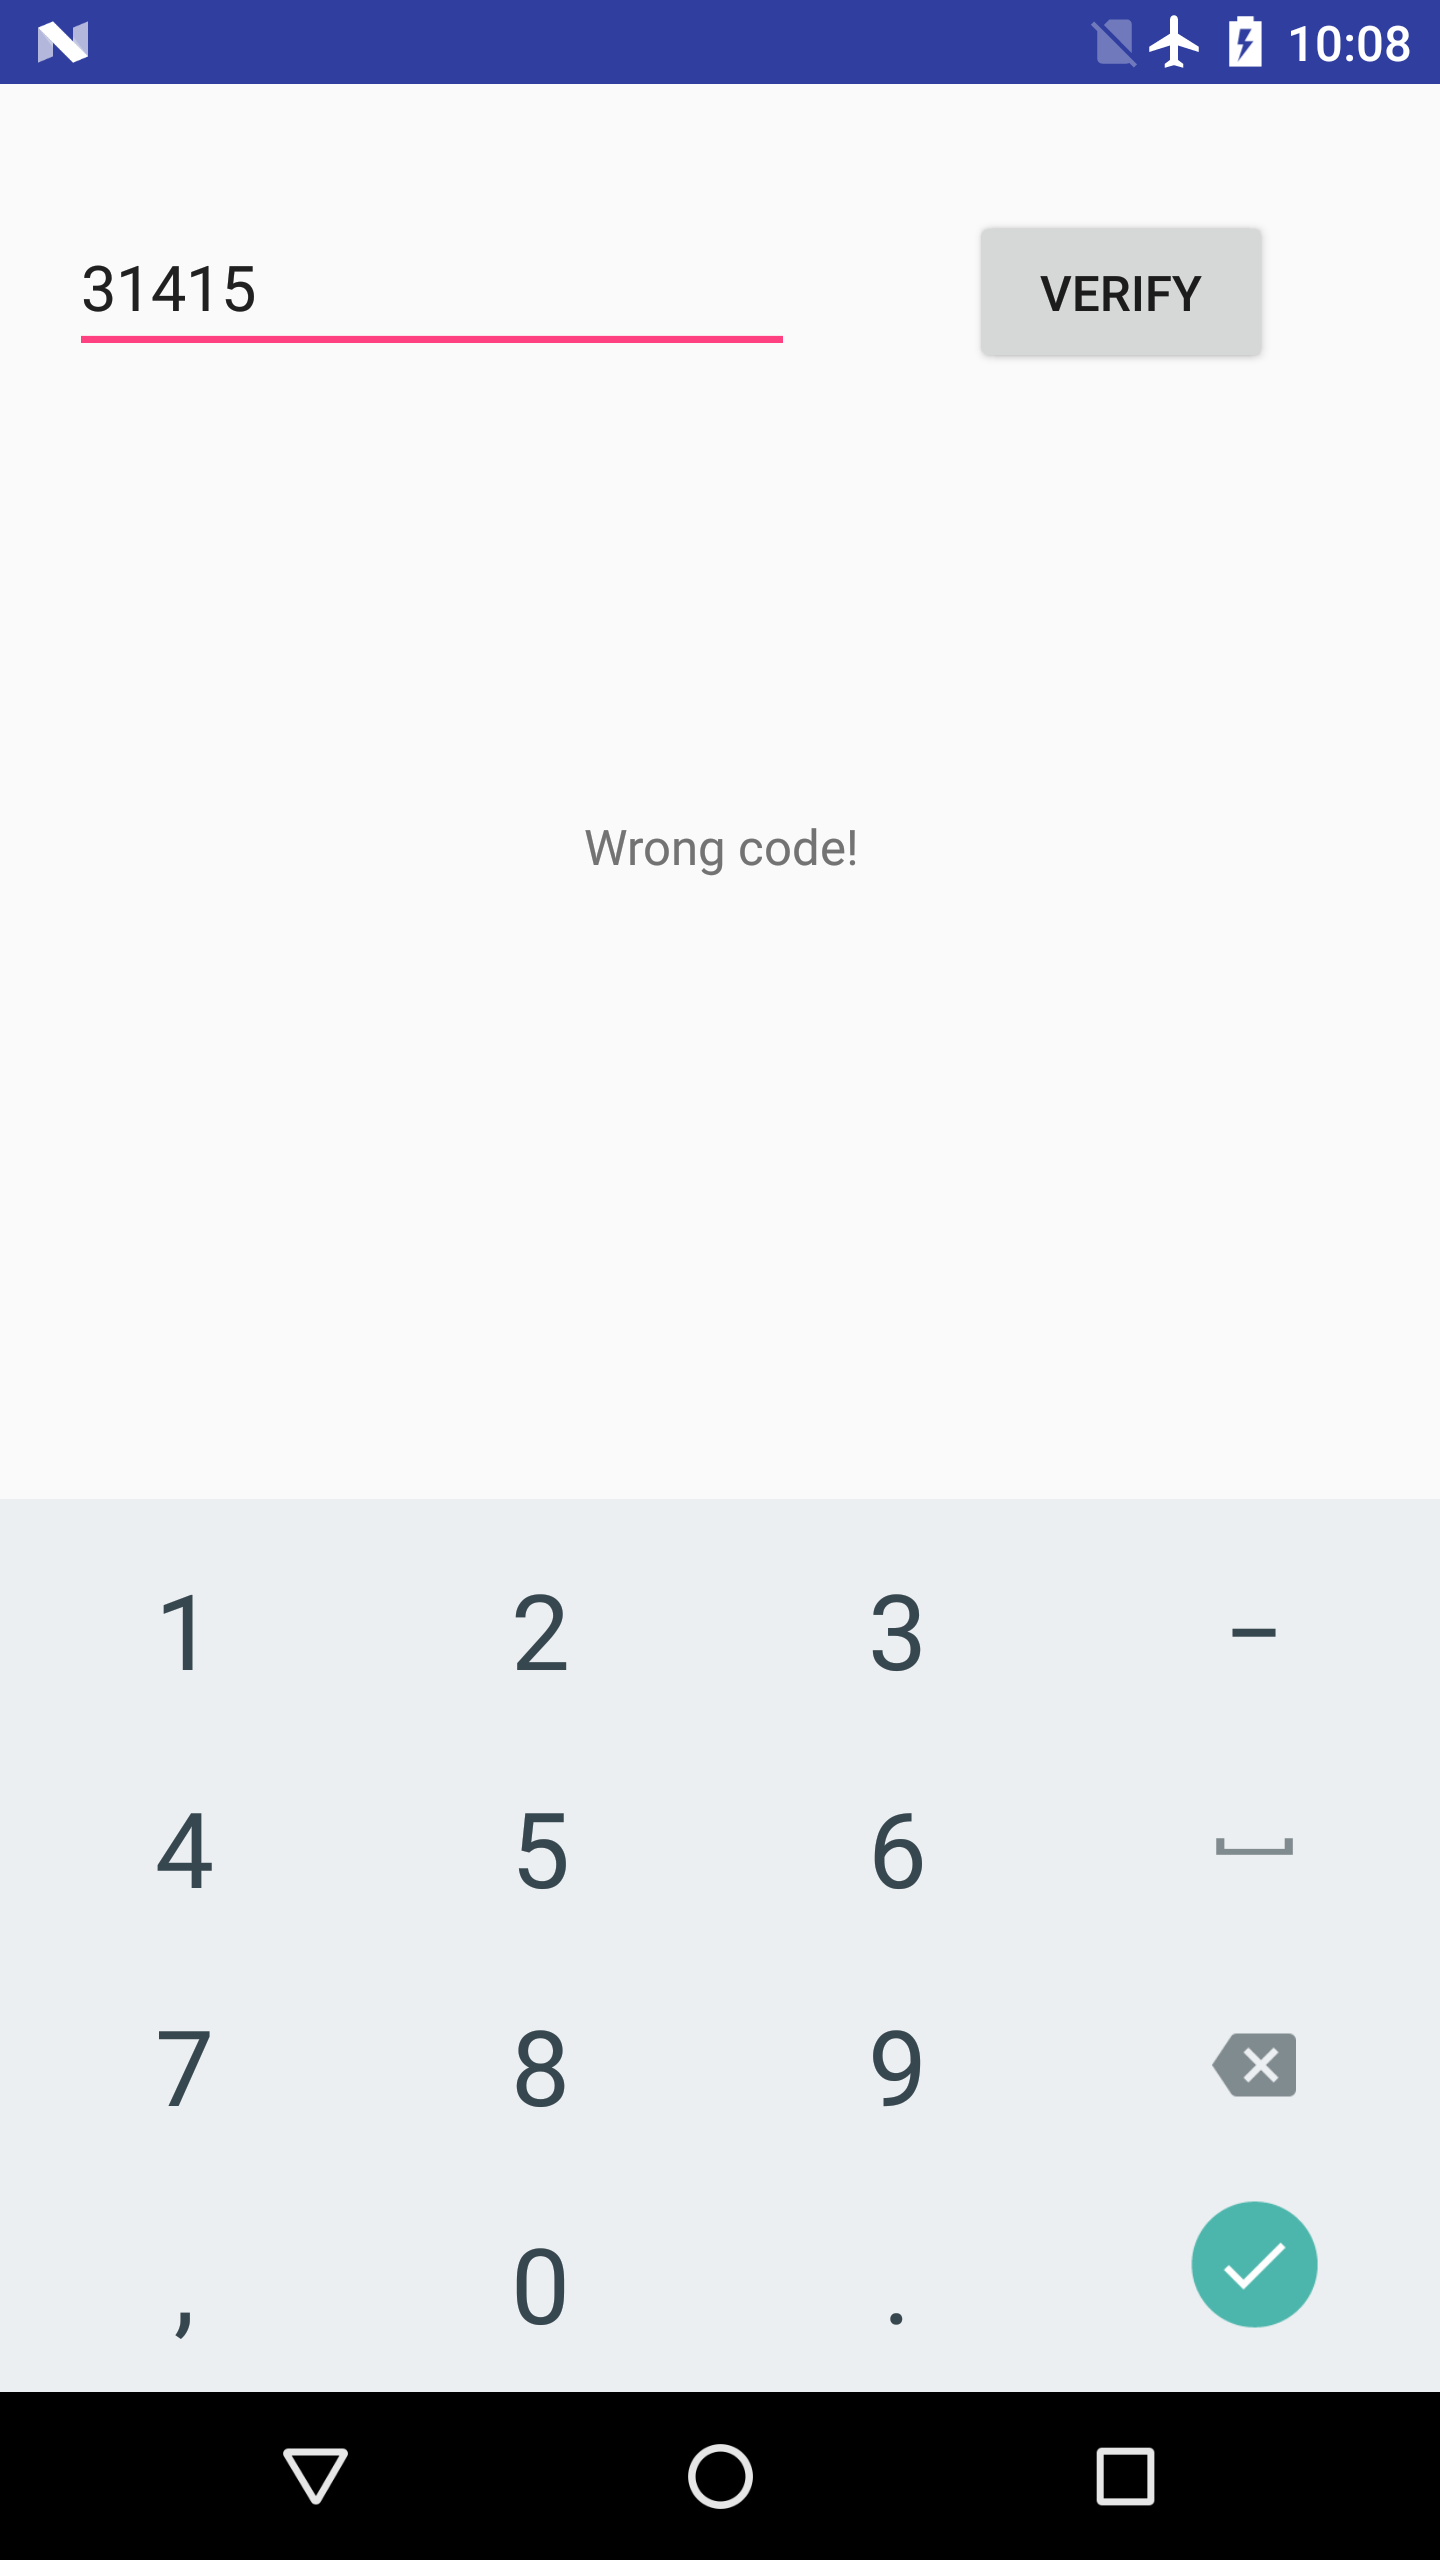
The app is called EnDyna (a benign crackme-like app, download it here). It offers a simple text box, and waits for the user to input a passcode. When entering the proper passcode, a success message is displayed.
The app requires the right password
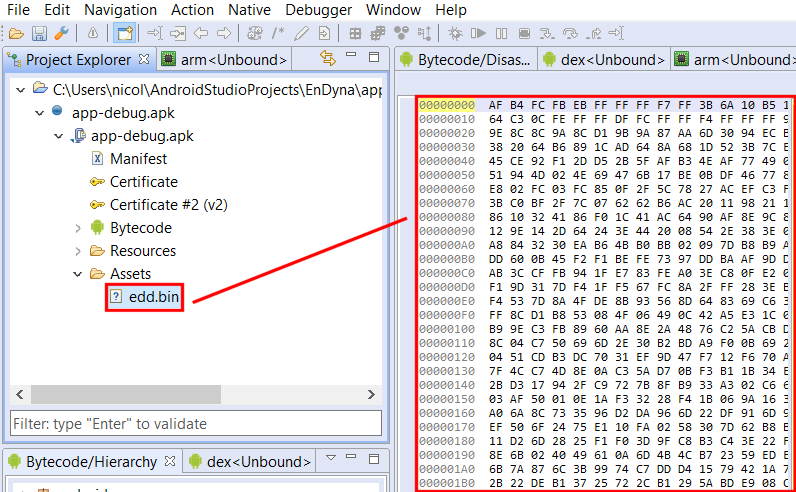
Open the app in JEB. It contains a seemingly-encrypted asset file called edd.bin.
Encrypted asset file
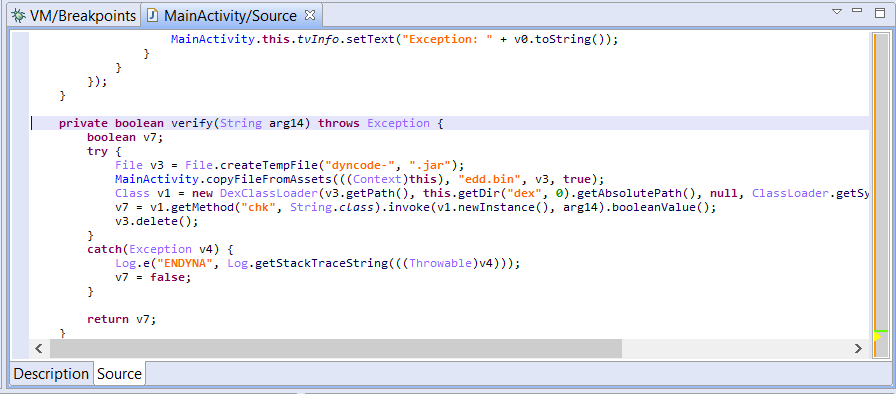
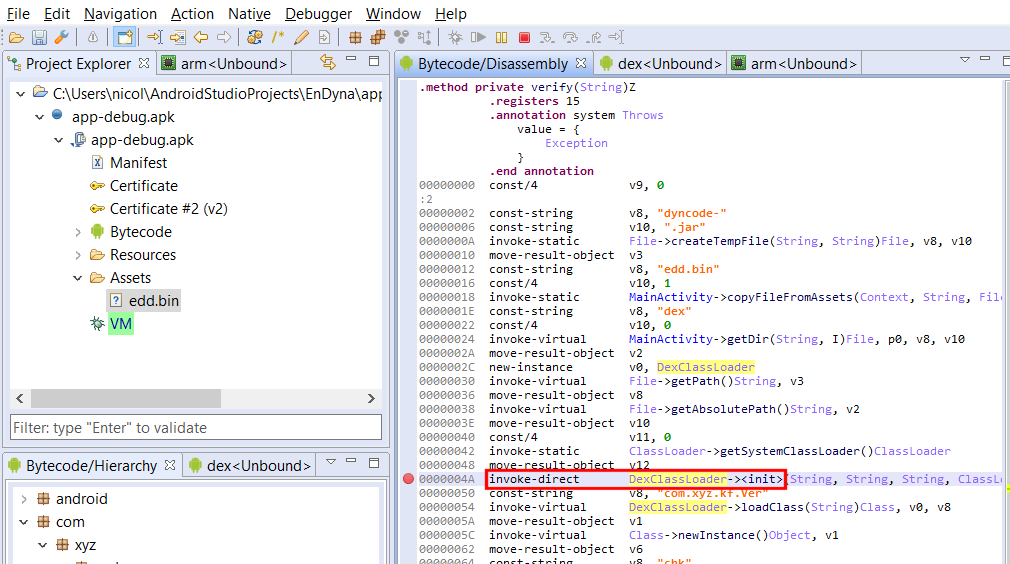
A closer look at the MainActivity class shows that the edd.bin file is extracted, decrypted (using a simple XOR cipher) and loaded using DexClassLoader in order to validate the user input.
Passcode verification routine
Let’s attach the debugger to the app, and set a breakpoint where the call to the DexClassLoader constuctor is made.
A breakpoint was set on the DexClassLoader constructor invocation
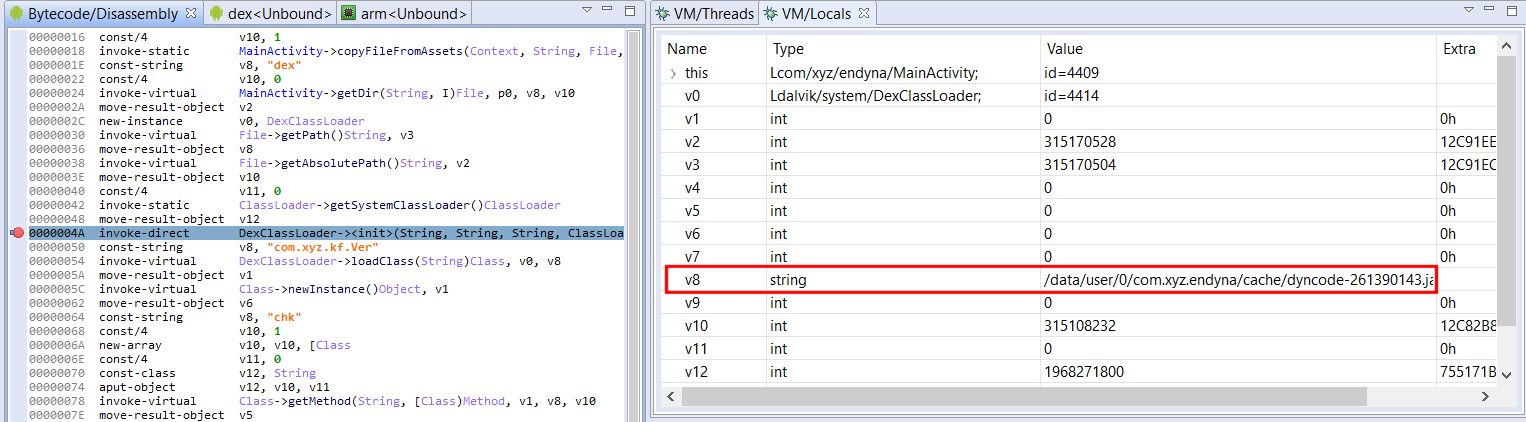
We then trigger the verify() routine by inputting a passcode and hitting the Verify button. Our breakpoint is immediately hit. By examining the stackframe of the paused thread, we can retrieve the class loader variables and see where the decrypted DEX file was written to – and is about to get loaded from.
The decrypted Jar file about to be loaded from the path referenced by the stack variable v8
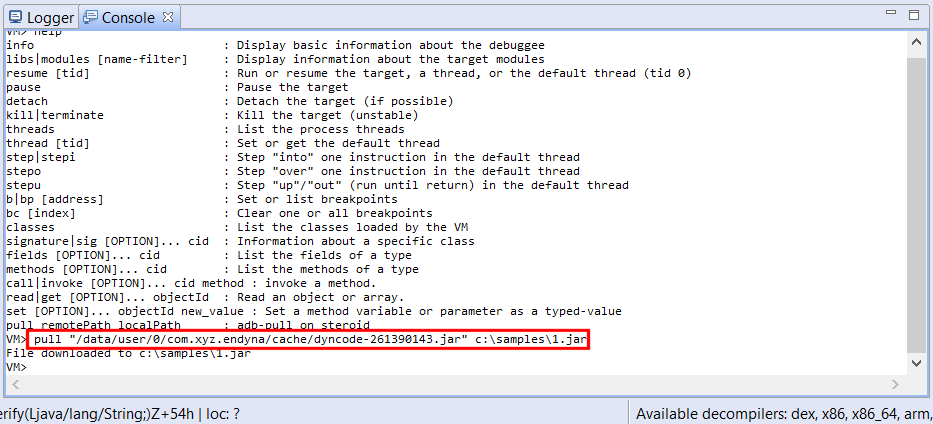
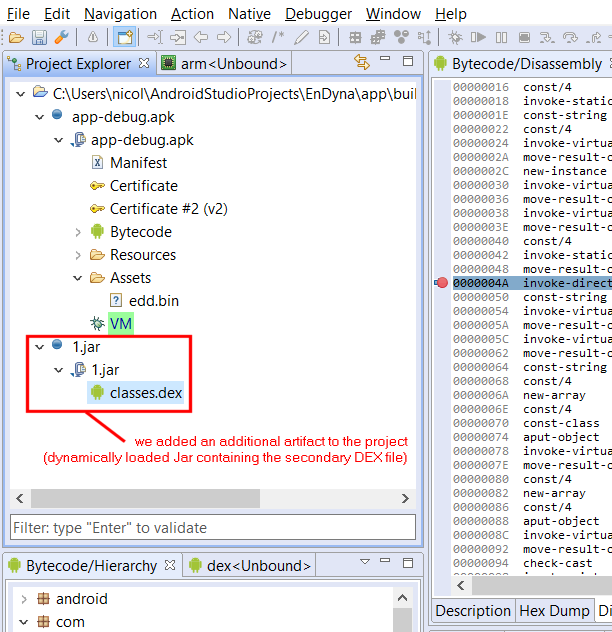
We now have the Jar file containing our dynamically-loaded DEX file in hand! We load it in JEB by adding an additional artifact to the project (command File, Add an Artifact…).
After processing is complete, the Android debugger notices that the added artifact contains a DEX file, and integrates it in its list of managed units.
We can set a breakpoint on the method of the second DEX file that’s about to be called.3
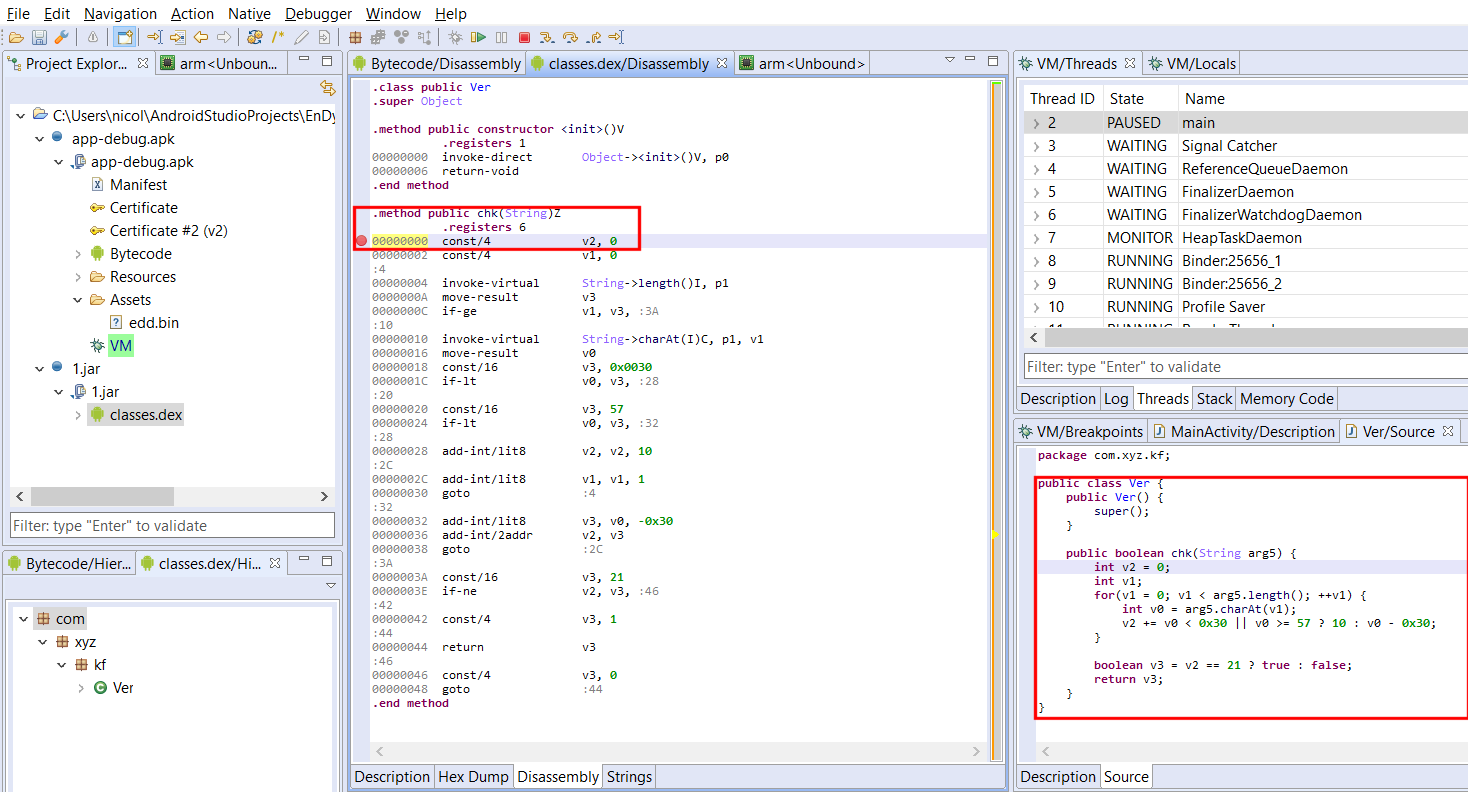
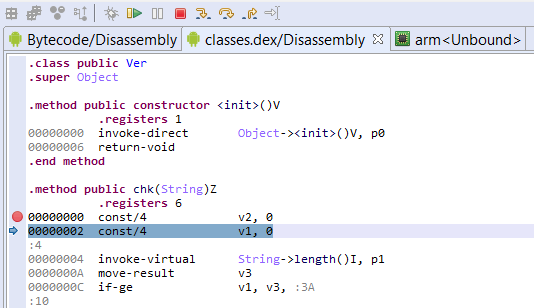
The second DEX file; notice the decompiled chk() method on the right-side. Here, we set a breakpoint on the method’s first instruction. It’s about to be called from MainActivity.verify(), in the primary classes.dex file.
We resume execution, our breakpoint is hit: we can start debugging the dynamically dropped DEX file!
Of course, all of the above actions can be automated by a Python script or a Java plugin. (We will upload a sample script that hooks DexClassLoader on our public GitHub repository shortly.)
We published a short video that demos the above steps, have a look at it if you want to know precisely the steps that we took to get to debug the additional DEX file.
Thank you – stay tuned for more updates, and happy debugging!
Our native GDB debugger client underwent a major revamp, as we upgraded to the LLDB debugger server instead of gdbserver. More details in a separate post! ↩
Note that the class in question (com.xyz.kf.Ver) may not even be loaded at this point; it is perfectly fine to do so: JEB handles dynamically loaded types fine and will register breakpoints timely and accordingly. ↩
Android O – API level 26 – upgrades the DEX format in order to provide support for dynamic invocation via two new Dalvik opcodes: invoke-polymorphic and invoke-custom.1
In this post, we will:
Do a brief recap of how dynamic invocation is achieved in Java
Present the changes made to the DEX file format in Android O
Explain what the new dynamic invocation instructions can do and how they work
Show code samples to generate DEX version 38 files
Have a quick look at dynamic invocations in the context of app obfuscation
Note that JEB supports DEX version 38, as well as version 39 additions. That includes API support for programmatic access to the new pools and invoke-polymorphic, invoke-custom instructions, via the IDexUnit entry point interface.
“[invokedynamic] improves implementations of compilers and runtime systems for dynamic languages on the JVM. It does this by allowing the language implementer to define custom linkage behavior. This contrasts with other JVM instructions such as invokevirtual, in which linkage behavior specific to Java classes and interfaces is hard-wired by the JVM.”
If that sounded like gibberish to you, you may want to get up to speed on dynamic invocation in Java – in particular, read the javadoc of MethodHandle and CallSite. We will (re)explain a bit in this post, but it is definitely not the main purpose of it. On top of the official Oracle doc as well as the original JSR, I recommend this article from the author of ByteBuddy.
Back in the Dalvik world
Up until DEX v35/v37, the way to invoke code in Dalvik was through one of the 5 invocation instructions:
invoke-virtual for virtual methods (Java’s invokevirtual)
invoke-static for static methods (Java’s invokestatic)
invoke-interface for methods called on interface types (Java’s invokeinterface)
invoke-super for super-class methods (Java’s invokespecial)
invoke-direct for constructors (Java’s invokespecial, again)
invoke-virtual Ljava/lang/String;->length()I, v
Each one of these takes a method item, which specifies a type (class or interface) as well as a method reference – ie, the “hard-wiring” part mentioned in the above quote. Java is statically typed, and the bytecode reflects that.2 That is, until invokedynamic was introduced with Java 7.
So, what is the Dalvik equivalent of Java’s invokedynamic?
Actually, there are 4 (2×2):
invoke-polymorphic (as well as invoke-polymorphic/range), which does “half” of what invokedynamic can do;
invoke-custom (as well as invoke-custom/range), which does the other, more powerful “half”.
invoke-custom requires additional pool elements, namely method handle items and call site items. Let’s walk over the DEX format additions to support those additional pools.
DEX version 38 changes
Most DEX files have version number 35. Android Nougat introduced version 37, which did not bring any structural changes (the new version code indicated support for Java 8’s default methods). If you were wondering why Dalvik did not have the equivalent of JVM’s invokedynamic, well, brace yourself: DEX version 38 is coming.
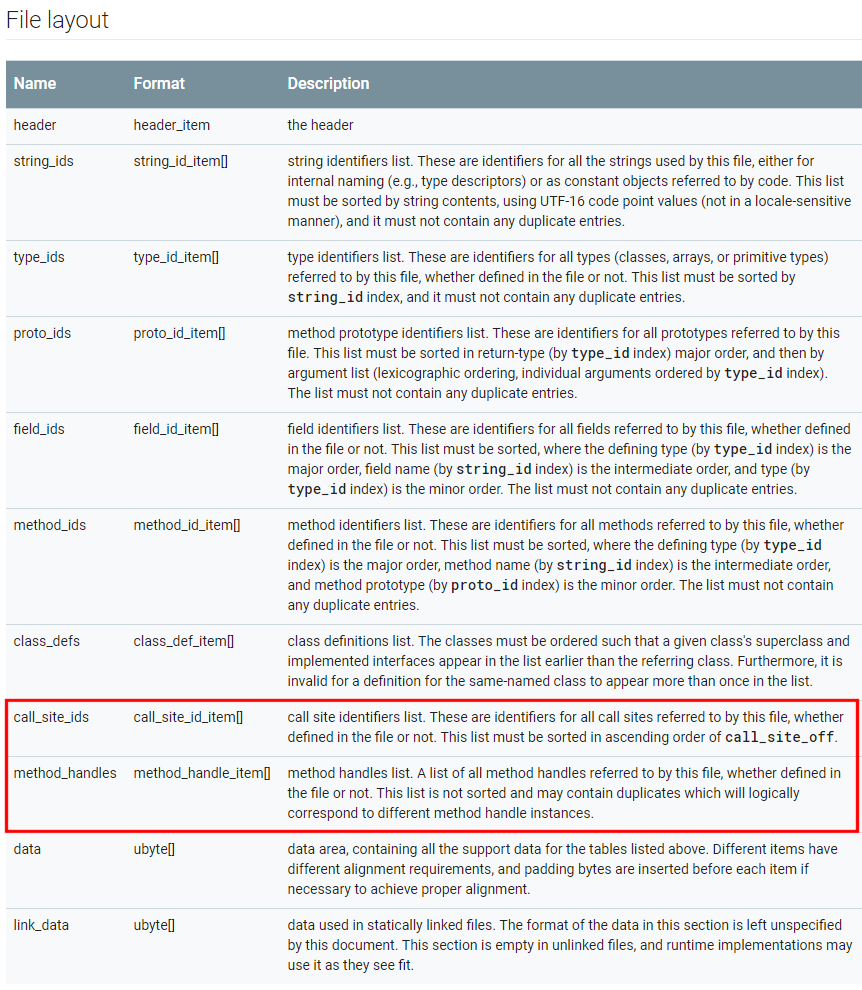
The header magic is now “DEX\x0A038\x00”. The updated file layout shows two additional pools: call_site_ids and method_handles.
However, the header size is still 70h bytes, and therefore, contains neither the offset to, nor the count of items, for those pools. Where are they?
Let’s turn to the DEX map. Sure enough, new types were introduced: TYPE_CALL_SITE_ID_ITEM (7) and TYPE_METHOD_HANDLE_ITEM (8). We can parse the map, find those two entries, and start parsing the pools.
A call site item is essentially an array of DEX Values. The array contains at least 3 entries:
a method handle index (as in: a Java MethodHandle) to a bootstrap linker method;
a dynamic method name, the one to be dynamically resolved
a dynamic method type (as in: a DEX prototype);
additional arguments. More on this later when we discuss invoke-custom.
a type, indicating whether the method handle is a method invoker or a field accessor;
and a method id or field id, depending on the aforementioned type.
As far as other changes go, obviously, the DEX Value entries can be of two additional types: VALUE_METHOD_TYPE (0x15) that references the prototypes pool, and VALUE_METHOD_HANDLE (0x16) that references the method handles pool. (Note that there is no VALUE_CALL_SITE.)
Now, let’s see how those pools are used by the new invoke instructions, and how those instructions work.
Dalvik’s invoke-polymorphic
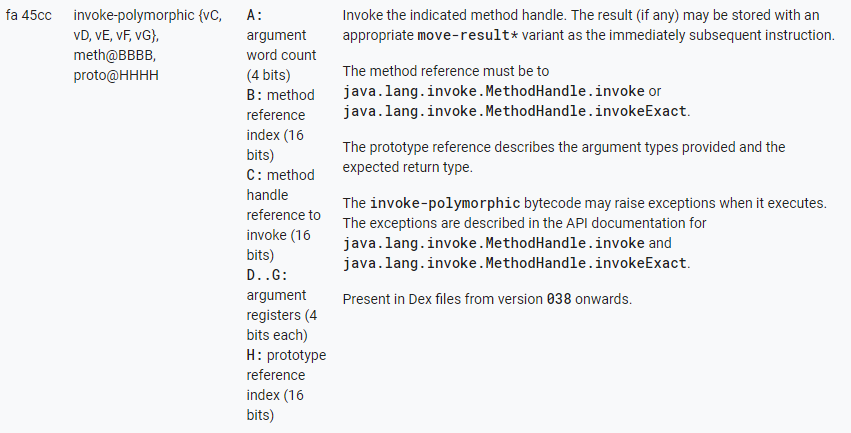
Below are the specifications of invoke-polymorphic taken from Android Source:
invoke-polymorphic is used to invoke a method handle using one of two @PolymorphicSignature3 methods of the MethodHandle object: invoke() or invokeExact(). It takes at least 3 arguments:
A method reference to either MethodHandle.invoke or MethodHandle.invokeExact (MH.invoke)
The prototype of the method to be executed
A method handle (mh) of the target
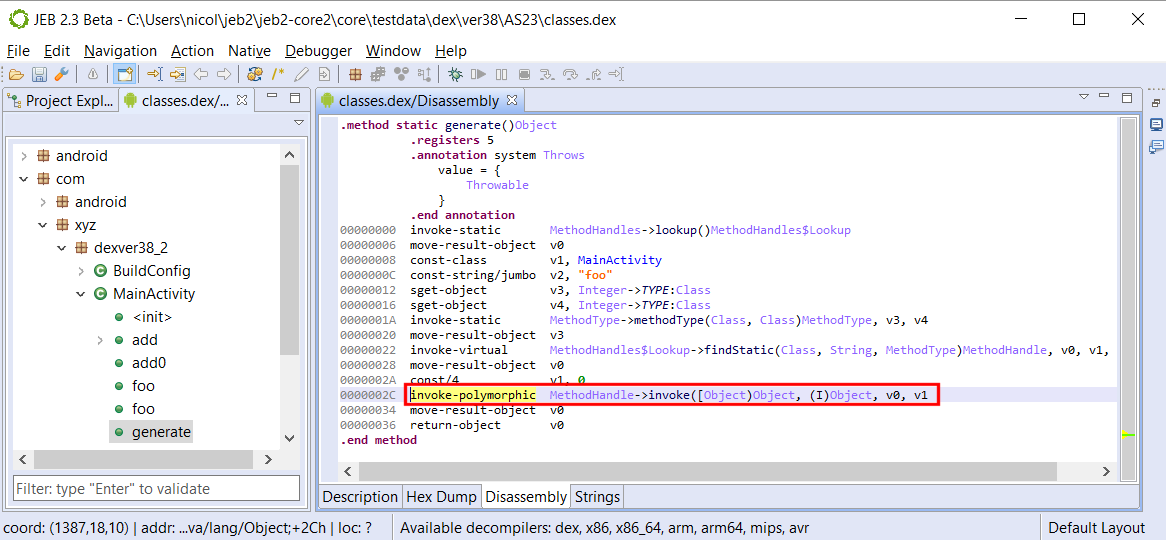
See the example below: MethodHandle.invoke() is used on the method handle v0; the target method has the prototype (I)Object. Therefore, v1 is of type int; the return value will be of type Object.
invoke-polymorphic used in a Dalvik version 38 file
The return type as well as parameter types are specified in the prototype item, instead of a static method item — hello, polymorphism. Of course, the target method handle must reference a method of such type, either exactly, if MethodHandle.invokeExact() is used, or have compatibility with the type (via conversion operations), using MethodHandle.invoke().
Wait, That looks like a normal invocation!
You would be semi-right to think so. After all, we are executing invoke() or invokeExact() the old fashion way here… so, why need an additional opcode? First, remember that those methods have polymorphic signatures; their prototype is determined at compile-time. Therefore, there are two options (using the example above):
either the bytecode references an invoke with an (I)Object prototype: in this case, we could simply call invoke-virtual on an artificial invoke(I)Object. This is the case with the Java bytecode: invokevirtual is used;
or the bytecode references the generic invoke([Object)Object: in this case, the invocation would require an additional prototype argument. Hence the requirement for a new invoke opcode. This is the case with the Dalvik bytecode: invoke-polymorphic was created. It takes not one, but two pool indexes.4
Can’t I do the same with reflection?
You may be wondering what the point of these convoluted constructions is… After all, couldn’t we do the same with reflection? The answer is mostly yes, however, remember that invokedynamic has a different goal than introspection: the goal of invokedynamic is to provide an efficient low-level primitive meant to execute dynamic call sites, and therefore, enable the implementation of dynamic languages on top of the JVM.
Practically, and as far as Java goes, they enable the implementation of Java 8 lambdas without the use of pre-compiled anonymous inner classes.
Also practically, true polymorphism means we are no longer dealing with the auto-boxing casts associated with Reflection API calls. MethodHandle.invoke() is a very particular method – as said above, it is has a polymorphic signature, inferred at compile-time based from the types of arguments and return value provided in the call. Nothing like actual code to show what we mean here.
Sample Code
The example below has a triple-purpose:
Set up your environment to generate DEX v38 files;
public class MainActivity extends Activity {

    @Override
    protected void onCreate(Bundle savedInstanceState) {
        super.onCreate(savedInstanceState);
        String text = "";
        try {
            text = String.format("dynamic=%s reflect=%s", execDynamically(), execViaReflection());
        }
        catch(Throwable e) {
            text = e.toString();
        }
        Log.d("DexVer38", text);
        TextView tv = new TextView(this);
        tv.setText(text);
        setContentView(tv);
    }

    static Object execDynamically() throws Throwable {
        return MethodHandles.lookup().findStatic(MainActivity.class,"foo",
                MethodType.methodType(int.class, String.class, int.class)).invoke("hello", 2);
    }

    static Object execViaReflection() throws Throwable {
        return MainActivity.class.getDeclaredMethod("foo", String.class, int.class).invoke(null, "hello", 2);
    }

    static int foo(String s, int i) {
        return s.charAt(i);
    }
}
Both execDynamically() and execViaReflection() methods eventually invoke foo(“hello”, 2) and return its result:
$ adb logcat -s "DexVer38"
[...] D DexVer38: dynamic=108 reflect=108
However, while the polymorphic MethodHandle.invoke() of execDynamically truly takes a String as first argument, an int as second argument, and returns an int; we know it is not the case with the non-polymorphic invocation used by the Method.invoke(): casts are in place to box/unbox the int primitives to/from an Integer object.
Open the resulting DEX file in JEB:
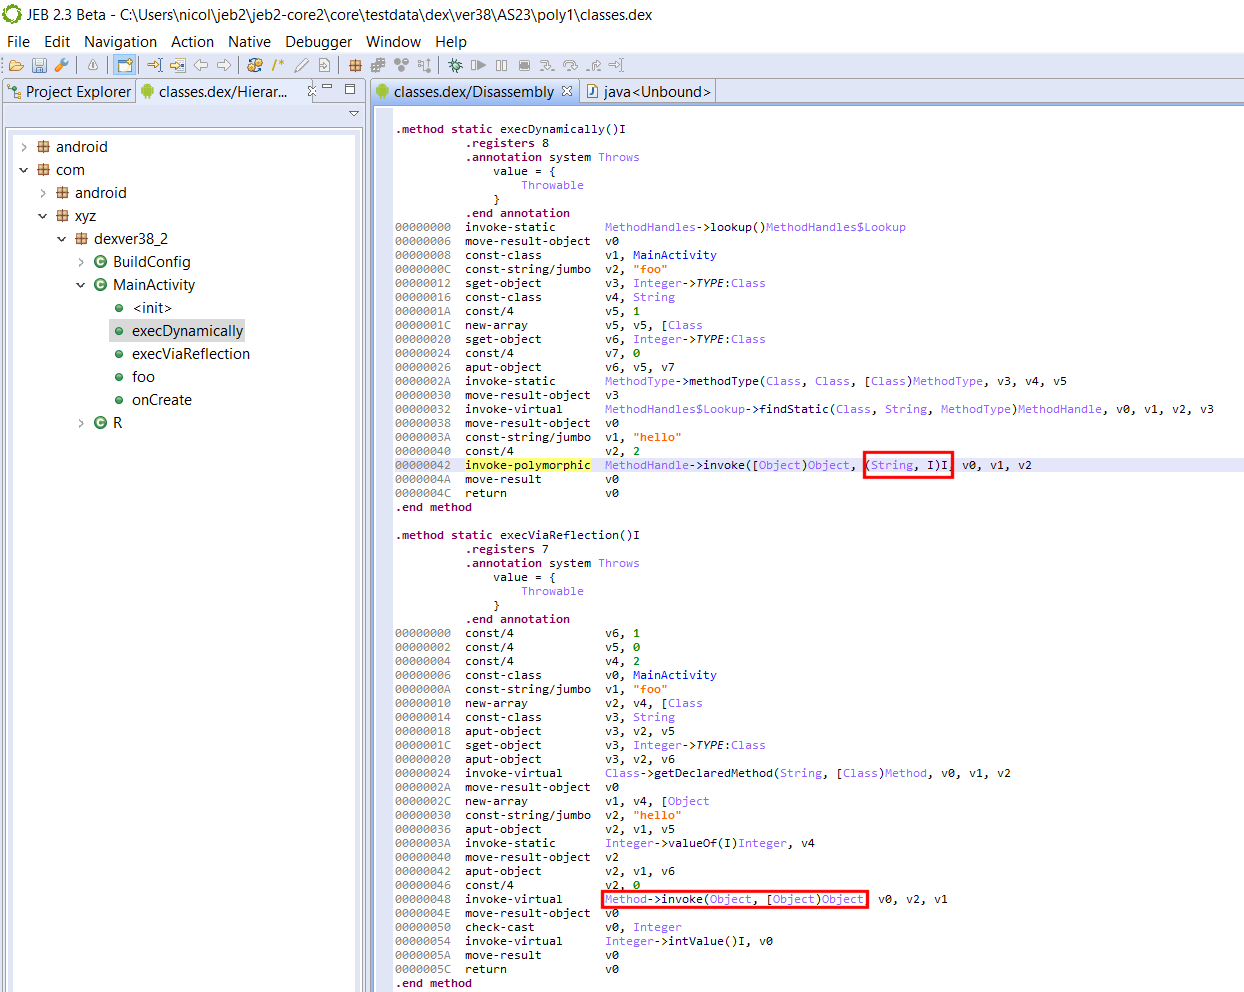
MethodHandle and invoke-polymorphic vs Reflection and invoke-cirtual
Carefully look at the disassembly of both methods:
invoke-polymorphic’s MethodHandle.invoke handles any prototype, as long as the referenced method matches it
reflection’s Method.invoke is called using a traditional invoke, and therefore, its arguments must be a an array of Object, and its return value an Object — hence, the casts.
I hope this sheds some light on invoke-polymorphic, in terms of MethodHandle uses and resulting differences in the bytecode.
Dalvik’s invoke-custom
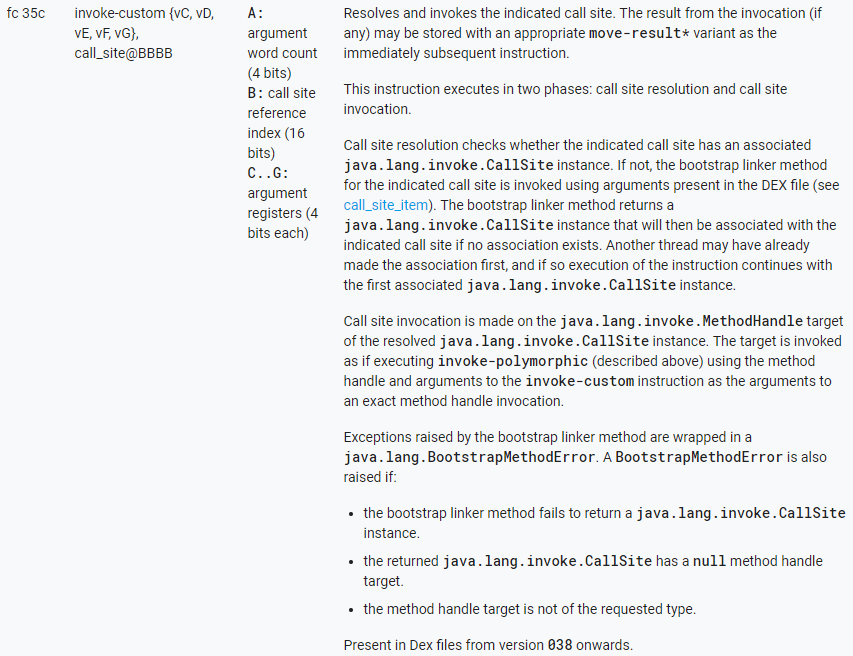
Below are the specifications of invoke-custom taken from Android Source:
invoke-custom callsite, {arguments}
Dalvik’s invoke-custom ~= Java’s invokedynamic
Before we explain the mechanics behind invoke-custom, remember that unlike the legacy invoke-xxx instructions, it does not take a reference to the LType;->method() that will be executed. Both will be determined at run-time.
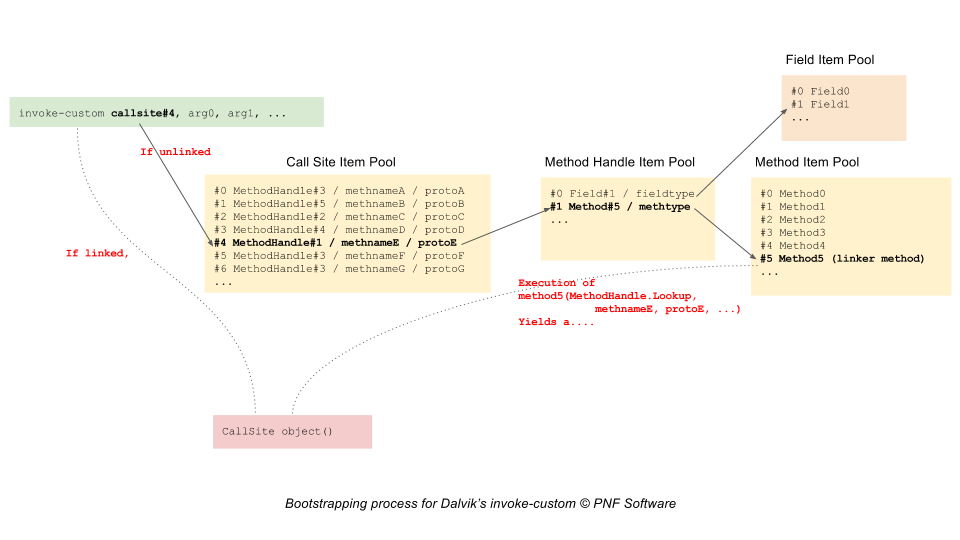
The invoke-custom instruction first resolves and then invokes a call site:
Initially, an invoke-custom instruction is an unlinked state: its call site has yet to be created. It is the resolution stage:
The runtime checks if a CallSite object exists for the provided callsite index
If not, a new CallSite object is created using the data provided by the call site item at the corresponding pool index, via a bootstrap linker method
The invoke-custom is now in a linked state
When the invoke-custom is in a linked site, the CallSite object’s MethodHandle is invoked.
The following diagram summarizes the bootstrap process of linking an unlinked invoke-custom:
Delaying the resolution and creation of the callsite until runtime allows the VM to take the decision of which type and which method should the execution flow be dispatched to.
Bear in mind that in standard Java, crafting explicit code using dynamic invocationis currently not possible. That limitation can be circumvented with custom toolchains (such as Android’s Jack, as we’ll see below). However, a prime candidate for implicit use of dynamic invocations are of course lambdas. Lambda functions have been supported since Android Nougat and are currently compiled using virtual invocations. It is safe to say that we should see lambdas using invoke-custom in the near future, maybe as early as the release candidate of Android O.
Sample Code
Currently, crafting high-level Java code that produces invoke-custom is convoluted and artificial — unfortunately, lambdas are still desugared into statically invoked methods of synthetic inner classes.
Two possible options are:
Crafting Dalvik code manually , or via a custom tool, or via a bytecode manipulation library. It is outside the scope of this post;
Use the soon-to-be-deprecated Jack toolchain and custom Jack annotations to generate bootstrap methods.
Using the second approach, we can generate code that contains correct call site item pools. However, at the moment, those DEX files do not pass the Verifier.
That being said, the generated bytecode looks fine. Have a look at the sample below:
public class MainActivity extends Activity {

    @Override
    protected void onCreate(Bundle savedInstanceState) {
        super.onCreate(savedInstanceState);
        String text = "";
        try {
            text = "" + execCustom();
        }
        catch(Throwable e) {
            text = formatThrowable(e);
        }
        Log.d("DexVer38", text);
        TextView tv = new TextView(this);
        tv.setText(text);
        setContentView(tv);
    }

    public static String formatThrowable(Throwable t) {
        Writer writer = new StringWriter();
        PrintWriter out = new PrintWriter(writer);
        t.printStackTrace(out);
        return writer.toString();
    }

    public static Character execCustom() throws Throwable {
        return foo("hello", Integer.valueOf(2));
    }

    @CalledByInvokeCustom(
            invokeMethodHandle = @LinkerMethodHandle(kind = MethodHandleKind.INVOKE_STATIC,
                    enclosingType = MainActivity.class,
                    name = "linkerMethod",
                    argumentTypes = {MethodHandles.Lookup.class, String.class, MethodType.class}),
            name = "foo",
            returnType = Character.class,
            argumentTypes = {String.class, Integer.class})
    static Character foo(String s, Integer i) {
        return s.charAt(i);
    }

    private static CallSite linkerMethod(MethodHandles.Lookup caller, String name, MethodType methodType)
            throws NoSuchMethodException, IllegalAccessException {
        return new ConstantCallSite(caller.findStatic(caller.lookupClass(), name, methodType));
    }
}
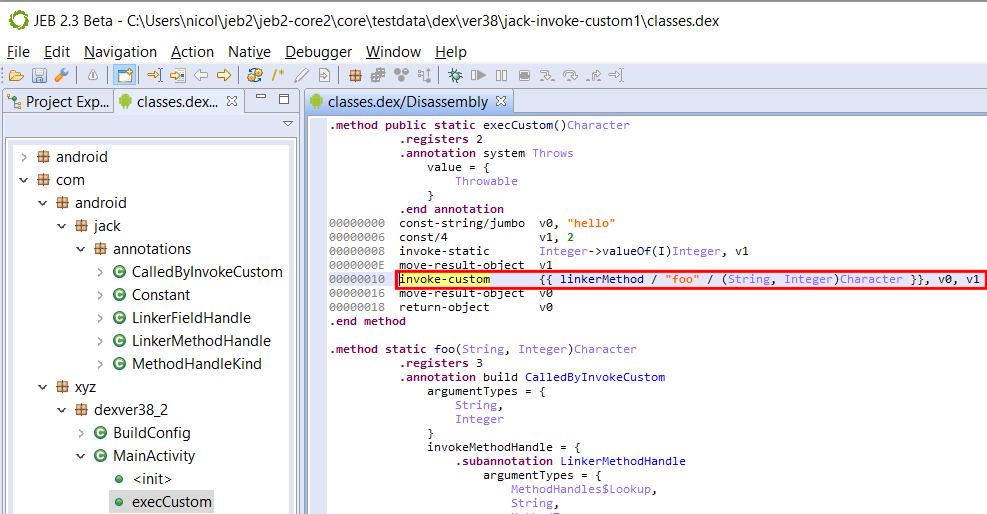
Using the CalledByInvokeCustom annotation, we can specify that foo() must be dynamically invoked. The code is a bit artificial, and the linked method trivial, but see how the seemingly static call to foo() in execCustom() was compiled to the following bytecode:
invoke-custom used in a Dalvik version 38 file
Note that the JEB syntax for invoke-custom call sites is temporary and subject to change. At the moment, the pool’s call site is displayed within double curly brackets:
JEB will decompile those constructs to an invocation of the bootstrap linker method, followed by a call to invoke() on the returned CallSite’s method handle. In a real environment, the bootstrap method would be executed just once. Indeed, high-level Java code cannot reflect all forms and uses of those low-level constructs.
Keep in mind that invoke-custom‘s purpose is much broader than this dummy example. As said in the previous section, we should expect it to initially be used when generating Java 8’s lambdas. They may not be extremely popular – not yet – in traditional Java programming circles, but Google’s big push on Kotlin for Android O, including:
Kotlin integration in Android Studio, facilitating adoption;
Kotlin full compatibility with Java, allowing mixed code base during migration;
Kotlin’s affinities with dynamically-typed languages;
may be indicators that invoke-custom (and invoke-polymorphic) will be used to power new language features for Android app development in the near future.
Dynamic invocation used for obfuscation
Finally, let’s conclude this post with a note on obfuscation, and generally, unintended, unplanned, or at least non-primary use cases, for MethodHandle.
Just like reflection has been heavily used by all5 Dalvik protectors and obfuscators to hide API calls and make static code flow analysis difficult, we should expect MethodHandle and CallSite to be used in similar ways.
MethodHandle objects have more restrictions than pure reflection though, eg, in terms of the scope of what can be retrieved. Obviously, they cannot be used to retrieve types dynamically — which means there is no equivalent to Reflection’s Class.forName(“…”). However, they can be used to retrieve handles on methods, constructors, and fields, and therefore could be mixed in with standard reflection-based obfuscation techniques.
As for invoke-custom: parsing and analysis of the call site items pool will be required to retrieve references to boostrap linker methods, and determine their effect on code.
So, exciting times ahead! We should all be excited to see those new dynamic invoke opcodes used by apps in the future, as well as the potential they bear in terms of new languages (or more realistically, new language features) that they can provide for Android app development.
And their /range counterparts. Essentially, this update is the Android implementation of JSR292↩
That point is debated; however, the invoke call sites exhibit the static nature of type binding in the bytecode. ↩
The PolymorphicSignature annotation is defined within MethodHandle and visible only to types declared in the java.lang.invoke package ↩
Both ways are conceptually valid. In the first case, we are assuming that an infinity of MethodHandle.invoke signatures exist. In the second case, we consider that MethodHandle.invoke true prototype is ([Object)Object; that means we must provide the actual prototype separately, via a new opcode. ↩
The Dalvik verifier is quite strict and limits the classes of obfuscation that can be applied onto bytecode. ↩
We have released and open-sourcedAndrosig, a JEB plugin that can be used to sign and match library code for Android applications. That plugin was written by our summer intern, Ruoxiao Wang.
The purpose of the plugin is to help deobfuscate lightly-obfuscated applications that perform name mangling and hierarchy flattening (such as Proguard and other common Java and Dalvik protectors). Using our generic collection of signatures for common libraries, library code can be recognized; methods and classes can be renamed; package hierarchies can be rebuilt.
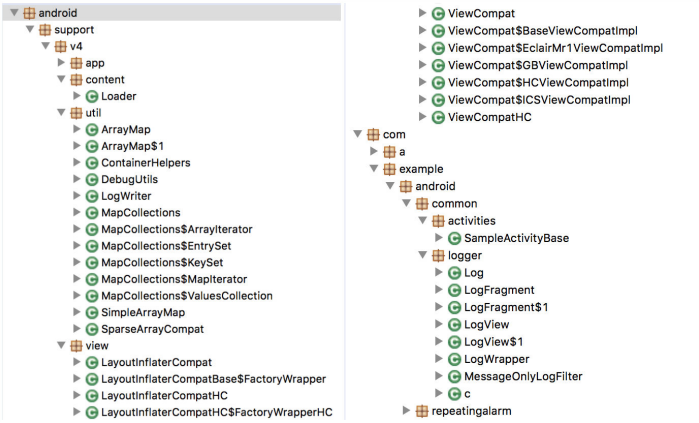
Example on a random obfuscated application, obfuscated by Proguard, before and after matching:
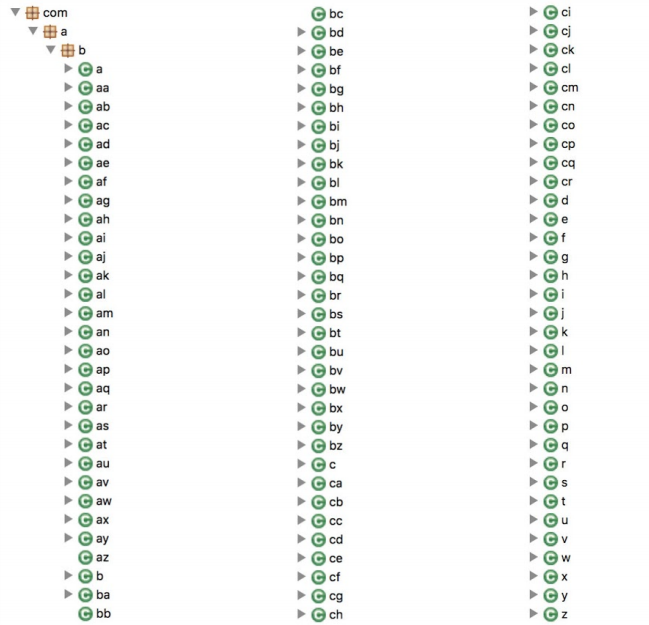
Code before matching: class, method, and package names obfuscated; hierarchy was flattened
After matching: class and method names restored, code hierarchy and packages restored (partially)
Installation
First, download the latest version of the compiled binary JebAndroidSigPlugin-x.y.z.jar and drop it into the JEB coreplugins/ folder. You will need a JEB Pro license for the plugin to operate.
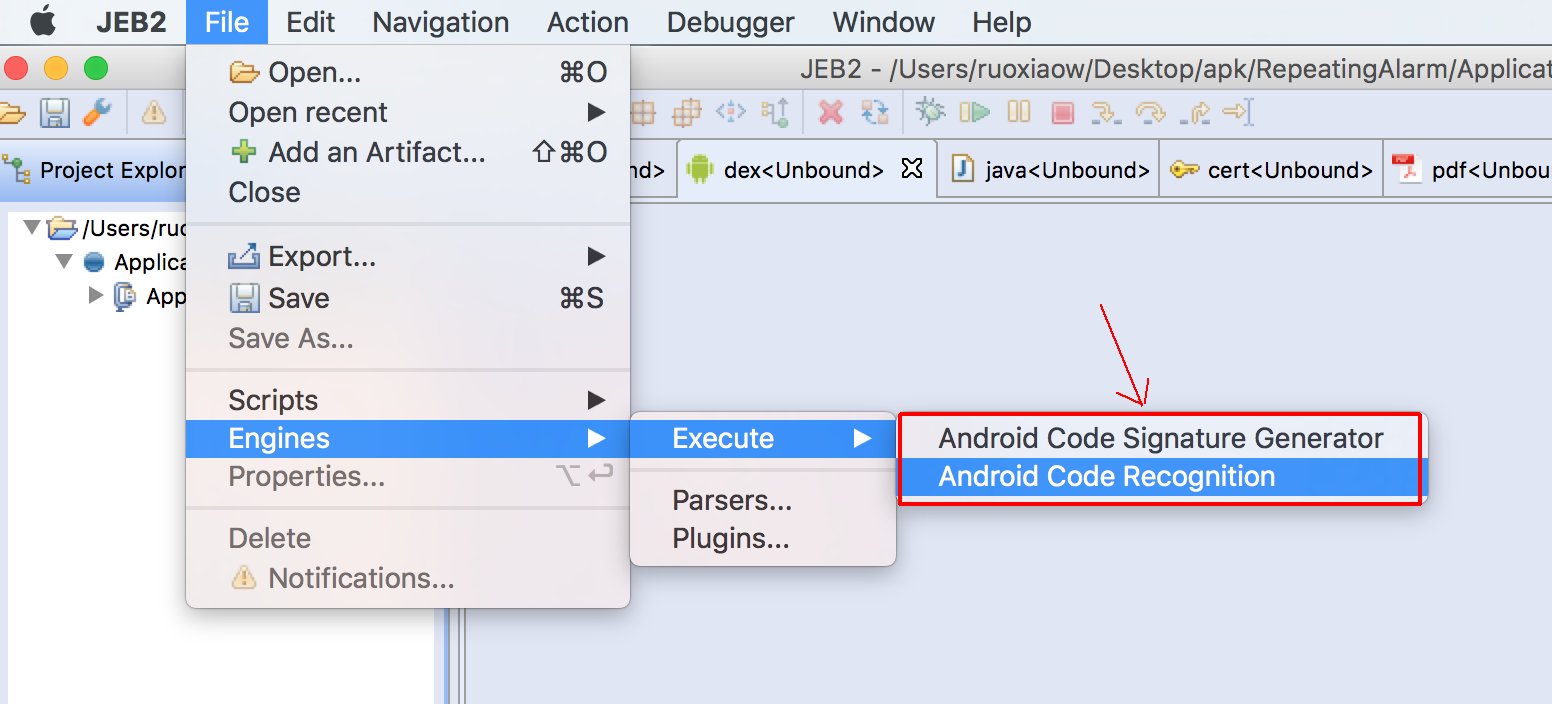
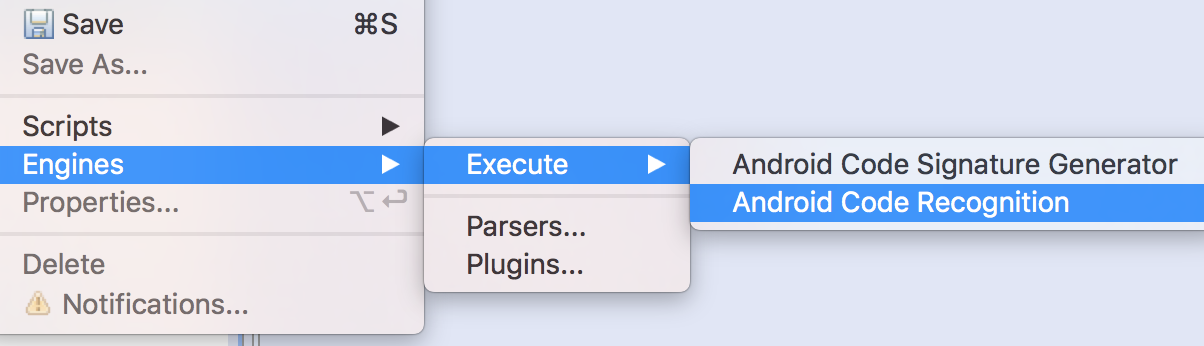
This single JAR offers two plugin entry-points, as can be seen in the picture below:
Secondly, download a bundle of signatures for various versions of the most common Android library.
Extract the contents of the archive into the coreplugins/android_sigs/ folder.
Matching obfuscated code
Open an Android APK or Dalvik DEX file to be analyzed
Execute the Android Code Recognition engines plugin
Customize the matching parameters, if necessary (See below for details)
Press OK. The code will be analyzed, and methods and classes that match signatures present in the database will be renamed and refactored.
Generating signatures
Generating your own library signatures (for library code, analyzed malware, or else) is as easy as its matching counterpart.
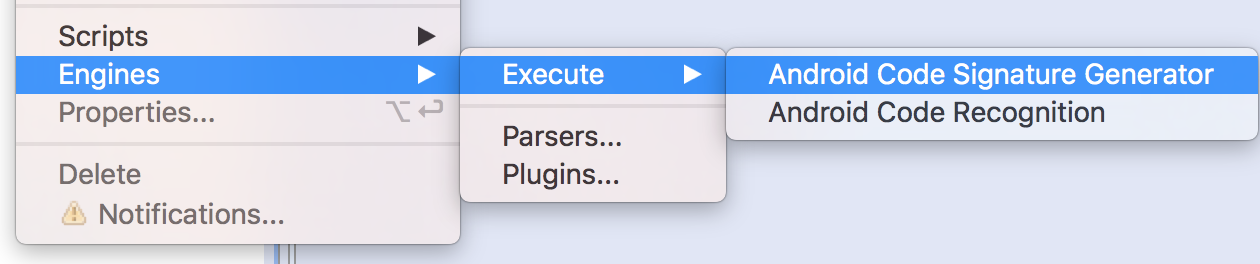
Open the APK containing the code to be signed
Execute the “Android Code Recognition” engines plugin
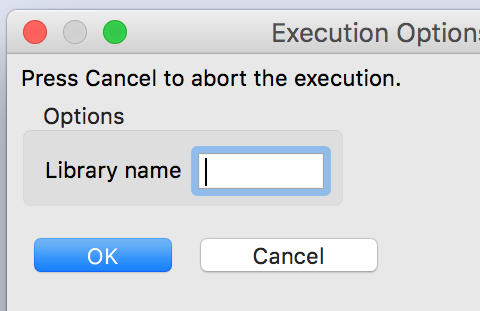
Specify the library name and other options
Press OK. The signature *.sig file will be created in the coreplugins/android_sigs/ folder. (Always make sure that all your signature files are in that folder.)
About the Matching Results
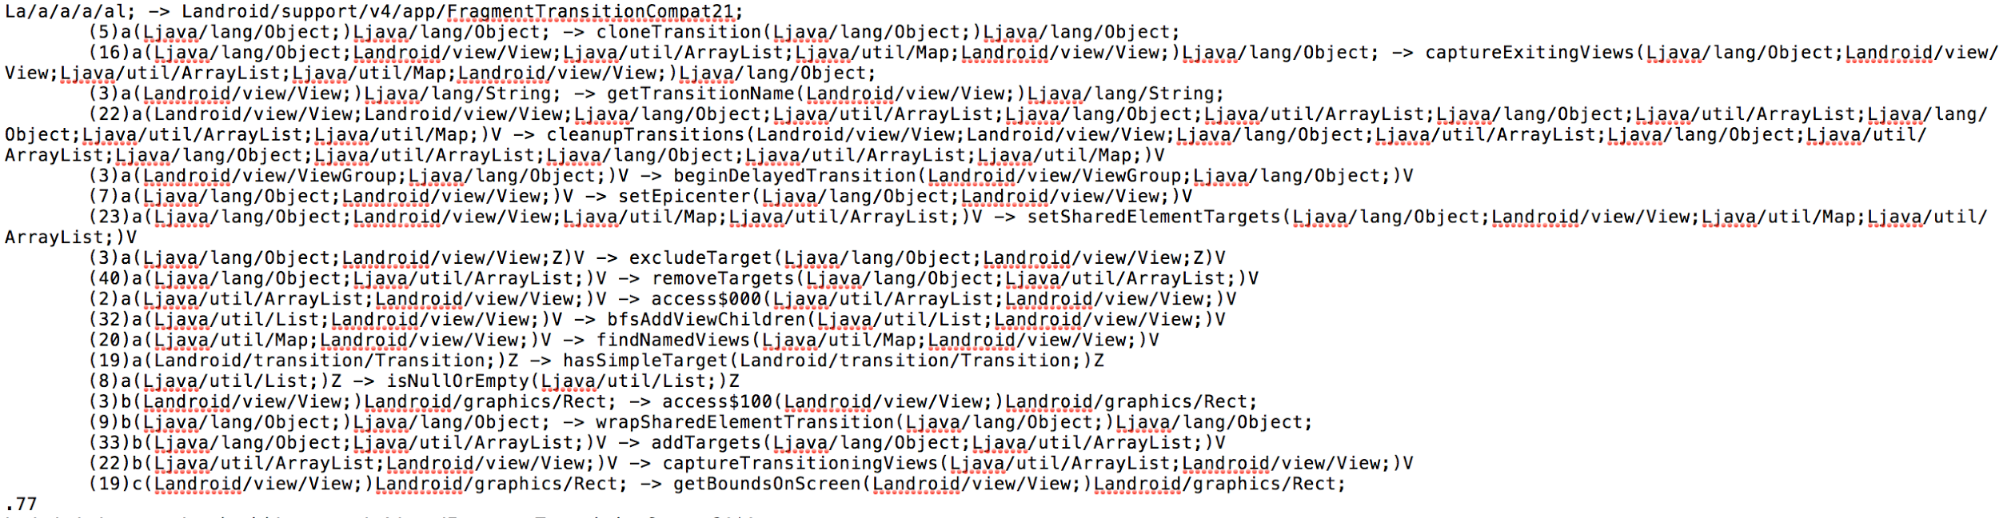
Upon successful execution, the matching plugin will generate two files in the temporary folder: androsig-mapping.txt and androsig-report.txt.
The mapping file shows which obfuscated methods and classes were matched, and to what:
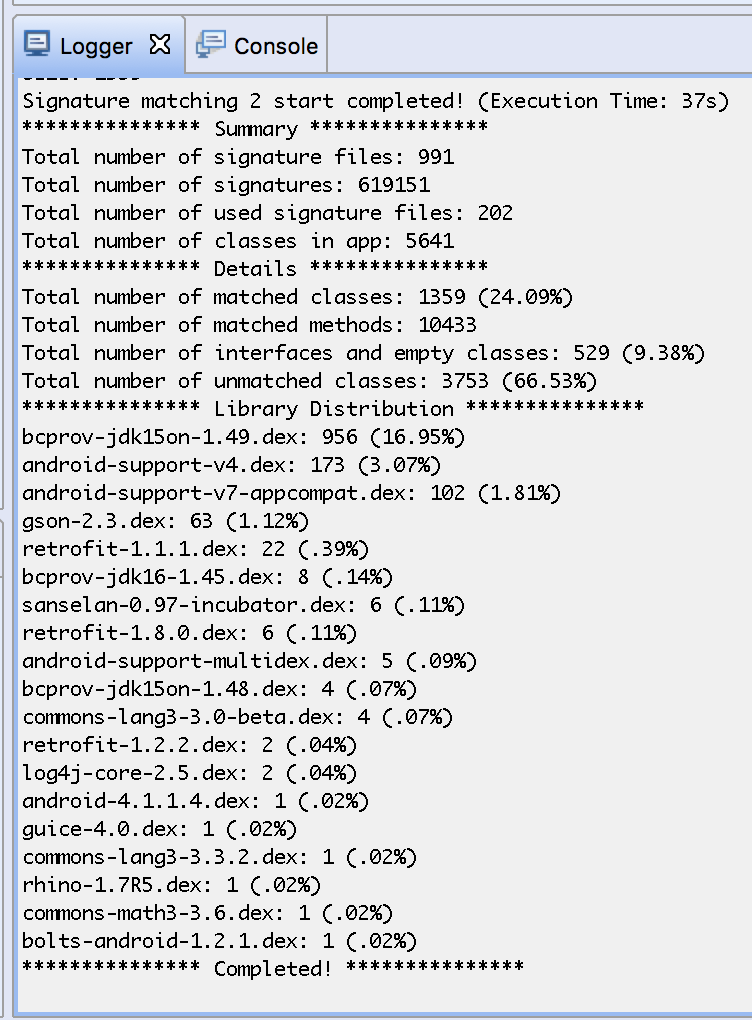
The report file gives you a summary of how many methods and classes were unmatched and matched, where they are coming from, as well as library distribution code. That result data is also output to the JEB logger:
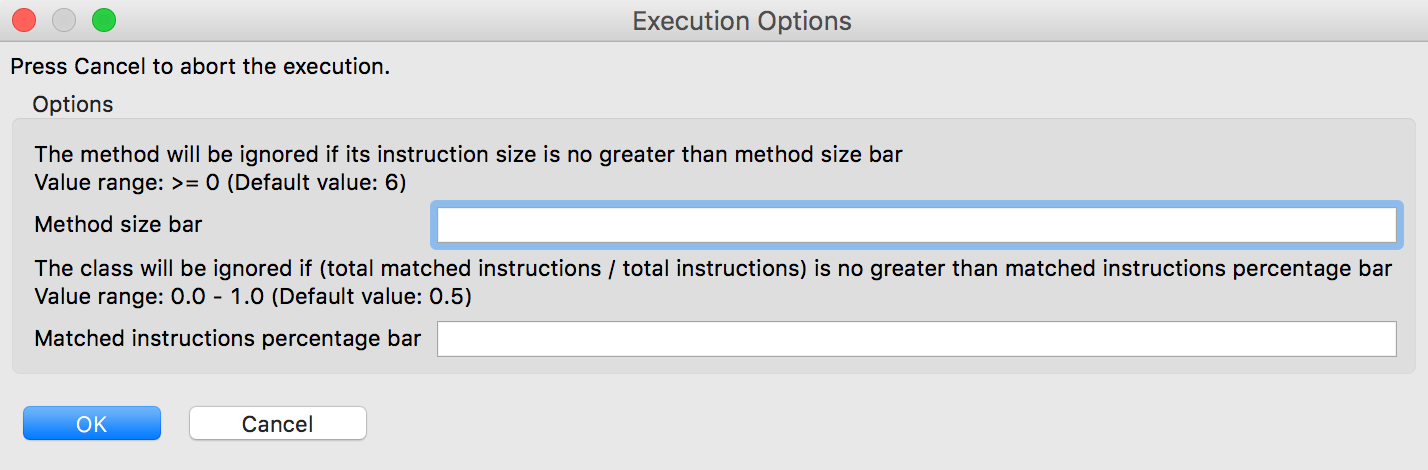
About the Matching Parameters
The matching process can be customized by two parameters, as shown on the picture below:
For most use cases, the default values will suffice. However, both parameters can be fine tuned to have more aggressive or less aggressive (looser) matching:
More aggressive matching will result in more matches, at the expense of false positives (FP in this context refer to methods or classes incorrectly matched)
Looser matching will result in less matches, at the expense of false negatives (FN in this context refer to methods or classes that should have been matched)
Typically, false positives happen on either small methods or classes containing lots of unmatched methods. Experiment with those parameters if need be; as said, the defaults generally yield correct results.
Also feel free to customize the plugin if need be, or use it as a learning tool and tutorial in order to bootstrap your own plugins development needs. It is by no means a robust plugin, but should help reverse engineers focus on code that matters (that is, non-library code) in the case of many Android applications.
In this short post, we will show how the debuggers API can be used to monitor an app execution, hook into various key methods and classes of the standard Java cryptography SPI, and extract input and output data, as they flow in and out encryption/decryption routines.
Very handy to retrieve encrypted data used within an app or exchanged with a remote server. 1 Check out the following video to see what we are talking about:
int update(byte[] input, int inputOffset, int inputLen, byte[] output)
When any of the hooked method is called, the associated hook onEntry method is executed, which will dump interesting input parameters
When the same hooked method returns, the associated hook onExit method is executed, which will dump interesting exit parameters and return value
The hook here consists of a double breakpoint, one triggered when a method is entered, another one, when it exits.
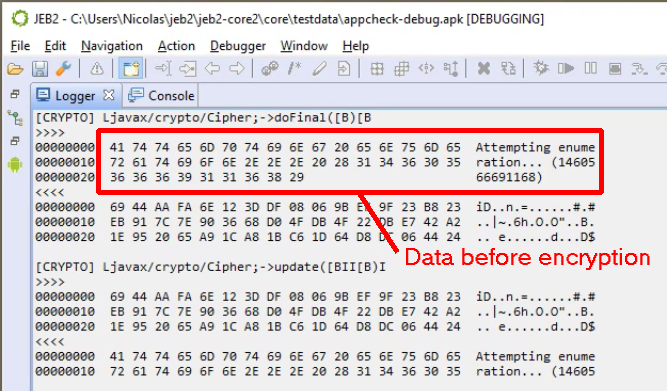
A hook on doFinal() capturing plain text data just before it gets encrypted
The code for that Java plugin is fairly simple. More hooks could be easily added, and hooks in native libraries could be set up in a similar fashion. Lastly, always keep in mind that the API in general (and this plugin in particular) can be leveraged by UI or headless clients. Automate things away if you need to.
The one and only entry-point for developer resources is our Developer Portal. Do not hesitate to reach out, publicly or privately, if you have issues or pointed questions. Thank you.
Dynamic execution monitoring can be achieved in several ways. Debugging a target is one of them. ↩
Dalvik and native code debugging has been supported in JEB since version 2.2:
Linux ELF and Windows PE code object support (32-bit and 64-bit)
Disassemblers for Intel x86 and x86-64, ARM 32-bit (including floating point support), ARM 64-bit (Aarch64) and MIPS.
Debuggers for Android Dalvik virtual machines and native Android processes
This post presents the details and caveats pertaining to the Android debuggers, shows how to debug APK’s Dalvik and native code, and explains the debuggers limitations.
An on-going debugging session of Android Dalvik and native ARM code.
Introduction
Debugging closed-source Android apps has historically been challenging at best, close to impossible at worst. JEB took a stab at solving this problem by abstracting away a wealth of low-level details and caveats related to debugging so that analysts can focus on the Dalvik code and associated decompiled Java source, as well as native code.
The Android debuggers make the task of reverse-engineering complex apps, e.g. those using a mix and bytecode and machine code, finally possible in practice. With the rise of app protectors and obfuscators, support for full-scale debugging has become more and more pressing. Earlier in February, we published a video highlighting one major feature of these debuggers: the ability to seamlessly debug to-and-from Dalvik and native code. We will explain in details how to use the features highlighted in the video.
Another area we will explore is the debugging API. The debuggers abide to the JEB IDebuggerUnit family set of interface. They can be used to automate debugging tasks, and allow for easy integration in analysis pipelines.
Requirements
The JEB Android debuggers run on all JEB-supported platforms (Windows, Linux, macOS). Please verify the following before attempting to start a debugging session:
Make sure to have the Android SDK installed. Ideally, you also want to have either ANDROID_SDK_ROOT or ANDROID_SDK environment variable pointing to the SDK folder.
Enable Developer options and allow USB debugging on the intended physical target device. (Debugging is enabled by default on the emulators.) On physical devices running Android 4.2 and above, one way to make sure of that is to run the adb devices command. If the device is shown as unauthorized, a pop-up on your phone will appear to request authorization.
Run the app in an emulator. Emulators have the ro.debuggable property set to 1. This means they will debug all apps, regardless of the debuggable flag in the Manifest.
Use a rooted phone. A rooted phone will allow you to modify the ro.debuggable property, and change it from 0 (standard on production devices) to 1. The rooting process is out-of-scope for this document: it is device specific and rooting instructions can easily be found online. As for ro.debuggable, we will explain how to change this system property in a separate blog entry.
Unpack/modify/repack your app. (Update: JEB can do this for you) Depending on whether the Manifest is obfuscated or not, this may be the simplest option. If the Manifest is obfuscated, the repacking process may not work. Another caveat applies: signing. You will have to sign the repacked app using your own key; be aware of the implications if you choose that option. 1
Caveat: Native code in non-debuggable apps
When it comes to debugging native code of non-debuggable apps on a rooted phone or emulator, other limitations apply. 2 JEB tries its best at abstracting them away. However, things might be unstable depending on which phone and OS is being used. Do not hesitate to let us know if you encounter issues.
Note that most of our tests are done on Nexus devices running vanilla Android 5.1 and 6.0. Using similar devices for debugging will likely reduce the chances of running into corner-case problematic situations.
Starting a debugging session
Currently, JEB can start Android debugging sessions only when analyzing APK files. If your main artifact in JEB is an orphan DEX file, the UI client will refuse to start a debugging session.
First, retrieve your target APK and get the app ready for debugging:
Make sure the APK matches the one that will be executed on the target phone. You can download the APK using adb3:
adb shell pm list packages -f to retrieve a list of packages and the associated path to APK
adb pull <pathToAPK> to download the APK
Start the app on the phone
Via the App Launcher for instance, if attaching to an already running app is an acceptable scenario
If you want the app to wait for the debuggers to attach to it before it starts executing any code, you can run something like: adb shell am start -D -S -n <packageName>/<activityName>
A popup will be displayed on the phone, indicating it is waiting for a debugger to attach to the VM
Second, in the RCP desktop client:
Start an analysis of the APK file
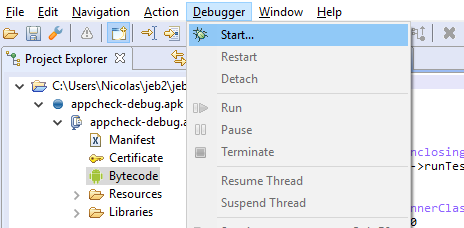
Open a view of a main DEX file
Once the focus is on the DEX view, open the Debugger menu, and click on Start…
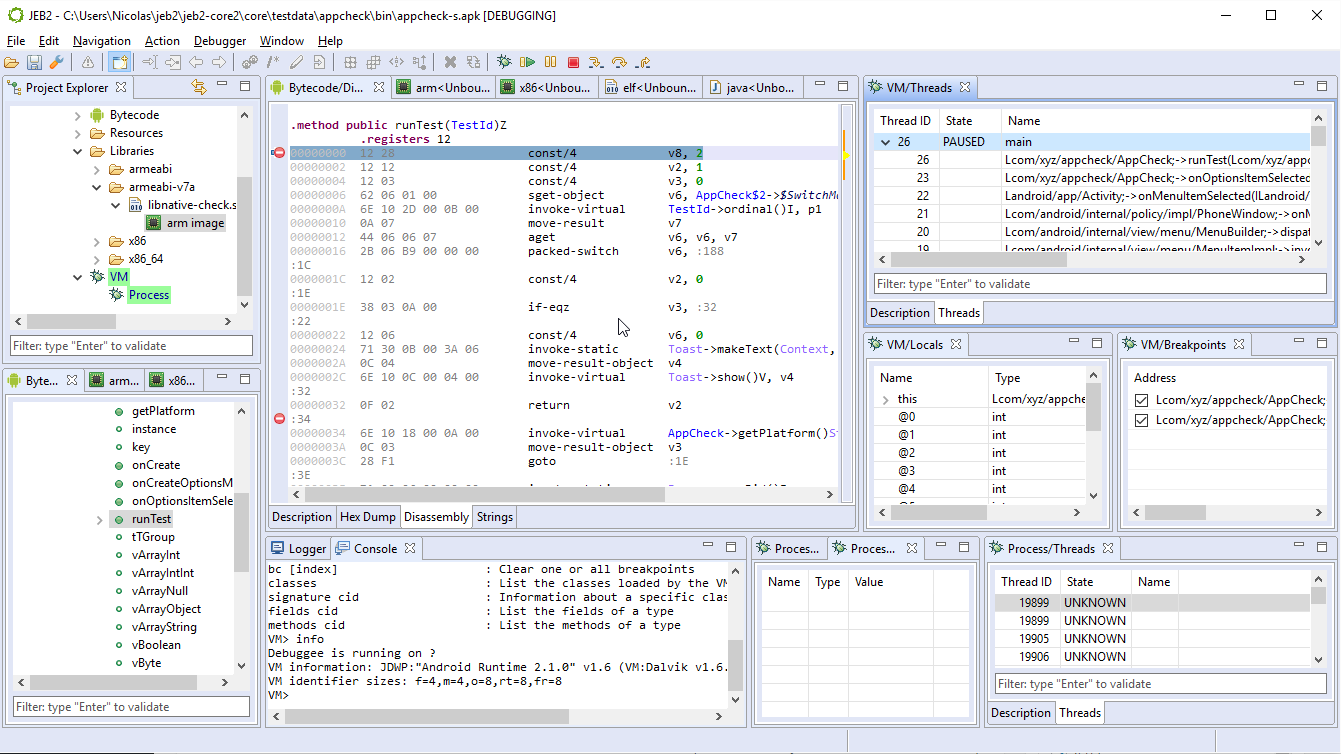
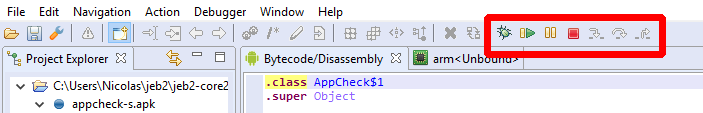
The Debugger/Start, used to start or attach a debugger, is available once the code view of a support Code unit has the focus. Here, the focus was on Dalvik bytecode.
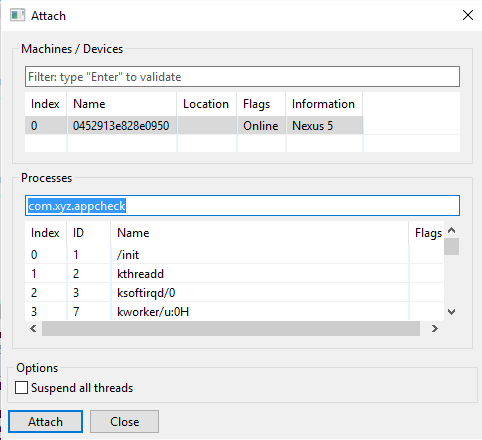
In the Attach dialog window:
Select the target phone and the target process that matches your app, and click Attach.
Unless you tick the “Suspend all threads”, The app will be immediately be run/resumed after attaching.
The process filter is normally filled out with the APK package name. Simply press enter to filter out entries.
(No longer the case) Your entry must have a D flag. This flag indicates that the target device will accept incoming debugger-attach requests to the target process. If you are trying to attach to an entry that does not have this flag, the operation will fail.
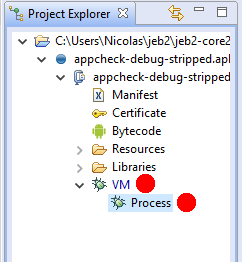
After attaching, the app, you should see one or two additional nodes in the Project tree view.
If the app does not contain native code: there will be one node, representing the Dalvik VM debugger
If the app contains native libraries (*.so files in lib/ folders): there will be an additional node to represent the native code debugger
When a debugger is successfully attached, the corresponding node has a light green background.
Example: Two debugger nodes (VM, Process) currently not yet attached to the target
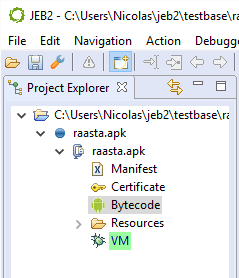
Example: One debugger node (Dalvik only) currently attached to the target
Views and layout
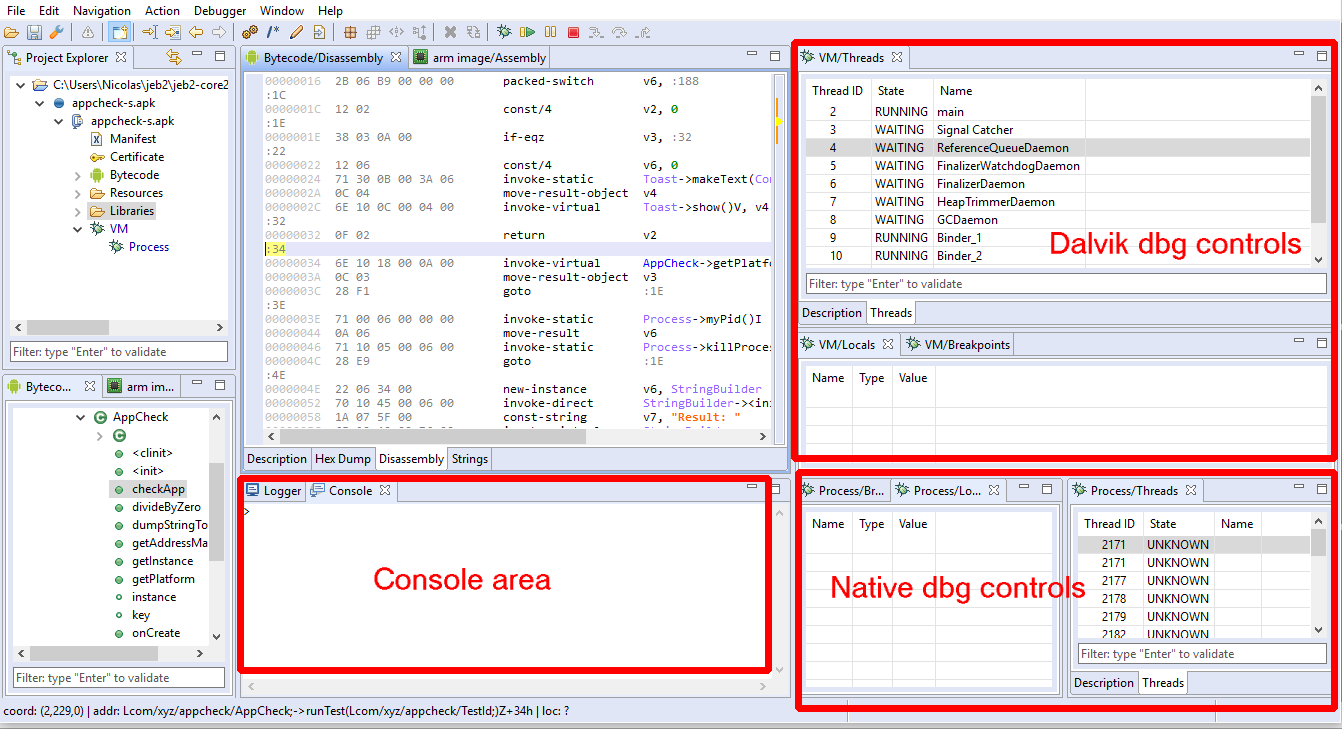
Open the VM debugger views by double-clicking the VM unit node. At this point, you will want to customize your layout: debugger views can seriously clutter the workspace area. See an example of customized layout below:
This customized layout shows: – the code hierarchies (Dalvik, Native) in the lower left corner – the VM debugger views stacked on the top right corner – the Process debugger views stacked on the lower right corner – the Console and Logs at the bottom
Layouts can be customized via the Window menu; more details can be found in a previous blog entry.
The debuggers should now be attached.
The Process debugger is never paused after attaching
The VM debugger is paused if and only if the “suspend threads” option box was ticked
Keep in mind that pausing the Process debugger (ie, suspending the native threads) will obviously freeze the higher-level Dalvik VM!
Next up, let’s review the debugger controls and controls.
Basic debugger controls via the UI
Active debugger
The most important thing to remember about debugger controls is that the UI controls affect the debugger related to the view currently focused.
Unlike most tools, JEB allows multiple debuggers and debugging sessions to take place at once. Therefore, be mindful of which debugger is being controlled when pressing menu entries or toolbar buttons: If the focus is within the DEX view or any VM debugger view, the controls are connected to the VM debugger; if the focus is within a code view connected to the Process debugger, the controls are connected to the Process debugger.
Controls
Basic debugger controls can be accessed via the Debugger menu or the toolbar area. They allow:
Attaching, detaching, terminating the process
Pausing and resuming the process and, possibly, its individual threads
The toolbar contains a subset of the most common and useful controls, that are also accessible via the Debugger menu.
Not all controls can or are implemented for all debuggers. Currently for instance, pausing individual threads of the Process debugger is not possible. When a control is not available, depending on which control it is and the severity of the failed operation, the user may be unable to activate it (eg, grayed button), receive an error in the logger, or receive a pop-up error in the client.
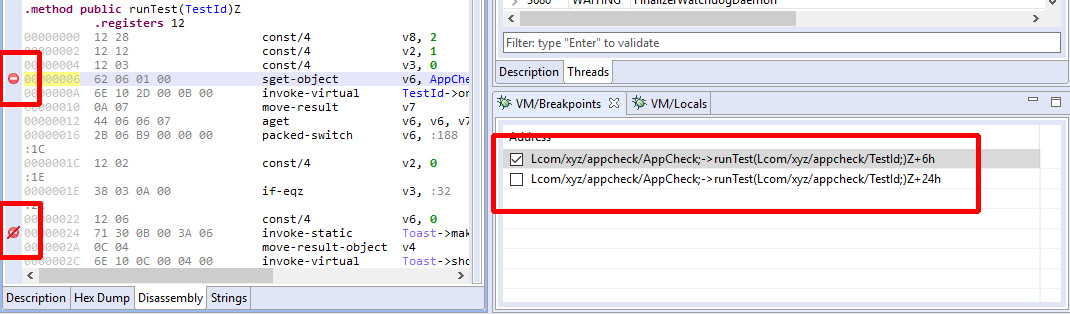
Breakpoints can be set/unset using the handy Control+B (or Command+B) shortcut. An icon is displayed in the left vertical bar of a code view to represent enabled/disabled breakpoints .
One enabled and one disabled breakpoints.
Debugger views
Here are some of the views rendered by the UI client when visualizing a debugger unit. (Other views were added over time.)
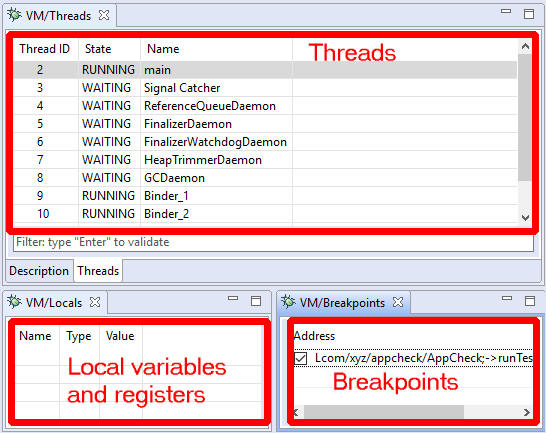
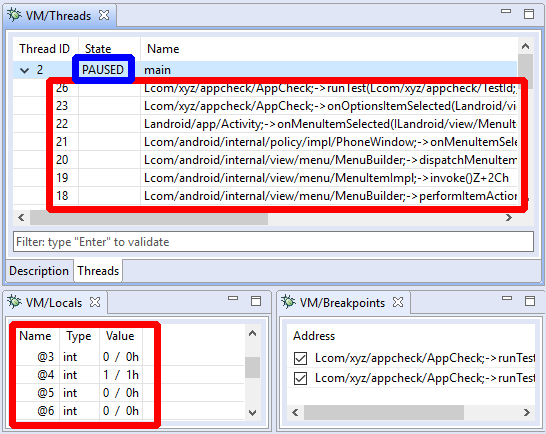
The Threads view displays thread identifiers, status (running, suspended, waiting, etc.) as well as the stackframes when a thread is paused. Depending on the target processor, there may be one or more stackframes, showing the location (program counter register or address) of the current thread.
The Breakpoints view displays active and inactive code breakpoints. (More on breakpoints and breakpoint types later.)
The Locals view shows the generic variables registers. They can be virtual slots of a VM, registers of a native process, complex variables inferred by the decompiler, etc.
Debugger views of a running Dalvik VM
Debugger views of a paused Dalvik VM. Stackframes are visible, along with some local variables.
Every debugger has specifics that are relevant to the target being debugged. While the JEB API and front-end are trying to abstract the nitty-gritty details away, there are times when generic controls are not enough. In the next section, we discuss how users can issue such commands via the debugger console.
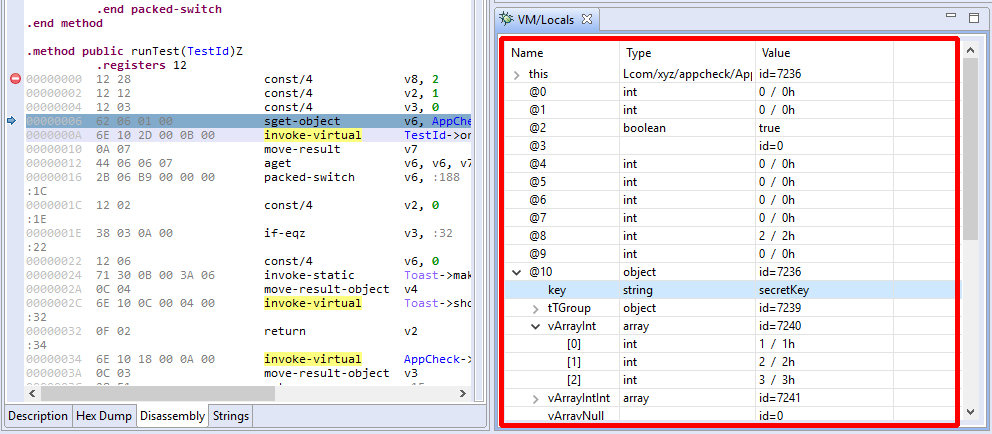
In the case of the Dalvik VM, the Locals view can be used to display complex objects or arrays, as is shown below:
Variables view of the top-level frame of a suspended Dalvik thread
In the case of local variables, the type of a Dalvik slot (v0, v1, etc. ) is usually inferred thanks to the Dalvik decompiler. A JEB build that does not ship with the decompiler will not be able to display most frame variables accurately.
Live variables overlays
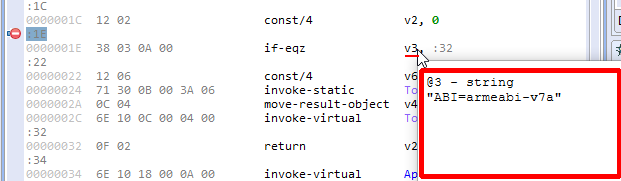
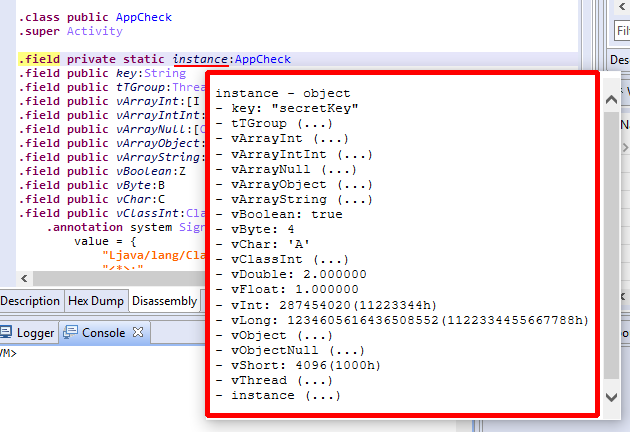
When a thread is paused, the debuggers (native as well as Dalvik’s) provide overlay information when the mouse cursor hovers over registers, variables, class fields, or any other visual element that holds data.
Overlay on a Dalvik frame variable
Overlay on a class instance field
In the case of the Dalvik debugger, overlays also work in Java decompiled views.
Advanced controls via the console
The debugger units make use of the IUnit.getCommandInterpreter method to provide clients with command interpreters to execute advanced debugger commands, that may not be readily made available by graphical clients.
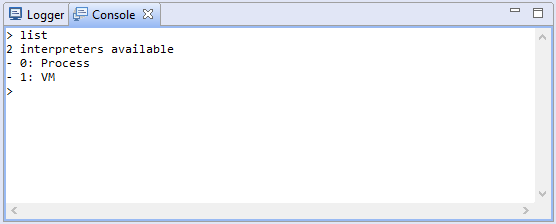
In the UI client, command interpreters offered by units are accessible via the Console tab. Once the Android debuggers are attached, switch over to the Console view, and type list. This command will list all command interpreters currently attached to the console:
Two interpreters are made available, one by the VM debugger, another one by the Process debugger
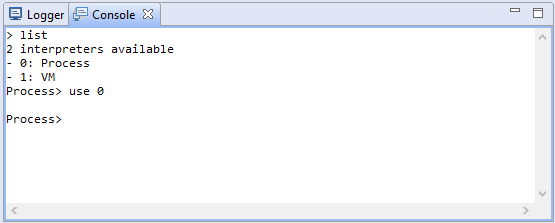
An interpreter has a numeric id as well as the name of the unit that created it. Switch to an interpreter with the use <id|name> command.
Switching to the interpreter connected to the Process debugger
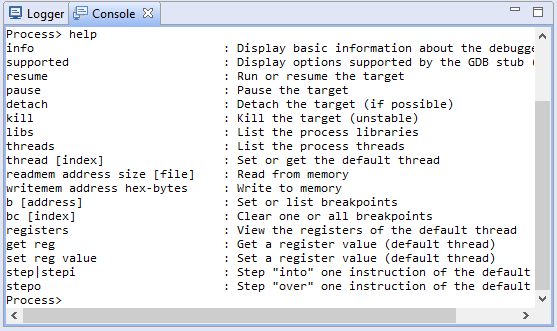
The special command help, available in all interpreter contexts, lists all commands made available by the interpreter currently in use.
Functions provided by the Process debugger interpreter
In this example, we can see that the Process debugger offers ways to read and write to memory, set registers, and also issue low-level GDB commands (use this option carefully).
Settings
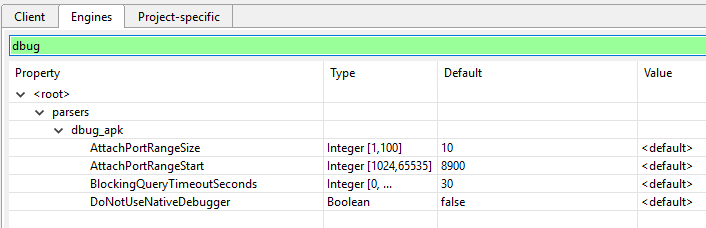
The Android debuggers offer options to control low-level debugger parameters, such as ports and timeouts.
The .parsers.dbug_apk.* engines options
If you wish to disable native debuggers entirely, set the DoNotUseNativeDebugger to true.
API for Scripting and Automation
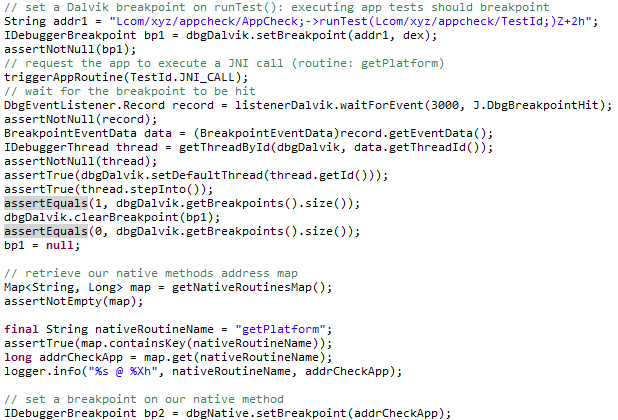
Debugger modules in JEB implement the set of interfaces contained in the com.pnfsoftware.jeb.core.units.code.debug public package. The principal interface in this package is IDebuggerUnit. Plugins, scripts, or third-party clients wishing to automate the usage of debuggers can us these well-defined interfaces. The official UI client uses this public API. Anything that the UI client does (and more) can be done and/or automated by third-party code.
Within the next couple of weeks, we will upload sample code on our GitHub repository demonstrating how to use the JEB Debugger API.
Sample code making use the of the JEB Debugger API
More on scripting: https://www.pnfsoftware.com/blog/crypto-monitoring-android-debuggers-api/
-nicolas
A technical implication is that apps performing health checks such as signature verification can easily detect that they have been signed by an unauthorized key. But then again, running an app on a rooted phone or an emulator is also something easily detectable. Each method has its advantages and shortcomings, be aware of them. ↩
They mostly have to do with the run-as Android utility. JEB ships with a modified version of the utility to allow debugging the native code part of non-debuggable apps. ↩
We strongly recommend our users to get familiar with the Android system tools and debugging tools ecosystem, in particular adb, am, and pm. ↩
Toggling breakpoints on and off is currently not available in decompiled views. ↩