Disclaimer: a long time ago in our galaxy, we published part 1 of this blog post; then we decided to wait for the next major release of JEB decompiler before publishing the rest. A year and a half later, JEB 4.0 is finally out! So it is time for us to publish our complete adventure with MarsAnalytica crackme. This time as one blog covering the full story.
In this blog post, we will describe our journey toward analyzing a heavily obfuscated crackme dubbed “MarsAnalytica”, by working with JEB’s decompiled C code 1.
To reproduce the analysis presented here, make sure to update JEB to version 4.0+.
Part 1: Reconnaissance
MarsAnalytica crackme was created by 0xTowel for NorthSec CTF 2018. The challenge was made public after the CTF with an intriguing presentation by its author:
My reverse engineering challenge ‘MarsAnalytica’ went unsolved at #nsec18 #CTF. Think you can be the first to solve it? It features heavy #obfuscation and a unique virtualization design.
0xTowel
Given that exciting presentation, we decided to use this challenge mainly as a playground to explore and push JEB’s limits (and if we happen to solve it on the road, that would be great!).
The MarsAnalytica sample analyzed in this blog post is the one available on 0xTowel’s GitHub 2. Another version seems to be available on RingZer0 website, called “MarsReloaded”.
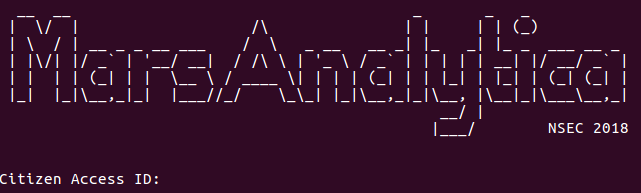
So, let’s examine the beast! The program is a large x86-64 ELF (around 10.8 MB) which, once executed, greets the user like this:
Inserting a dummy input gives:
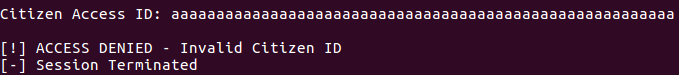
It appears we have to find a correct Citizen ID! Now let’s open the executable in JEB. First, the entry point routine:
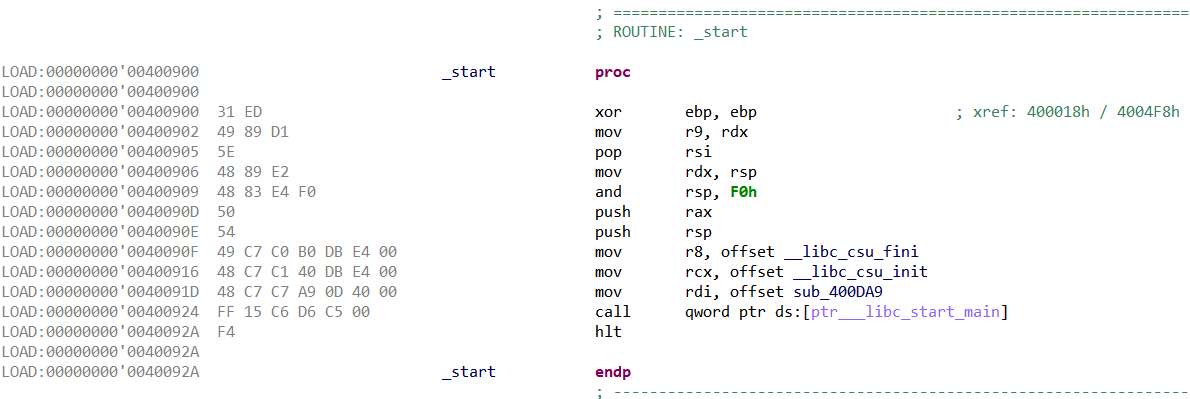
Ok, the classic libc entry point, now let’s look at strings and imports:
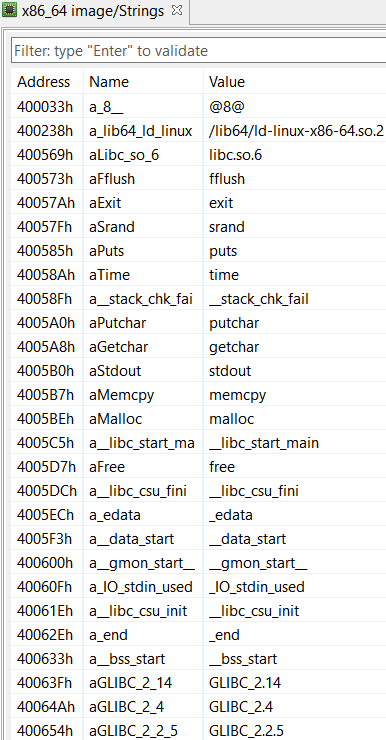
Strings 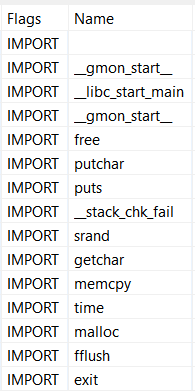
Imports
A few interesting imports: getchar() to read user input, and putchar() and puts() to write. Also, some memory manipulation routines, malloc() and memcpy(). No particular strings stand out though, not even the greeting message we previously saw. This suggests we might be missing something.
Actually, looking at the native navigation bar (right-side of the screen by default), it seems JEB analyzed very few areas of the executable:

(green is cursor’s location, grey represents area without any code or data)
To understand what happened let’s first look at JEB’s notifications window (File > Notifications):
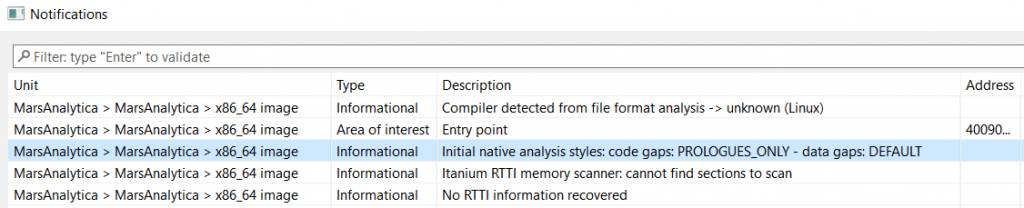
An interesting notification concerns the “Initial native analysis styles”, which indicates that code gaps were processed in PROLOGUES_ONLY mode (also known as a “conservative” analysis). As its name implies, code gaps are then disassembled only if they match a known routine prologue pattern (for the identified compiler and architecture).
This likely explains why most of the executable was not analyzed: the control-flow could not be safely followed and unreferenced code does not start with common prologue patterns.
Why did JEB used conservative analysis by default? JEB usually employs aggressive analysis on standard Linux executables, and disassembles (almost) anything within code areas (also known as “linear sweep disassembly”). In this case, JEB went conservative because the ELF file looks non-standard (eg, its sections were stripped).
Explore The Code (At Assembly Level)
Let’s take a look at the actual main() (first argument of __libc_start_main()):
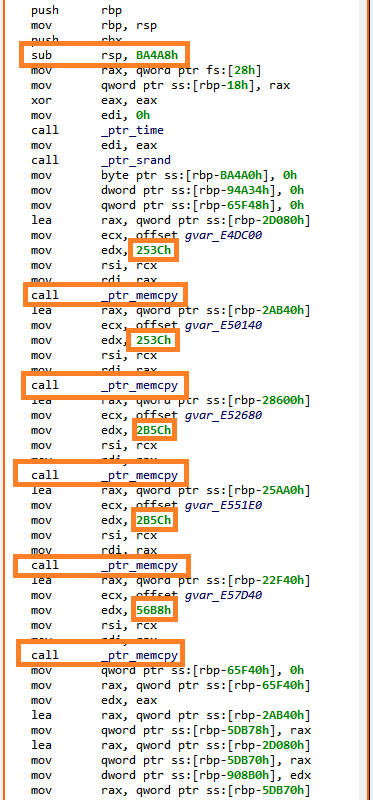
main() code
(part 1)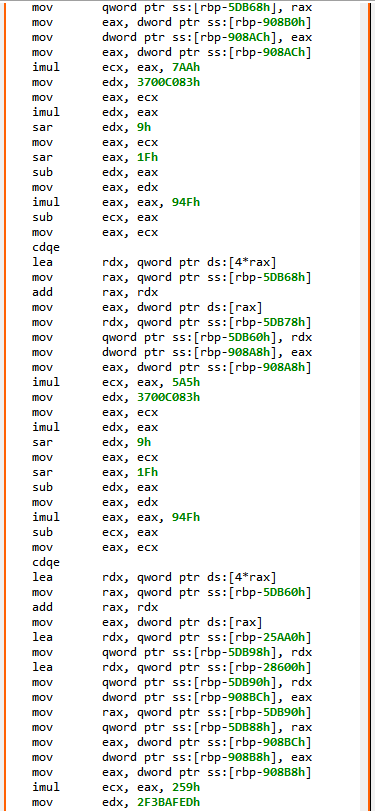
main() code
(part 2)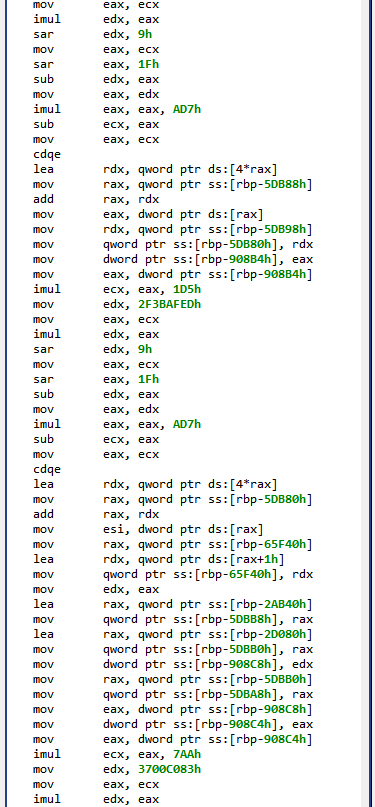
main() code
(part 3)
(part 4)
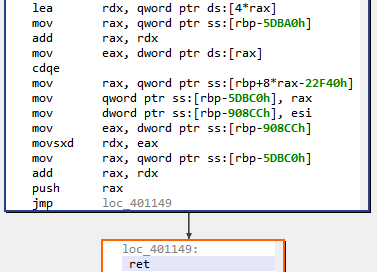
Ok… that’s where the fun begins!
So, first a few memcpy() to copy large memory areas onto the stack, followed by series of “obfuscated” computations on these data. The main() routine eventually returns on an address computed in rax register. In the end, JEB disassembler was not able to get this value, hence it stopped analyzing there.
Let’s open the binary in JEB debugger, and retrieve the final rax value at runtime: 0x402335. We ask JEB to create a routine at this address (“Create Procedure”, P), and end up on very similar code. After manually following the control-flow, we end up on very large routines — around 8k bytes –, with complex control-flow, built on similar obfuscated patterns.
And yet at this point we have only seen a fraction of this 10MB executable… We might naively estimate that there is more than 1000 routines like these, if the whole binary is built this way (10MB/8KB = 1250)!
Most obfuscated routines re-use the same stack frame (initialized in main() with the series of memcpy()). In others words, it looks like a very large function has been divided into chunks, connected through each other by obfuscated control flow computations.
At this point, it seems pretty clear that a first objective would be to properly retrieve all native routines. Arguably the most robust and elegant way to do that would be to follow the control flow, starting from the entry point routine . But how to follow through all these obfuscated computations?
Explore The Code (At C Level)
Let’s now take a look at the pseudo-C code produced by JEB for those first routines. For example, here is main():
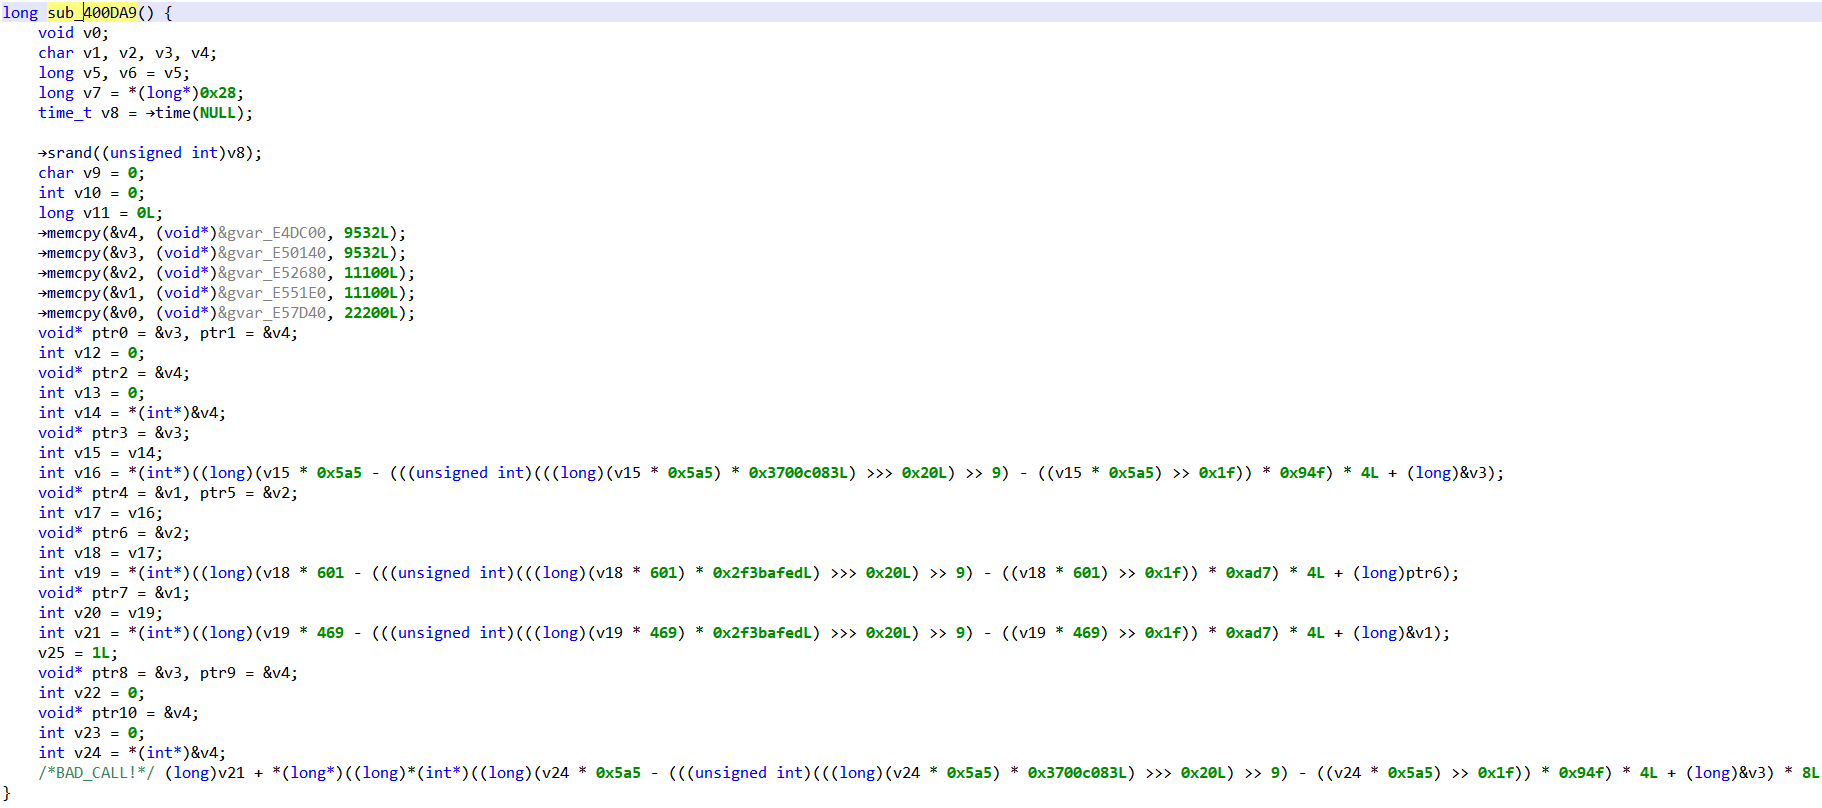
Overall, around 40 lines of C code, most of them being simple assignments, and a few others being complex operations. In comparison to the 200 non-trivial assembly instructions previously shown, that’s pretty encouraging.
What Do We Know
Let’s sum up what we noticed so far: MarsAnalytica’s executable is divided into (pretty large) handler routines, each of them passing control to the next one by computing its address. For that purpose, each handler reads values from a large stack, make a series of non-trivial computations on them, then write back new values into the stack.
As originally mentioned by 0xTowel, the crackme author, it looks like a virtual-machine style obfuscation, where bytecodes are read from memory, and are interpreted to guide the execution. It should be noted that virtual machine handlers are never re-executed: execution seems to go from lower to higher addresses, with new handlers being discovered and executed.
Also, let’s notice that while the executable is strongly obfuscated, there are some “good news”:
- There does not seem to be any self-modifying code, meaning that all the code is statically visible, we “just” have to compute the control-flow to find it.
- JEB decompiled C code looks (pretty) simple, most C statements are simple assignments, except for some lengthy expression always based on the same operations; the decompilation pipeline simplified away parts of the complexity of the various assembly code patterns.
- There are very few subroutines called (we will come back on those later), and also a few system APIs calls, so most of the logic is contained within the chain of obfuscated handlers.
What Can We Do
Given all we know, we could try to trace MarsAnalytica execution by implementing a C emulator working on JEB decompiled code. The emulator would simulate the execution of each handler routine, update a memory state, and retrieve the address of the next handler.
The emulator would then produce an execution trace, and provide us access to the exact memory state at each step. Hence, we should find at some point where the user’s input is processed (typically, a call to getchar()), and then hopefully be able to follow how this input gets processed.
The main advantage of this approach is that we are going to work on (small) C routines, rather than large and complex assembly routines.
There are a few additional reasons we decided to go down that road:
– The C emulator would be architecture-independent — several native architectures are decompiled to C by JEB –, allowing us to re-use it in situations where we cannot easily execute the target (e.g. MIPS/ARM).
– It will be an interesting use-case for JEB public API to manipulate C code. Users could then extend the emulator to suit their needs.
– This approach can only work if the decompilation is correct, i.e. if the C code remains faithful to the original native code. In other words, it allows to “test” JEB decompilation pipeline’s correctness, which is — as a JEB’s developer — always interesting!
Nevertheless, a major drawback of emulating C code on this particular executable, is that we need the C code in the first place! Decompiling 10MB of obfuscated code is going to take a while; therefore this “plan” is certainly not the best one for time-limited Capture-The-Flag competitions.
Part 2: Building a (Simple) C Emulator
The emulator comes as a JEB back-end plugin, whose code can be found on our GitHub page. It starts in CEmulatorPlugin.java, whose logic can be roughly summarized as the following pseudo-code:
emulatorState = initEmulatorState();
while(true) {
  handlerRoutine = analyze(handlerAddress) // disassemble and decompile
  emulatorState = emulator.emulate(handlerRoutine, emulatorState);

  handlerAddress = emulatorState.getNextHandlerAddress();
  if(handlerAddress.isUnknown()){
    break;
  }
}
In this part we will focus on emulate() method. This method’s purpose is to simulate the execution of a given C routine from a given machine state, and to provide in return the final machine state at the end of the routine.
Decompiled C Code
First thing first, let’s explore what JEB decompiled code looks like, as it will be emulate() input. JEB decompiled C code is stored in a tree-structured representation, akin to an Abstract Syntax Tree (AST).
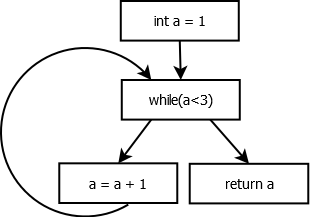
For example, let’s take the following C function:
int myfunction()
{
    int a = 1;
    while(a < 3) {
        a = a + 1;
    }
    return a;
}
The JEB representation of myfunction body would then be:
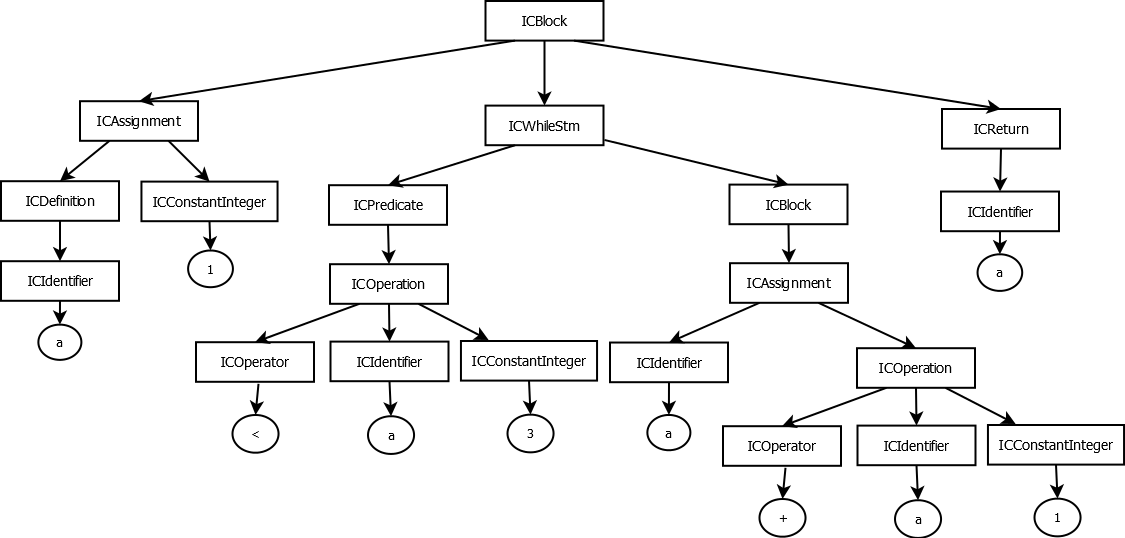
(rectangles are JEB interfaces, circles are values)
As of JEB 4.0, the hierarchy of interfaces representing AST elements (i.e. nodes in the graph) is the following:
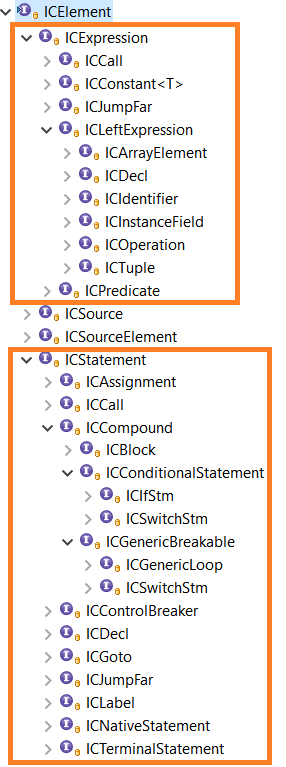
Two parts of this hierarchy are of particular interest to us, in the context of building an emulator:
- ICExpression represents C expressions, for example ICIdentifier (a variable), or ICOperation (any operation). Our emulator is going to evaluate those expressions, i.e. assign concrete values to them.
- ICStatement represents C statements, including notably loops (ICForLoopStm, ICWhileLoopStm), and if statements (ICIfStm). Our emulator is going to execute those statements.
Now, a method’s AST can be retrieved with JEB API by using INativeDecompilerUnit.decompile() (see CEmulatorPlugin.disassembleAndDecompile() for how to disassemble and decompile a not-yet-existing routine).
Where Is The Control Flow?
While an AST provides a precise representation of C elements, it does not provide explicitly the control flow. That is, the order of execution of statements is not normally provided by an AST, which rather shows how some elements contain others from a syntactic point-of-view.
In order to simulate a C function execution, we are going to need the control flow. So here is our first step: compute the control flow of a C method and make it usable by our emulator.
To do so, we implemented a very simple Control-Flow Graph (CFG), which is computed from an AST. The code can be found in CFG.java, please refer to the documentation for the known limitations.
Here is for example the CFG for the routine previously presented myfunction():
Why does JEB does not provide a CFG for decompiled C code? Mainly because at this point JEB decompiler does not need it. Most important optimizations are done on JEB Intermediate Representation — for which there is indeed a CFG. On the other hand, C optimizations are mainly about “beautifying” the code (i.e. pure syntactic transformations), which can be done on the AST only 3.
Emulator Implementation
The main logic of the emulator can be found in emulate(ICMethod method, EmulatorState inputState), which emulates a whole C method from a given input state:
CFG cfg = CFG.buildCFG(method);
ICStatement currentStatement = cfg.getEntryPoint();

while(currentStatement != null) {
   currentStatement = emulateStatement(cfg, currentStatement);
}
Before digging into the emulation logic, let’s see how emulator state is represented and initialized.
Emulator State
The emulator state is a representation of the machine’s state during emulation; it mainly comprehends the state of the memory and of the CPU registers.
The memory state is a IVirtualMemory object — JEB interface to represent virtual memory state. This memory state is created with MarsAnalytica executable initial memory space (set by JEB loader), and we allocate a large area at an arbitrary address to use as the stack during emulation:
// initialize from executable memory
memory = nativeUnit.getMemory();

// allocate large stack from BASE_STACK_POINTER_DEFAULT_VALUE (grows downward)
VirtualMemoryUtil.allocateFillGaps(memory, BASE_STACK_POINTER_DEFAULT_VALUE - 0x10_0000, 0x11_0000, IVirtualMemory.ACCESS_RW);
The CPU registers state is simply a Map from register IDs — JEB specific values to identify native registers — to values:
Map<Integer, Long> registers = new HashMap<>();
Emulator Logic
The emulator processes each ICStatement in two steps (see emulateStatement()):
- Update the state according to the statement semantic, i.e. propagate all side-effects of the statement to the emulator state.
- Determine which statement should be executed next; this might involve evaluating some predicates.
For example, let’s examine the logic to emulate a simple assignment like a = b + 0x174:
void evaluateAssignment(ICAssignment assign) {
  // evaluate right-hand side
  Long rightValue = evaluateExpression(assign.getRight());

  // assign to left-hand side
  state.setValue(assign.getLeft(), rightValue);
}
The method evaluateExpression() is in charge of getting a concrete value for a C expression (i.e. anything under ICExpression), which involves recursively processing all the subexpressions of this expression.
In our example, the right-hand side expression to evaluate is an ICOperation (b + 0x17). Here is the extract of the code in charge of evaluating such operations:
Long evaluateOperation(ICOperation operation) {
        ICExpression opnd1 = operation.getFirstOperand();
        ICExpression opnd2 = operation.getSecondOperand();
        ICOperator operator = operation.getOperator();

        switch(operator.getType()) {
        case ADD:
            return evaluateExpression(opnd1) + evaluateExpression(opnd2);

[...REDACTED...]
Therefore, we simply compute a concrete result using the corresponding Java operators for each ICOperator, and recursively evaluate the operands.
Now, evaluating variable b means either reading memory or a register, depending on where b is mapped:
Long getVarValue(ICIdentifier id) {
  // read memory for local/global variables...
  if(id.getIdentifierClass() == CIdentifierClass.LOCAL || id.getIdentifierClass() == CIdentifierClass.GLOBAL) {
      return readMemory(getVarAddress(id), getTypeSize(id.getType()));
  }
  // ...otherwise read CPU register
  else {
      return registers.get(id.getId());
  }
}
If b is a local variable, i.e. mapped in stack memory, the method ICIdentifier.getAddress() provides us its offset from the stack base address. Also note that an ICIdentifier has an associated ICType, which provides us the variable’s size (through the type manager, see emulator’s getTypeSize()).
Finally, evaluating constant 0x17 in the operation b + 0x17 simply means returning its raw value:
if(expr instanceof ICConstantInteger) {
    return ((ICConstantInteger<?>)expr).getValueAsLong();
}
For statements with more complex control flow than an assignment, the emulator has to select the correct next statement from the CFG. For example, here is the emulation of a while loop wStm (ICWhileStm):
// if predicate is true, next statement is while loop body...
if(evaluateExpression(wStm.getPredicate()) != 0) {
   return cfg.getNextTrueStatement(wStm);
}
// ...otherwise next statement is the one following while(){..}
else {
   return cfg.getNextStatement(wStm);
}
Refer to the complete implementation for more glory details.
Emulating System APIs
In MarsAnalytica there are only a few system APIs that get called during the execution. Among those APIs, only memcpy() is actually needed for our emulation, as it serves to initialize the stack (remember main()). Here is the API emulation logic:
Long simulateWellKnownMethods(ICMethod calledMethod,
            List<ICExpression> parameters) {

        if(calledMethod.getName().equals("→time")) {
            return 42L; // value does not matter
        }
        else if(calledMethod.getName().equals("→srand")) {
            return 37L; // value does not matter
        }
        else if(calledMethod.getName().equals("→memcpy")) {
            ICExpression dst = parameters.get(0);
            ICExpression src = parameters.get(1);
            ICExpression n = parameters.get(2);
            // evaluate parameters concrete values
            [...REDACTED...]
            state.copyMemory(src_, dst_, n_);
            return dst_;
          }
       }
}
Demo Time
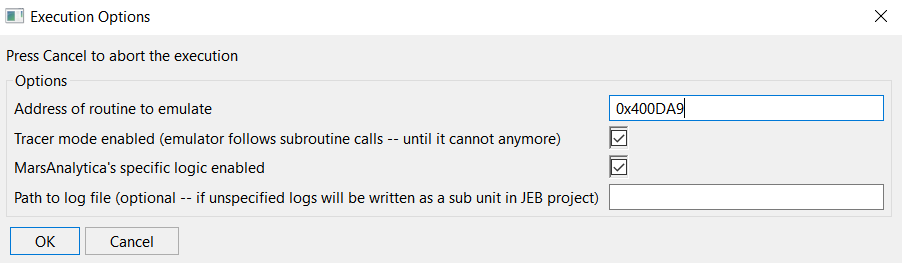
The final implementation of our tracer can be found in our GitHub page. Once executed, the plugin logs in JEB’s console an execution trace of the emulated methods, each of them providing the address of the next one:
> emulating method sub_400DA9...
  >> done; next method entry point: 0x00402335
> emulating method sub_402335...
  >> done; next method entry point: 0x00402335
> emulating method sub_402335...
  >> done; next method entry point: 0x00401b8f
> emulating method sub_401B8F...
  >> done; next method entry point: 0x004018cd
> emulating method sub_4018CD...
  >> done; next method entry point: 0x00401f62
> emulating method sub_401F62...
  >> done; next method entry point: 0x00402335
> emulating method sub_402335...
  >> done; next method entry point: 0x00403477
> emulating method sub_403477...
  >> done; next method entry point: 0x00401502
> emulating method sub_401502...
  >> done; next method entry point: 0x004018cd

[...REDACTED...]
Good news everyone: the handlers addresses are correct (we double-checked them with a debugger). In other words, JEB decompilation is correct and our emulator remains faithful to the executable logic. Phew…!
Part 3: Solving The Challenge
Plot Twist: It Does Not Work
The first goal of the emulator was to find where user’s input is manipulated. We are looking in particular for a call to getchar(). So we let the emulator run for a long time, and…
…it never reached a call to getchar().
The emulator was correctly passing through the obfuscated handlers (we regularly double-checked their addresses with a debugger), but after a few days the executed code was still printing MarsAnalytica magnificent ASCII art prompt (reproduced below).
After investigating, it appears that characters are printed one by one with putchar(), and each of these calls is in the middle of one heavily obfuscated handler, which will be executed once only. More precisely, after executing more than one third of the whole 10MB, the program is still not done with printing the prompt!
As mentioned previously, the “problem” with emulating decompiled C code is that we need the decompiled code in the first place, and decompiling lots of obfuscated routines takes time…
Let’s Cheat
Ok, we cannot reach in a decent time the point where the user’s input is processed by the program. But the execution until this point should be deterministic. What if… we start the emulation at the point where getchar() is called, rather than from the entry-point?
In other words, we are going to assume that we “found” the place where user’s input starts to be processed, and use the emulator to analyze how this input is processed.
To do so, we used GDB debugger to set a breakpoint on getchar() and dumped both stack and heap memories at this point 5. Then, we extended the emulator to be able to initialize its memory state from stack/heap memory dumps, and change emulation start address to be the first call to getchar().
What Now?
At this point getchar() is called to get the first input character, so we let the emulator simulate this API by returning a pseudo-randomly chosen character, such that we can follow the rest of the execution. After 19 calls to getchar() we finally enter the place where user’s input is processed. Hooray…
Then, we let the emulator run for a whole day, which provided the execution trace we will be working on for the rest of this blog. After digging into the trace we noticed that input characters were passed as arguments to a few special routines.
Introducing The Stack Machine
When we first skimmed through MarsAnalytica code, we noticed a few routines that seemed specials for two reasons:
- While obfuscated routines are executed only once and in a linear fashion (i.e. from low to high memory addresses), these “special” routines are at the very beginning of the executable and are called very often during the execution.
- These routines’ code is not obfuscated and seems to be related with memory management at first sight.
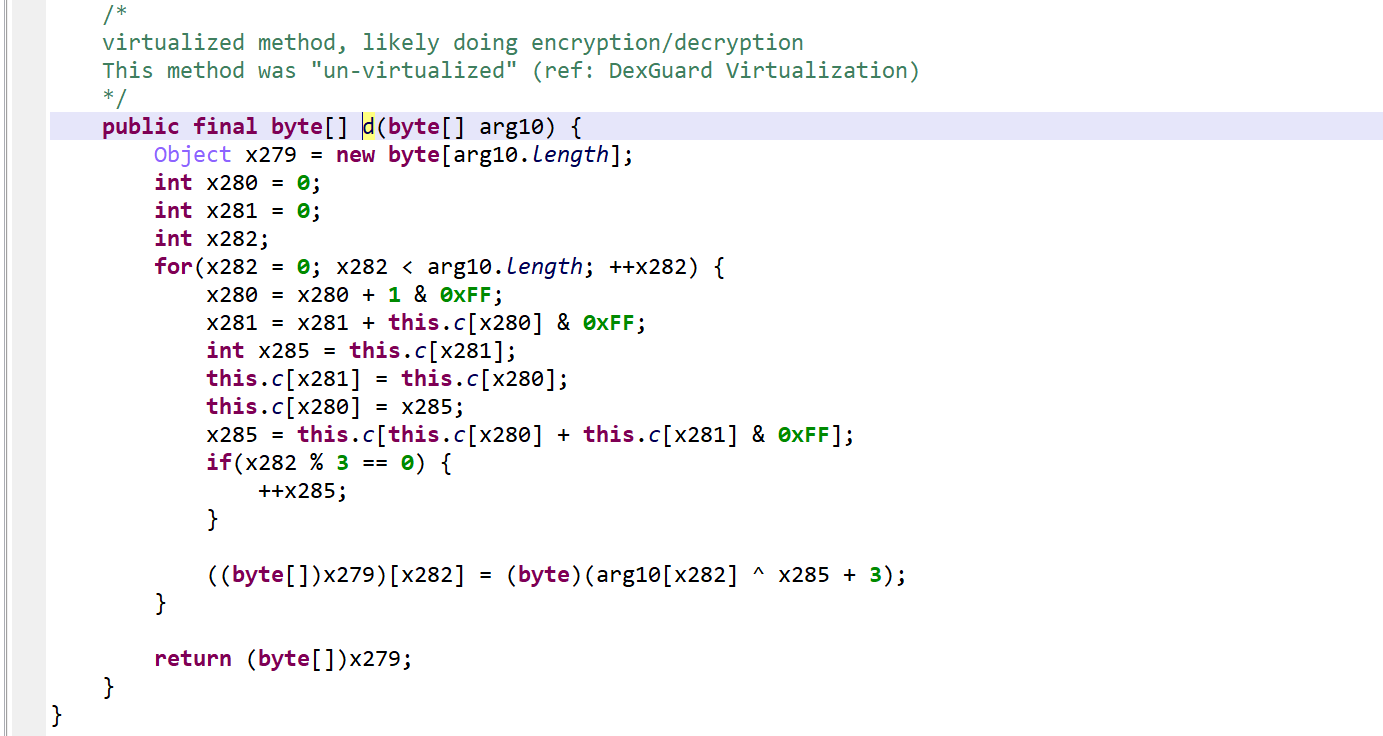
For example, here is JEB decompiled code for the first of them (comments are ours):
long sub_400AAE(unsigned long* param0, int param1) {
    long result;
    unsigned long* ptr0 = param0;
    int v0 = param1;

    if(!ptr0) {
        result = 0xffffffffL;
    }
    else {
        // allocate new slot
        void* ptr1 = →malloc(16L);
        if(!ptr1) {
            /*NO_RETURN*/ →exit(0);
        }

        // set value in new slot
        *(int*)((long)ptr1 + 8L) = v0;

        // insert new slot in first position
        *(long*)ptr1 = *ptr0;
        *ptr0 = ptr1;
        result = 0L;
    }

    return result;
}
What we have here is basically a “push” operation for a stack implemented as a chained list (param0 is a pointer to the top of the stack, param1 the value to be pushed).
Each slot of the stack is 16 bytes, with the first 8 bytes being a pointer to the next slot and the next 4 bytes containing the value (remaining 4 bytes are not used).
It now seemed clear that these special routines are the crux of the challenge. So we reimplemented most of them in the emulator, mainly as a way to fully understand them. For example, here is our “push” implementation:
/** PUSH(STACK_PTR, VALUE) */
if(calledMethod.getName().equals("sub_400AAE")) {
    Long pStackPtr = evaluateExpression(parameters.get(0));
    Long pValue = evaluateExpression(parameters.get(1));

    long newChunkAddr = allocateNewChunk();

    // write value
    state.writeMemory(newChunkAddr + 8, pValue, 4);

    // link new chunk to existing stack
    Long stackAdr = state.readMemory(pStackPtr, 8);
    state.writeMemory(newChunkAddr, stackAdr, 8);

    // make new chunk the new stack head
    state.writeMemory(pStackPtr, newChunkAddr, 8);

}
Overall, these operations are implementing a custom data-structure that can be operated in a last-in, first-out fashion, but also with direct accesses through indexes. Let’s call this data structure the “stack machine”.
Here are the most used operators:
| Address | Operator (names are ours) | Argument(s) |
0x400AAE | PUSH | VALUE |
0x4009D7 | POP | VALUE |
0x400D08 | GET | INDEX |
0x400D55 | SET | INDEX,VALUE |
Tracing The Stack Machine
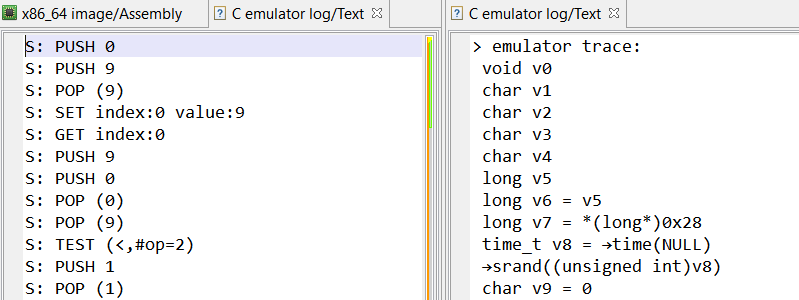
At this point, we modified the emulator to log only stack operations with their arguments, starting from the first call to getchar(). The full trace can be found here, and here is an extract:
S: SET index:7 value:97
S: SET index:8 value:98
S: SET index:13 value:99
S: SET index:15 value:100
S: SET index:16 value:101

[...REDACTED...]

S: PUSH 2700
S: POP (2700)
S: SET index:32 value:2700
S: GET index:32
S: PUSH 2700
S: PUSH 2
S: POP (2)
S: POP (2700)
S: PUSH 2702

[...REDACTED...]
The trace starts with a long series of SET operations, which are storing the result of getchar() at specific indexes in the stack machine (97, 98, 99,… are characters provided by the emulator).
And then, a long series of operations happen, combining the input characters with some constant values. Some interesting patterns appeared at this point, for example:
S: POP (2)
S: POP (2700)
S: PUSH 2702
Here an addition was made between the two popped values, and the result was then pushed. Digging into the trace, it appears there are also handlers popping two values and pushing back a subtraction, multiplication, exclusive or, etc.
Another interesting pattern appears at several places:
S: POP (16335)
S: POP (1234764)
S: PUSH 1
Looking at the corresponding C code, it is actually a comparison between the two popped values — “greater than” in this case –, and the boolean result (0 or 1) is then pushed. Once again, different comparison operators (equal, not equal, …) are used in different handlers.
Finally, something suspicious also stood out in the trace:
S: PUSH 137
S: PUSH 99
S: POP (137)
S: POP (99)
The popped values do not match the order in which they were pushed!
Digging into the code we end up on a special routine (0x402AB2), which swaps the two top-most values… So to make things clearer, the emulator logs in the execution trace a SWAP operator whenever this routine gets executed.
Where Is My Precious Operator?
Our objective here is to understand how input characters are manipulated, and what tests are done on them. In other words, we want to know for each POP/POP/PUSH pattern if it is an operation (and which operation — addition, subtraction …–), or a test (and which test — equal, greater than …–).
Again, note that routines implementing POP/POP/PUSH patterns are executed only once. So we cannot individually analyze them and rely on their addresses.
This is where working on decompiled C code becomes particularly handy. For each POP/POP/PUSH series:
- We search in the method’s decompiled code if a C operator was used on the
PUSHoperand. To do so, it is as simple as looking at the operand itself, thanks to JEB decompiler’s optimizations! For example, here is a subtraction:
...long v1 = pop(v0 - 0x65f48L);long v2 = pop(v0 - 0x65f48L);...push(v0 - 0x65f48L, v1 - v2);
When a C operator is found in push() second operand, the emulator adds the info (with the number of operands) in the trace:
S: POP (137)
S: POP (99)
S: PUSH 38
| operation: (-,#op=2)
- Also, we check if there is a “if” statement following a
POPin the C code. For example, here is a “greater-than” check between popped values:
...long v2 = pop(v0 - 0x65f48L);long v3 = pop(v0 - 0x65f48L);...if(v2 > v3) {
If so, the emulator extracts the C operator used in the if statement and logs it in the trace (as a pseudo stack operator named TEST):
S: POP (16335)
S: POP (1234764)
S: TEST (>,#op=2)
S: PUSH 0
It should be noted that operands are always ordered in the same way: first poped value is on left side of operators. So operators and operands are the only thing we need to reconstruct the whole operation.
Time To Go Symbolic
At this point, our execution trace shows how the user’s input is stored onto the stack, and which operations and tests are then done. Our emulator is providing a “bad” input, so they are certainly failed checks in our execution trace. Our goal is now to find these checks, and then the correct input characters.
At this point, it is time to introduce “symbolic” inputs, rather than using concrete values as we have in our trace. To do so, we made a quick and dirty Python script to replay stack machine trace using symbolic variables rather than concrete values.
First, we initialize a Python “stack” with symbols (the stack is a list(), and the symbols are strings representing each character “c0“, “c1“, “c2“…). We put those symbols at the same indexes used by the initial SET operations:
# fill stack with 'symbolic' variables (ie, characters)
# at the initial offset retrieved from the trace
stack = [None] * 50 # arbitrary size
charCounter = 0
stack[7] = 'c' + str(charCounter) # S: SET index:7 value:c0
charCounter+=1
stack[8] = 'c' + str(charCounter) # S: SET index:8 value:c1

[... REDACTED ...]
We also need a temporary storage for expressions that get popped from the stack.
Then, we read the trace file and for each stack operation we execute the equivalent operation on our Python stack:
if operator == "SWAP":
  last = stack.pop()
  secondToLast = stack.pop()
  stack.append(last)
  stack.append(secondToLast)

elif operator == "GET":
  index = readIndexFromLine(curLine)
  temporaryStorage.append(stack[int(index)])

elif operator == "SET":
  index = readIndexFromLine(curLine)
  stack[int(index)] = temporaryStorage.pop()

elif operator == "POP":
  value = stack.pop()
  temporaryStorage.append(value)

[... REDACTED ...]
Now here is the important part: whenever there is an operation, we build a new symbol by “joining” the symbol operands and the operator. Here is an example of an addition between symbols “c5” and “c9“, corresponding respectively to the concrete input characters initially stored at index 26 and 4:
| Concrete Trace | Symbolic Trace |
... | ... |
Note that our symbolic executor starts with a clean stack, containing only input symbols. All constants used during the computation are indeed coming from the bytecode (the large memory area copied on the (native) stack at the beginning of the execution), and not from the stack machine.
We can then observe series of operations on input symbols getting build by successive POP/POP/PUSH patterns, and being finally checked against specific values. Here is an extract of our stack at the end:
((((c12-c10)^c13)*(c6*c14))!=16335)
(((c18^c1)^(c15-c7))!=83)
((((c9+c5)^c0)*(c17-c16))!=4294961394)
((c3-c11)!=11)
(((c2+c4)^c8)!=3)
((c8+(c15-c4))!=176)
((((c9^c10)-(c11+c18))^c6)!=4294967097)
(((c1*(c0^c17))+(c2*c16))!=9985)
(((c14*c13)-c7)!=2083)
(((c12+c3)-c5)!=110)
(((c8*c10)+(c9+c13))!=5630)
(((c5-c16)-(c2+c0))!=4294967114)
((c17*(c14^c7))!=7200)
(((c1*c3)+(c6*c11))!=17872)
(((c12-c15)-(c18*c4))!=4294961888)
(((c11*c2)+(c3*c15))!=18888)
((c16*(c5+c13))!=15049)
((c17*(c0+c10))!=12150)
((c18*(c14^c6))!=10080)
(((c7+c12)-c4)!=132)
((c8+(c1*c9))!=2453)
It seems pretty clear that those checks are the ones we are looking for, except that we need to revert inequality tests into equality tests.
Now, how to find the values of symbols “c0“, “c1“,.. passing these tests?
The Final
To find the correct input characters, we used Z3 SMT solver Python bindings, and let the solver do its magic:
from z3 import *

# initialize our characters as 8-bit bitvectors
c0 = BitVec('c0', 8)
c1 = BitVec('c1', 8)
c2 = BitVec('c2', 8)
c3 = BitVec('c3', 8)
c4 = BitVec('c4', 8)
c5 = BitVec('c5', 8)
c6 = BitVec('c6', 8)
c7 = BitVec('c7', 8)
c8 = BitVec('c8', 8)
c9 = BitVec('c9', 8)
c10 = BitVec('c10', 8)
c11 = BitVec('c11', 8)
c12 = BitVec('c12', 8)
c13 = BitVec('c13', 8)
c14 = BitVec('c14', 8)
c15 = BitVec('c15', 8)
c16 = BitVec('c16', 8)
c17 = BitVec('c17', 8)
c18 = BitVec('c18', 8)

s = Solver()

# allowed character range
s.add(c0 > 32, c0 < 127)
s.add(c0 > 32, c0 < 127)
s.add(c1 > 32, c1 < 127)
s.add(c2 > 32, c2 < 127)
s.add(c3 > 32, c3 < 127)
[... REDACTED ...]

# checks
s.add((((c12-c10)^c13)*(c6*c14))==16335)
s.add(((c18^c1)^(c15-c7))==83)
s.add((((c9+c5)^c0)*(c17-c16))==4294961394)
s.add((c3-c11)==11)
s.add(((c2+c4)^c8)==3)
s.add((c8+(c15-c4))==176)
[... REDACTED ...]
Here is another advantage to work with C code: the expressions built from our emulator’s trace are using high-level operators, which are directly understood by Z3.
Finally, we ask Z3 for a possible solution to the constraints, and we build the final string from c0, c1,… values:
m = s.model()
result = ''
result += chr(m[c0].as_long())
result += chr(m[c1].as_long())
result += chr(m[c2].as_long())
result += chr(m[c3].as_long())
...
And…
Conclusion
We hope you enjoy this blog post, where we used JEB C decompiled code to analyze a heavily obfuscated executable.
Please refer to our GitHub page for emulator code. While it has been tailored for MarsAnalytica crackme, it can be extended to emulate any executable’s decompiled C code (MarsAnalytica’s specific emulation logic is constrained in subclass MarsAnalyticaCEmulator).
You can run the plugin directly from JEB UI (refer to README):
By default, it will show emulation traces as text subunits in JEB project (stack machine trace in MarsAnalytica mode, or just C statements trace):
Alternatively, the plugin comes with a headless client, more suitable to gather long running emulation traces.
Finally, kudo to 0xTowel for the awesome challenge! You can also check the excellent Scud’s solution.
Feel free to message us on Slack if you have any questions. In particular, we would be super interested if you attempt to solve complex challenges like this one with JEB!
- While JEB’s default decompiled code follows (most of) C syntactic rules and their semantics, some custom operators might be inserted to represent low-level operations and ease the reading; hence strictly speaking JEB’s decompiled code should be called pseudo-C. The decompiled output can also be variants of C, e.g. the Ethereum decompiler produce pseudo-Solidity code. ↩
- SHA1 of the UPX-packed executable: fea9d1b1eb9d3f93cea6749f4a07ffb635b5a0bc ↩
- Implementing a complete CFG on decompiled C code will likely be done in future versions of JEB, in order to provide more complex C optimizations. ↩
- The actual implementation is more complex than that, e.g. it has to deal with pointers dereferencement, refer to
emulateStatement()for details. ↩ - Dumping memory was done with peda for GDB, and commands
dumpmem stack.mem stackanddumpmem heap.mem heap↩