This is part 2 of the blog that introduced the major addition that shipped with JEB Pro 4.29: the ability for the dex decompiler to call into the native analysis pipeline, the generic decompiler and native code emulator.
Today, we demo how to use two plugins shipping with JEB 4.30, making use of the emulators to recover information protected by a native code library found in several APKs, libpairipcore.so.
Recovering statically registered native routines
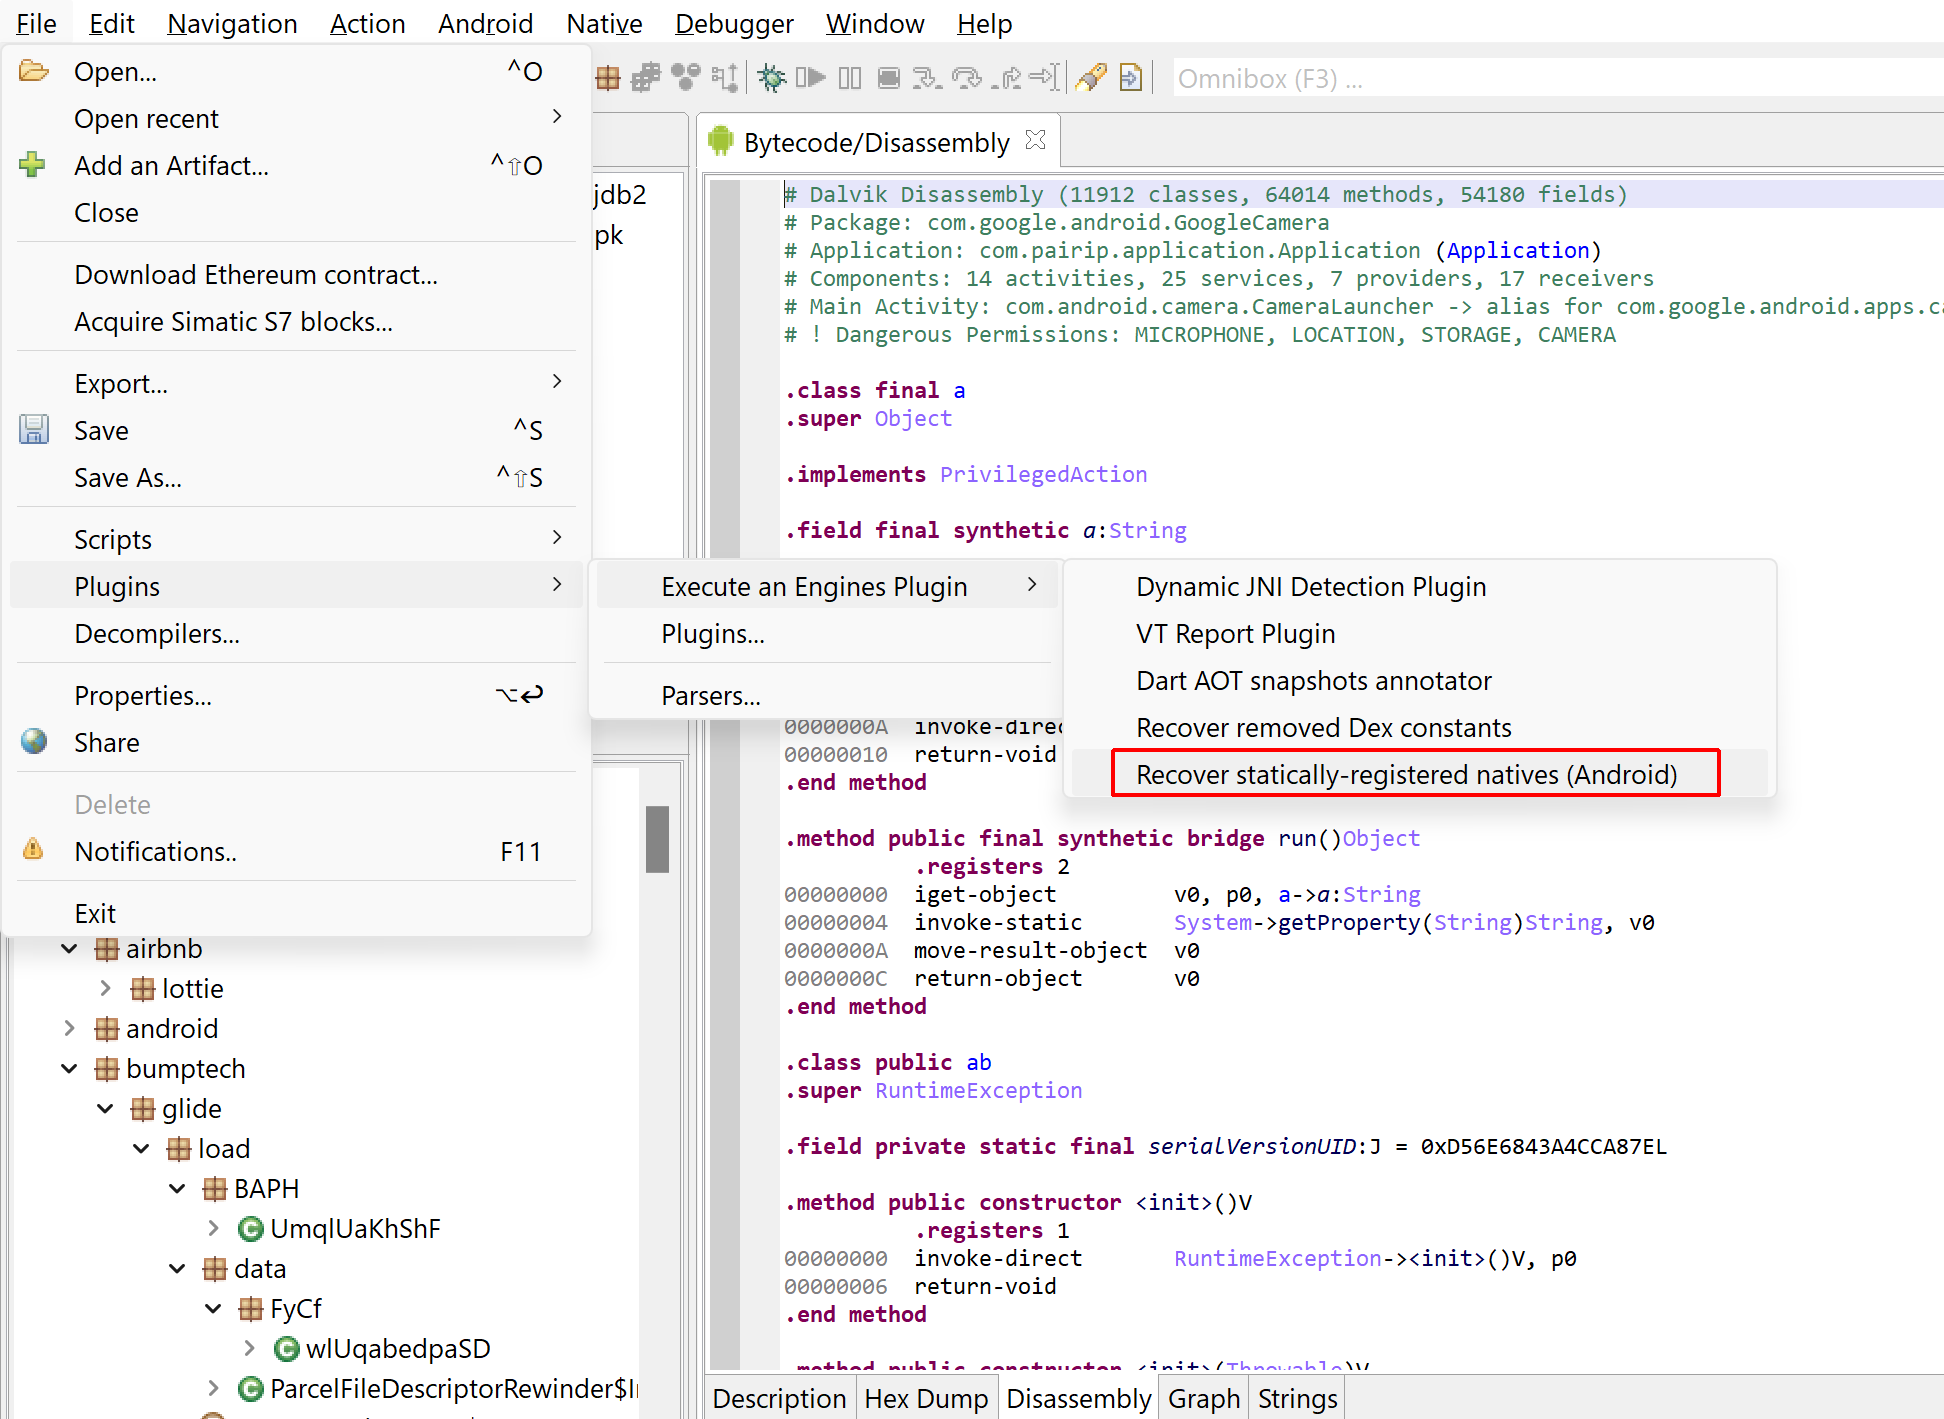
The first plugin can be used to discover native routines registered via JNI’s RegisterNatives. As a reminder, when calling a native method from Java, the JNI will see if exported routines with specific names derived from the Java method signature exist in the process. Alternatively, bindings between a Java native method and its actual body can be done with RegisterNatives. Typically, this is achieved in JNI_OnLoad, the primary entry-point. However, it does not need to; other techniques exist to further obfuscate the target call site of a Java native method, such as unregistration/re-registration, the obfuscation of JNI_OnLoad, etc. More information can be found here.
In its current state, the plugin will attempt to emulate a SO library’s JNI_OnLoad on its own, without the context of the app process it would normally run on. The advantage is that the plugin is useable on libraries recovered without their container app (APK or else). The drawback is that it may fail in complex cases, since the full app context is not available to this plugin. (Note that the second plugin does not suffer this limitation).
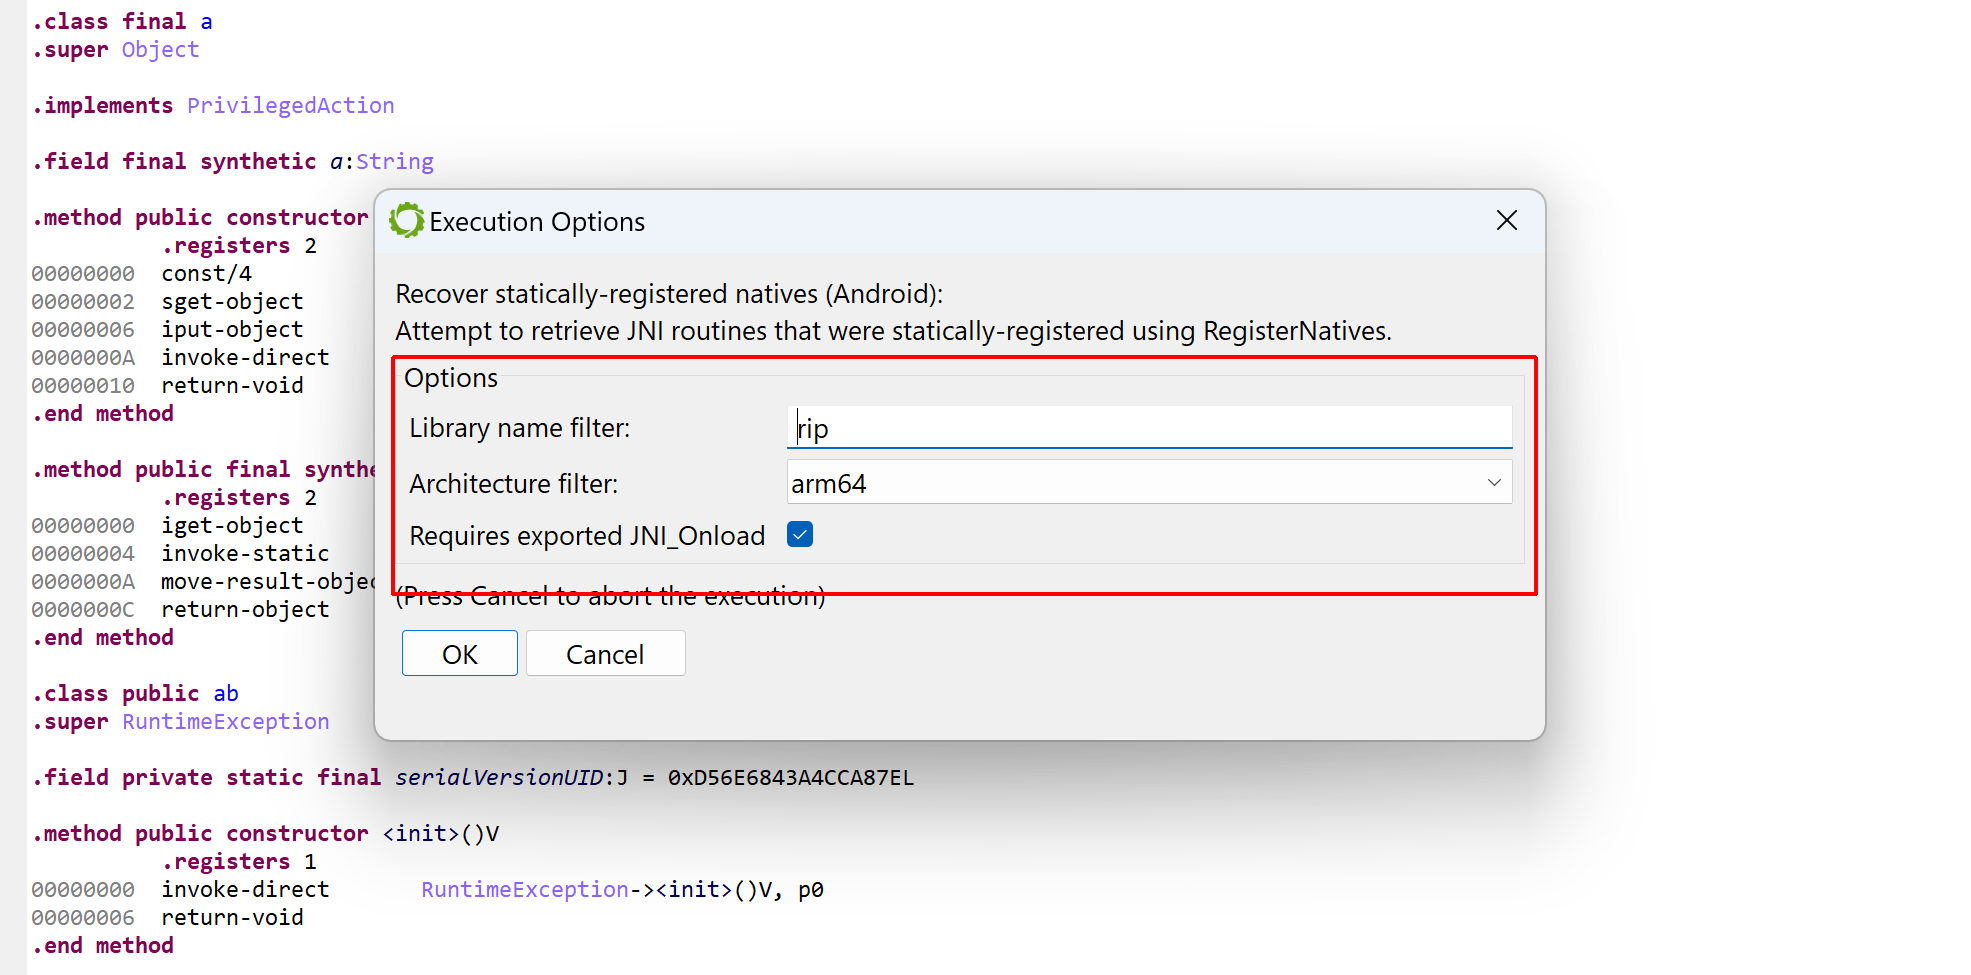
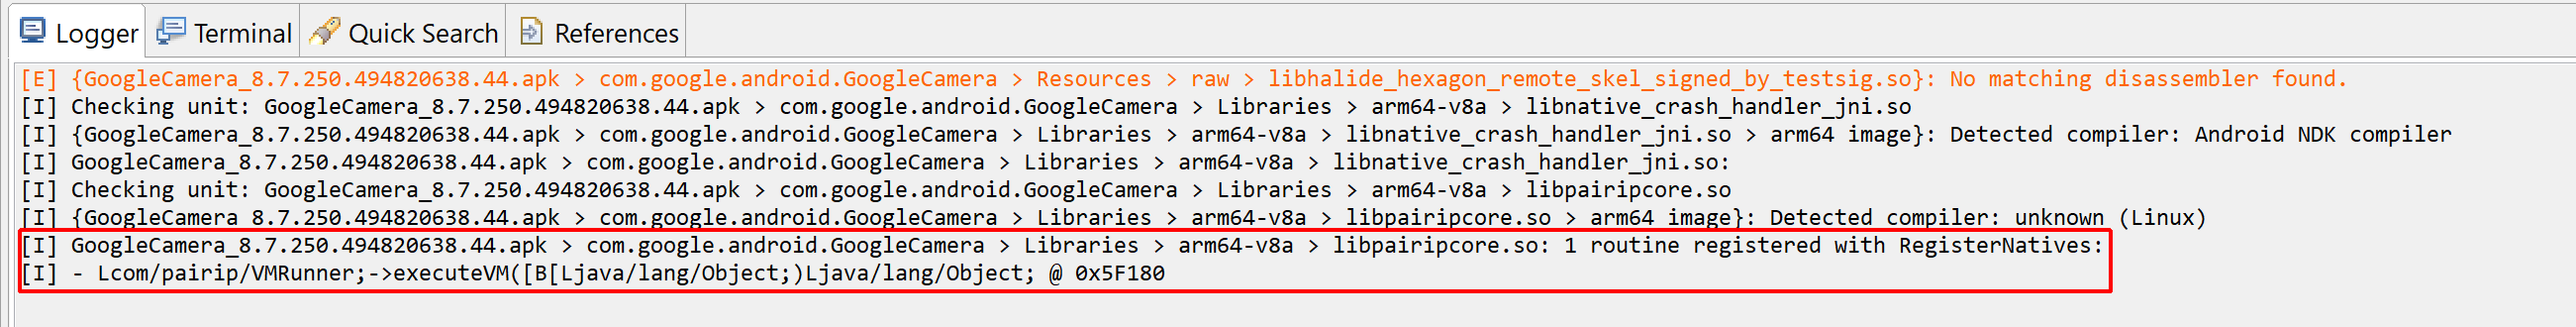
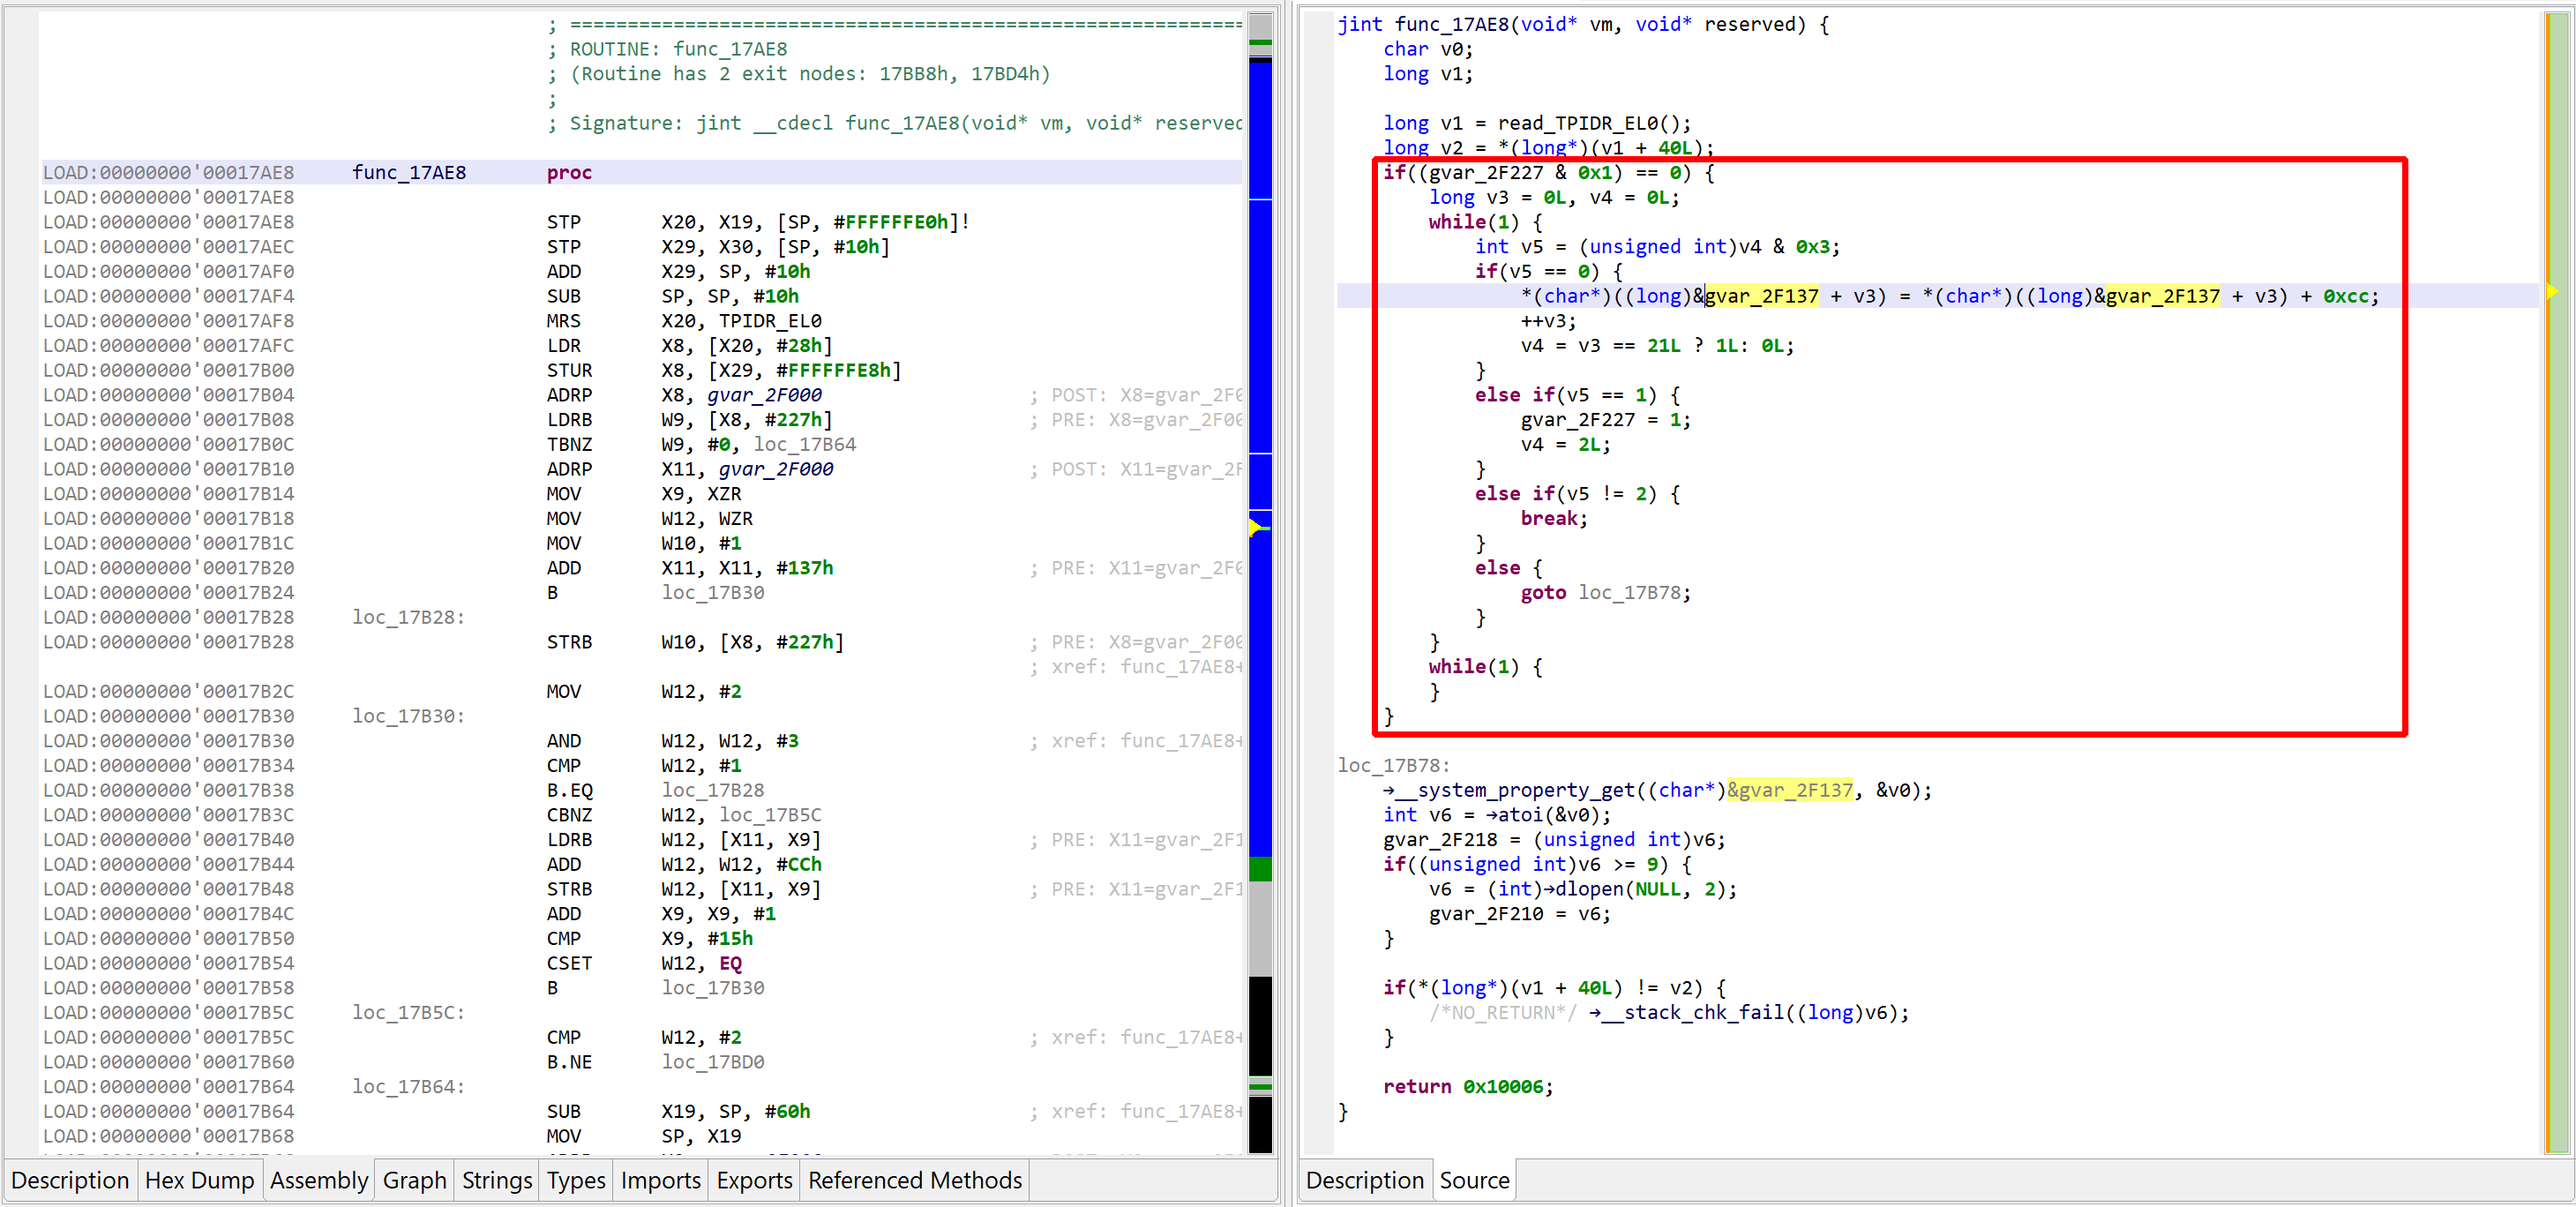
Open an APK or Elf SO file(s), run the “Recover statically-registered natives (Android)” plugin.Set optional name filters or architecture filters as needed.The results will be visible in the log. In this case, it looks like the aarch64 library libpairipcore.so registered one method for com.pairip.VMRunner.executeVM, and mapped it to a routine at 0x5F180.
Recovering constants removed from the Dex
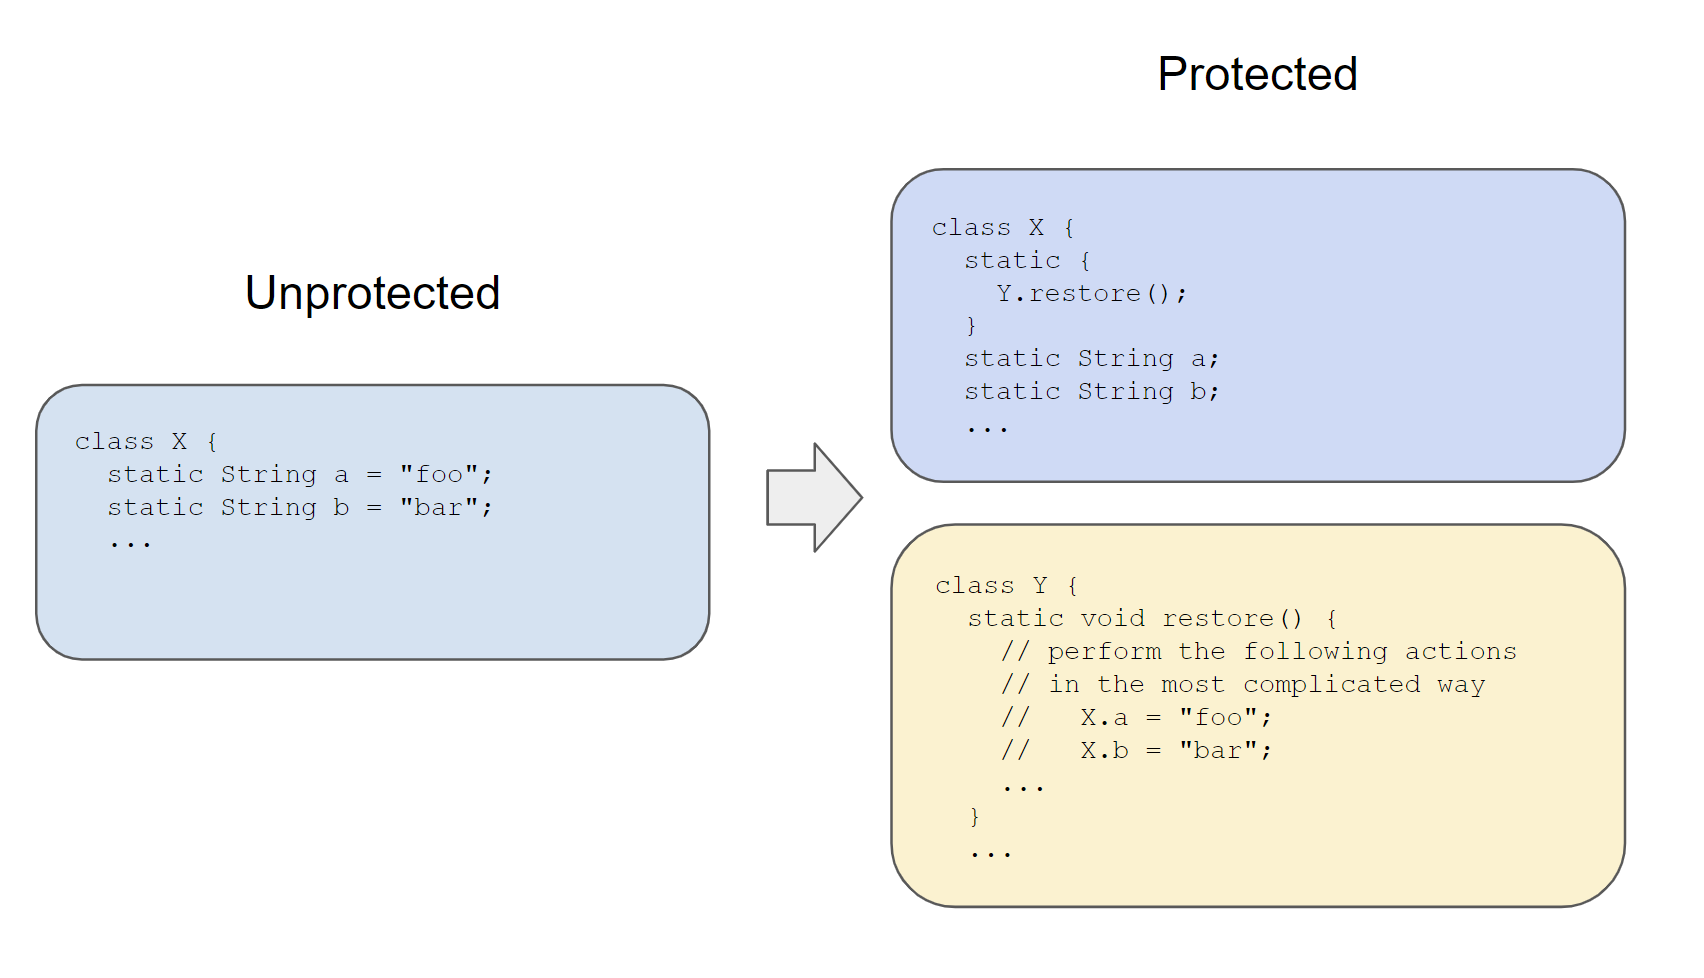
The second plugin makes use of an IEmulatedAndroid object to simulate an execution environment and execute code that may be restoring static string constants removed from the Dex by code protection systems.
We can imagine that the code protection pass works as such:
String constants are being removed during a protection pass.
The implementation details of restore() are not relevant to this blog entry. In the case of that particular app, it involves calling into a highly obfuscated native library called libpairipcore.so.
The plugin requires a full APK. It will emulate a static method selected by the user and let them know about the constants that were restored.
The plugin workflow is as follows:
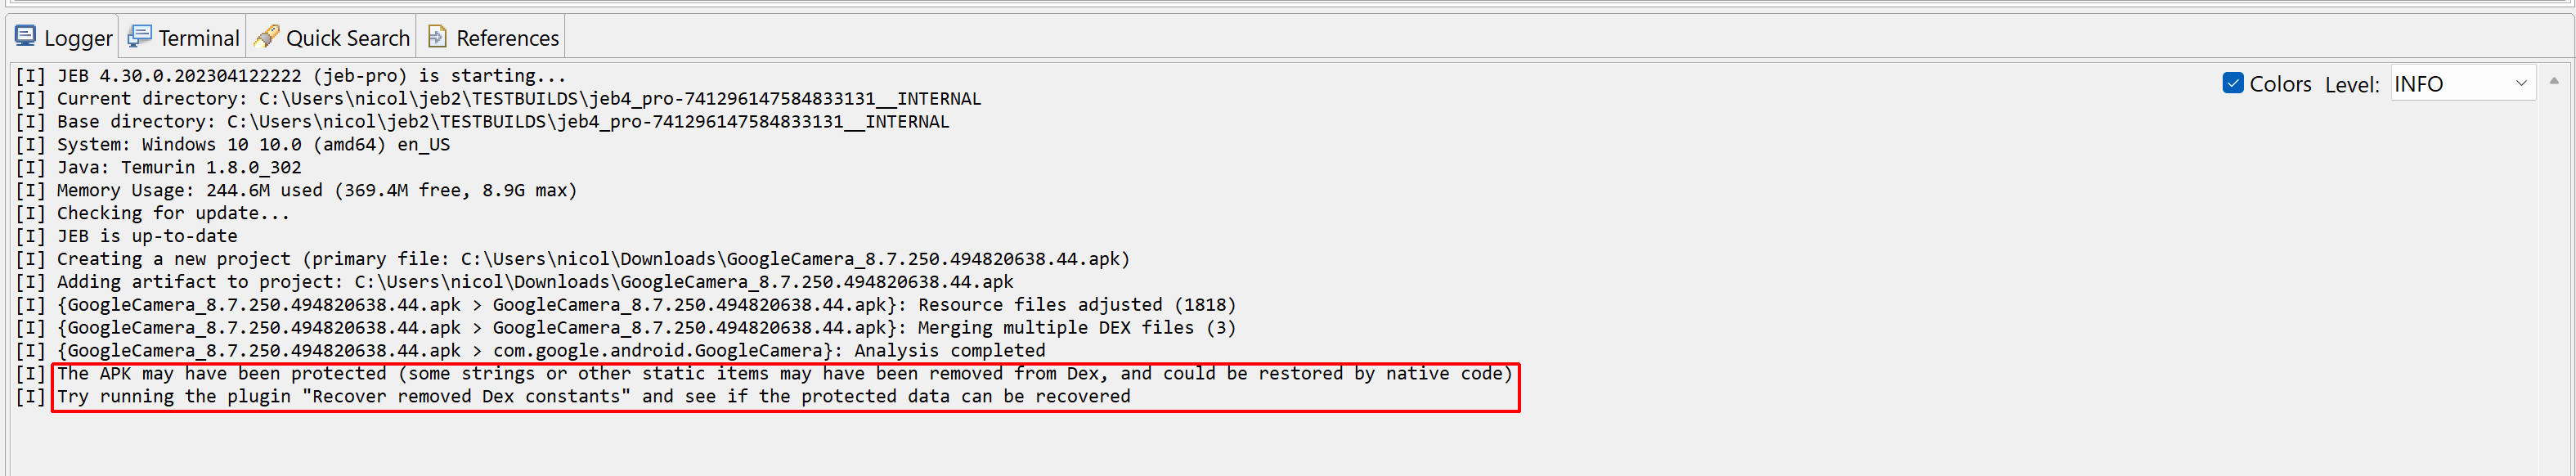
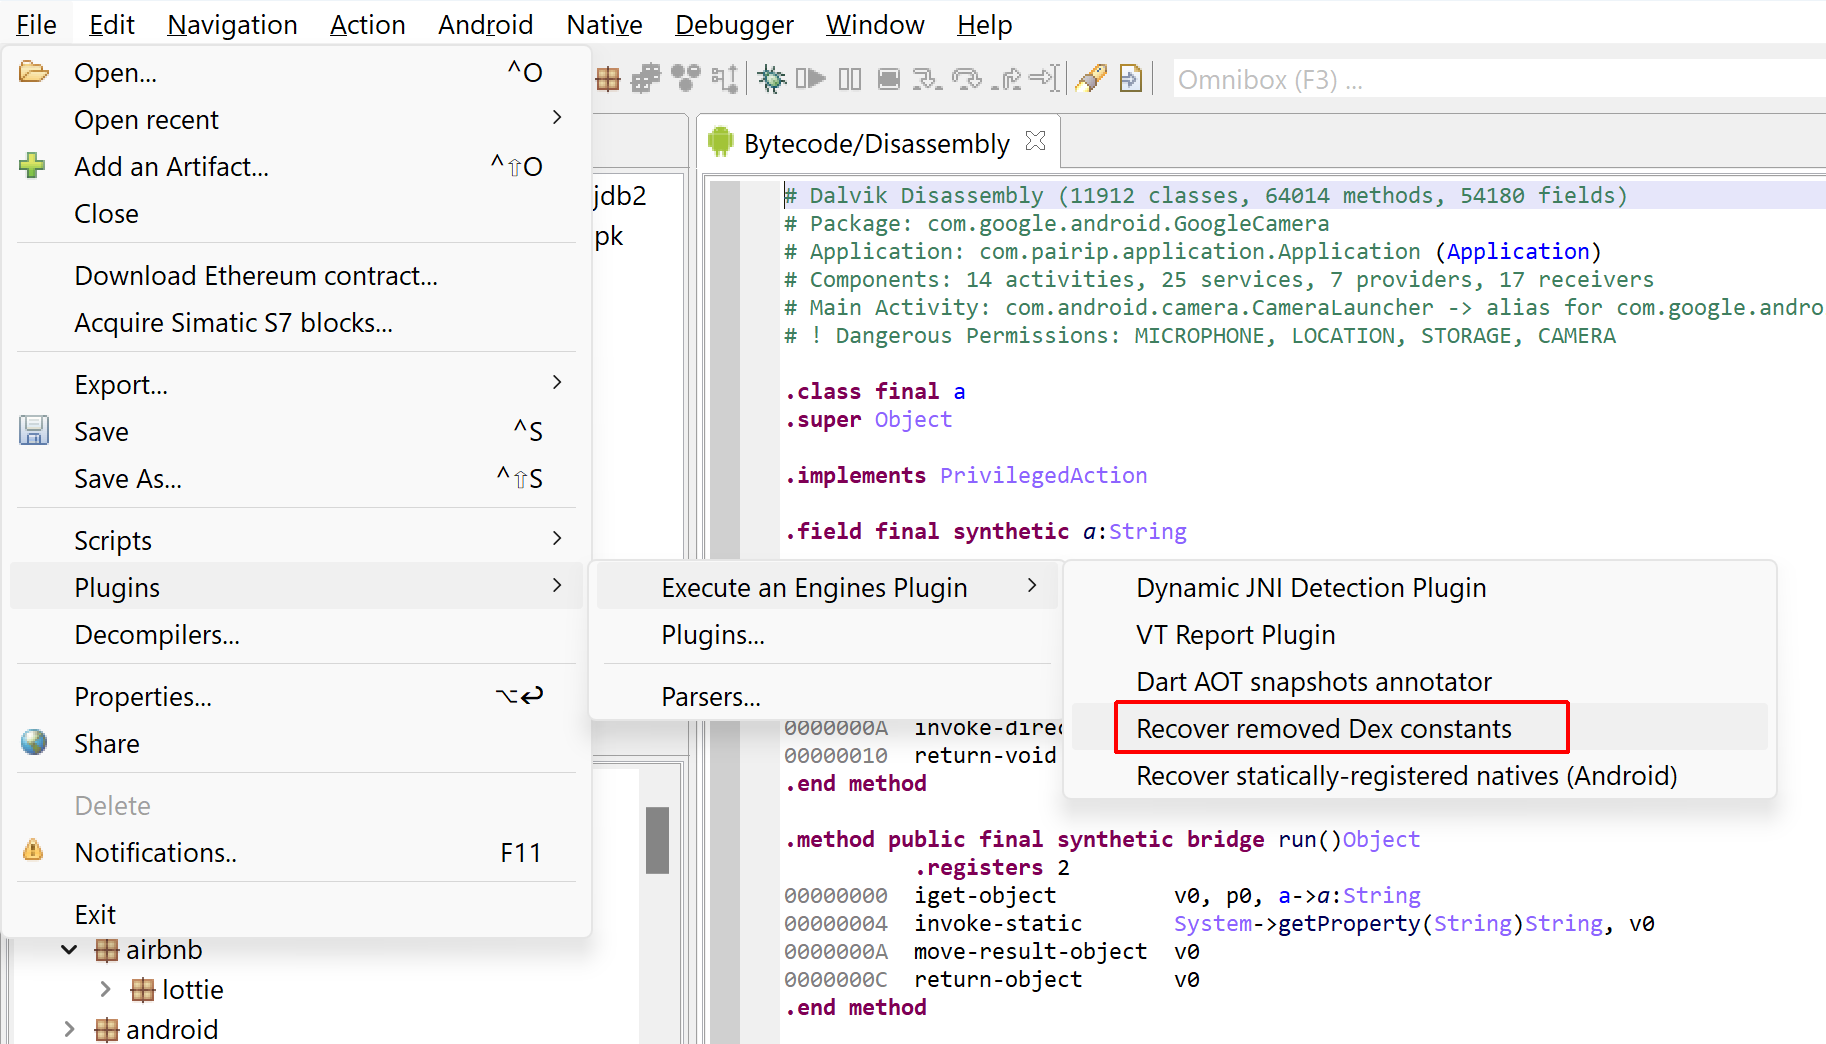
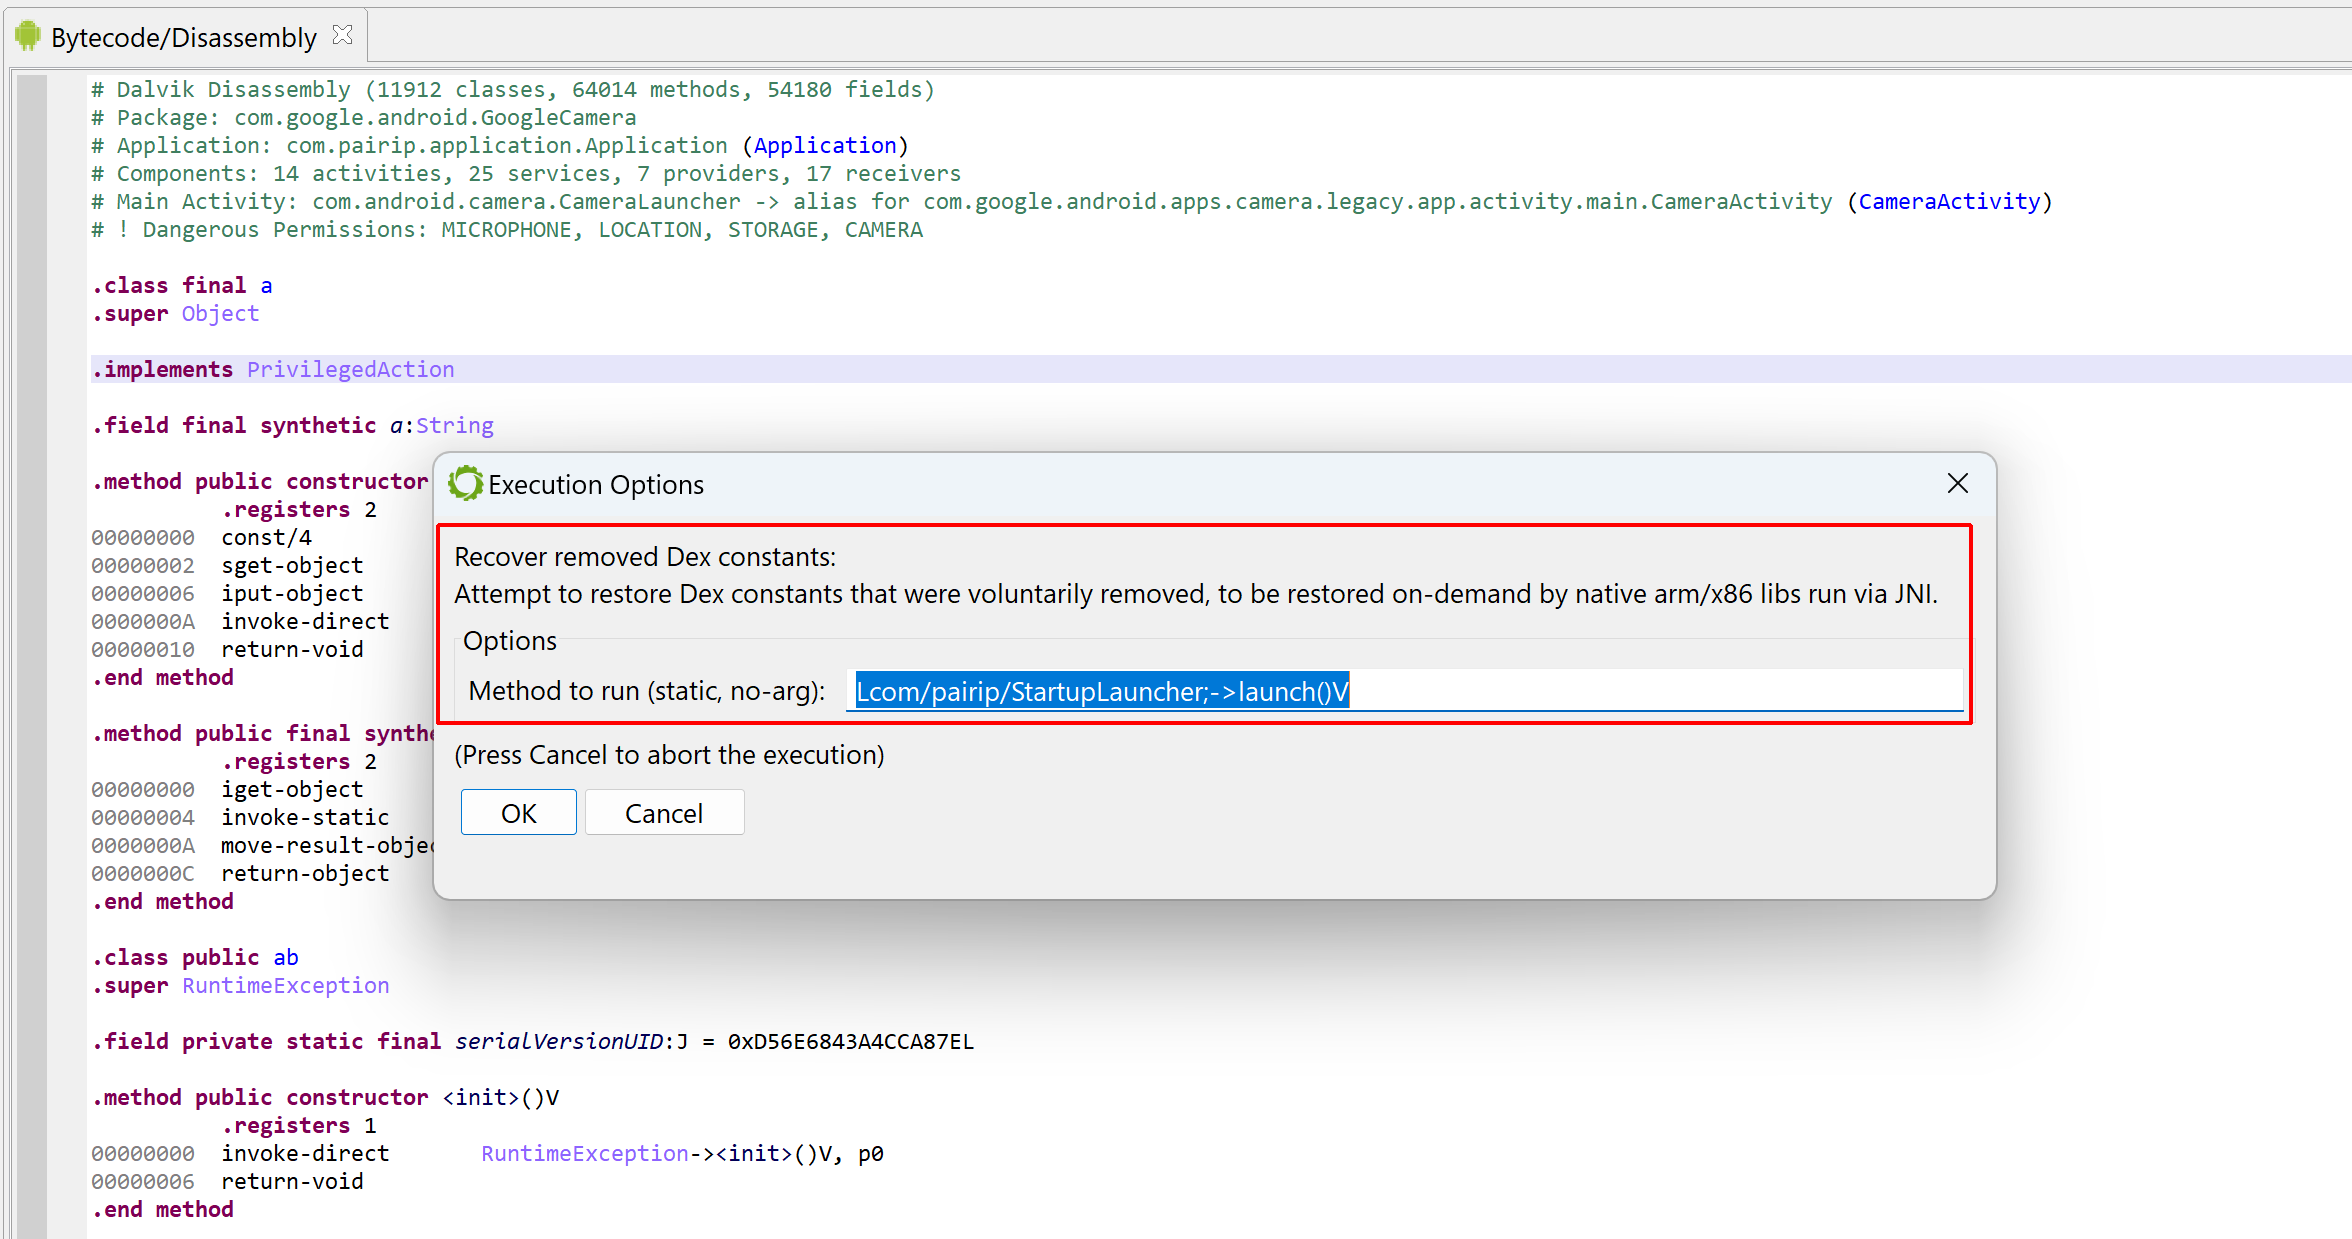
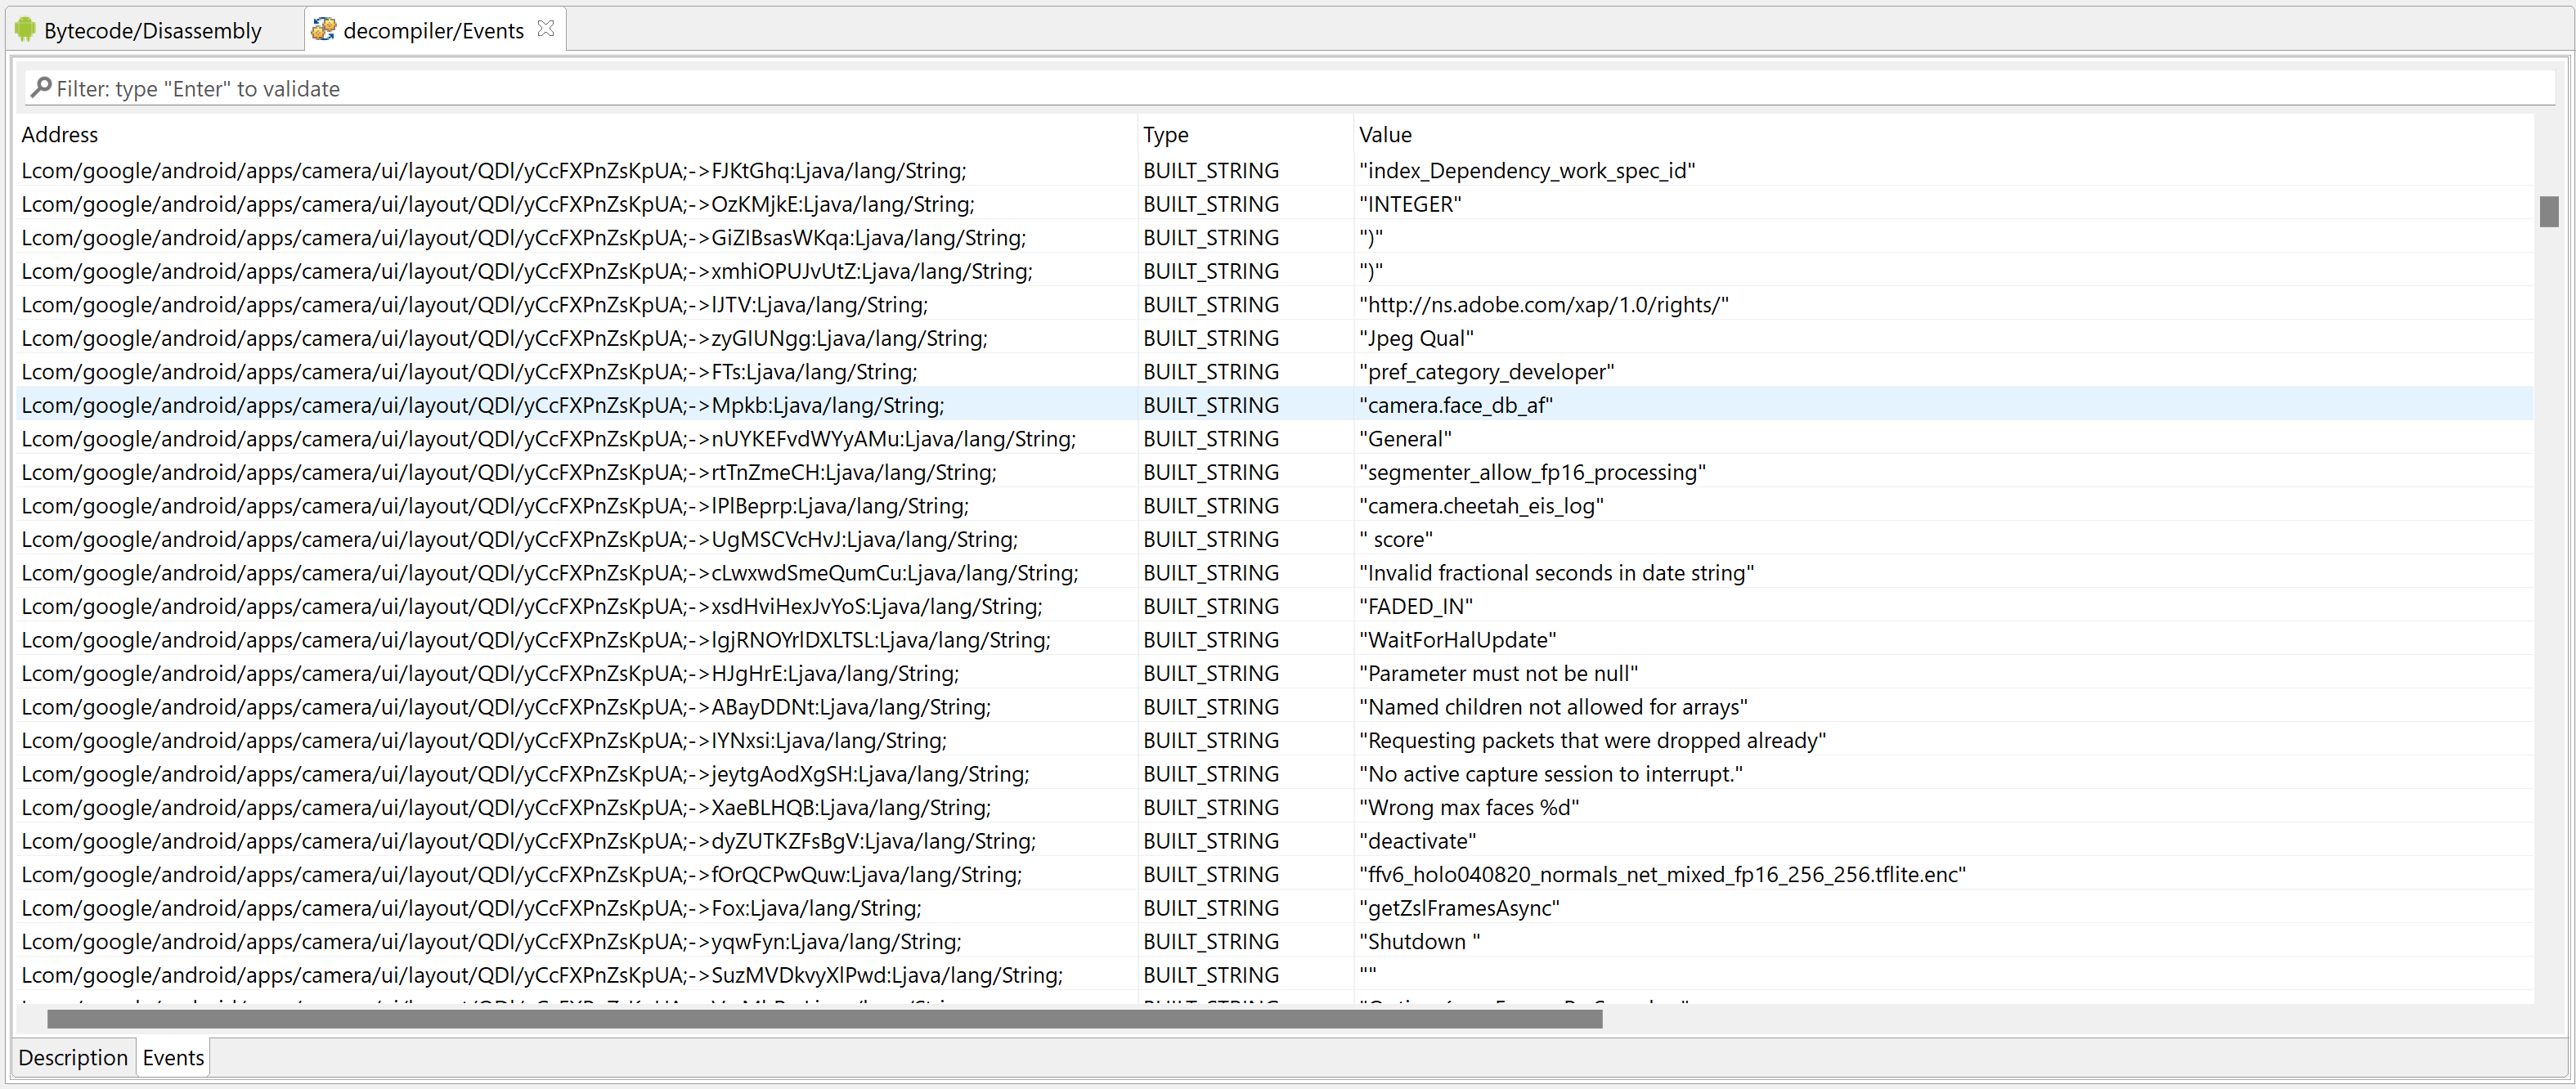
After loading an APK, the plugin may let the user know that the code was protected.Execute the “Recover removed Dex constants” plugin.The user will be asked to input the no-arg static method that should be simulated. If a suitable one is found, it may be pre-populated by the plugin.The execution can be lengthy, from several seconds to several minutes. Recovered strings are registered as fields comments as well as decompiler events in the relevant dexdec unit of your project.
Conclusion
That’s it for today. Make sure to update to JEB Pro 4.30 if you want to use those plugins.
I would encourage power-users to explore the JEB’s API, in particular IDState, EState/EEmulator and IEmulatedAndroid, if they want to experiment or work on code that requires specific hooks (dex hooks, jvm sandbox hooks, native emu hooks, native memory hooks – refer to the registerXxxHooks methods in IDState) for the emulators to operate properly.
JEB 4.29 finally bridges the gap between the dex analysis modules in charge of code emulation (dexdec‘s IDState and co.) and their counterparts in the native code analysis pipeline (gendec‘s EEmulator, EState and co.).
The emulation of JNI routines from dexdec unlocks use-cases that are now becoming commonplace, such as:
Object consumption relying on native code calls to make reverse-engineering harder. The typical case is the retrieval of encrypted strings where part of the decryption code is bytecode, part is native code.
General app tweaking done on the native side, such as field setting, field reading, method invocation, object creation, etc.
Example
Here is an example of what could not be done by JEB <4.29:
//
// dex code:
//

package a.b;

class X {
  ...
  native String decrypt(char[] array, int key1, int key2);
  ...
  void f() {
    return decrypt(new char[]{'K', 'F', 'C'}, 4, 3);
  }
  ...
}

//
// native code:
//

// pseudo-code for method `dec` mapping to `a.b.X.decrypt`
jstring dec(JNIEnv* env, jobject this, jcharArray array, int a, int b) {
  int len = (*env)->GetArrayLength(env, array);
  uint16_t out[len];
  for(int i = 0; i < len; i++) {
    out[i] = array[i] - (a - b);
  }
  return (*env)->NewString(env, out, len);
}
JEB 4.29, if the native emulator is enabled, is able to return a simpler version:
void f() {
  return "JEB";
}
Preparation
Currently, the native emulator is disabled by default. In order to let dexdec use it, edit your dexdec-emu.cfg file (located in your coreplugins/ folder, or in the GUI, Android menu, handler Emulator Settings…):
Mandatory: set enable_native_code_emulator to true
Recommended: increase the values of emu_max_duration and emu_max_itercount (the reason being the the analysis of native images by the native code plugins can be quite time-consuming).
You will also need a JEB Pro license to use this feature.
Output
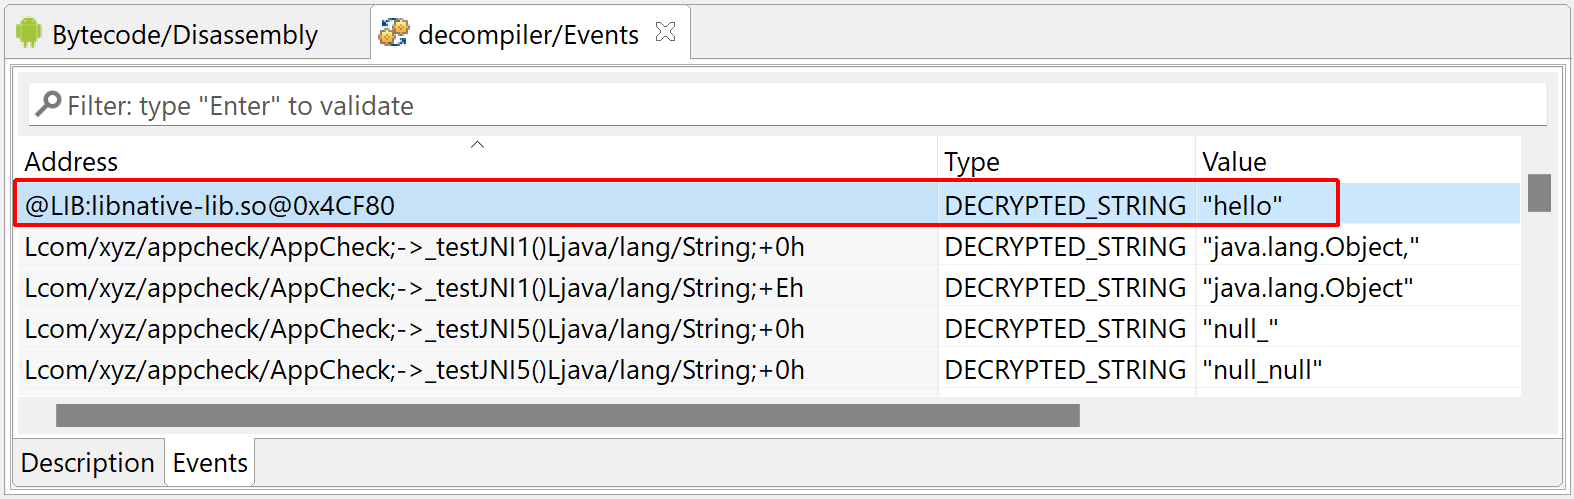
As usual, the auto-decryption of an item will also emit an event, which can be collected programmatically, and visible in the Decompiler’s “Events” fragment in the GUI.
Items whose address is formatted as @LIB:<lib.so>@NativeAddress are decrypted native items that were found in the SO image at some point.
Decrypted strings collected by the decompiler
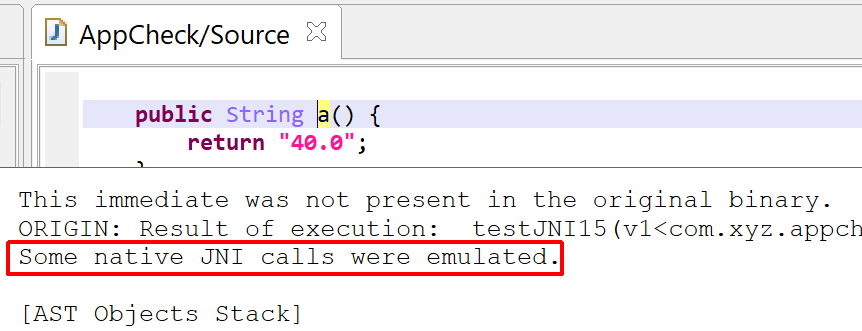
Similarly, decrypted items found in decompiled code are rendered using a purple’ish pink (by default) in the GUI.
If native code was involved in the decryption, the on-hover pop-up will let you know:
Decryption of that string required emulation of native code
API
The native emulator(s) managed by a dexdec‘s IDState can be customized with the following newly-added methods and types:
enableNativeCodeEmulator / isNativeCodeEmulatorEnabled : enable or disable the native emulator (the master setting is pulled from your config file, dexdec-emu.cfg)
registerNativeEmulatorHooks / unregisterNativeEmulatorHooks : hooks into the evaluation (emulation) of the native code – refer to the appropriate hooks interfaces. The hooks receives a reference to the controlling EEmulator.
unregisterNativeEmulatorHooks / ununregisterNativeEmulatorHooks : hooks into the memory accesses of the emulator’s state – refer to the appropriate hooks interfaces. The hooks receives a reference to the target EState object.
Conclusion
Interfacing both emulators offers many possibilities to improve the reverse-engineering experience of complex binaries and applications.
There is more that can be done, which will be discussed further blog posts:
Retrieval of statically registered natives (through JNIEnv’s RegisterNatives) as opposed to native routines automatically resolved using the JNI naming conventions.
Automatic unpacking of native code.
Use of the native emulator in custom scripts and plugins.
Note that this feature is currently limited to JEB Pro.
The JNI native code emulator will work with x86, x64, and arm64 code (we may add support for arm in the near future). Needless to say, it is still in experimental mode! Therefore, you may encounter strange results or problems while analyzing code making use of it. Please send us error reports to support@pnfsoftware.com.
Until next time, and once again, thank you to our amazing users for their continued support and kind words 🙂 — Nicolas.
The following is a small guide that will help users writing decompiler plugins decide whether they need to work at the IR (Intermediate Representation) level or at the AST (Abstract Syntax Tree) level. The recommendations apply to both JEB decompiler engines, dexdec (for Android Dex/Dalvik) and gendec (generic decompiler engine.
Decompilation Pipeline
A method undergoing decompilation goes through the following simplified pipeline:
The low-level native code (machine code or bytecode) is converted to low-level IR
Some augmentation take place, including SSA transformation and typing
IR processors lift and clean the low-level IR
The final high-level IR is converted to an AST
AST processors clean and beautify the code
The final AST is rendered as pseudo-code
The steps 3 (IR processing) and 5 (AST processing) are customizable by the user through JEB’s API. Indeed, custom plugins are sometimes necessary to perform work not done by JEB’s built-in optimizers.
IR vs AST
The following comparison between IR and AST will help you decide which plugin is better suited to perform some type of work.
The number of IR elements to deal with is substantially smaller than the AST counterpart. As such, it may be easier to learn at first. The AST being more abstract and closer to final pseudo code, there are necessarily more types of elements (e.g. a Break element, representing a break; statement, does not exist at the IR level). However, modifying IR statements requires more care than modifying the AST tree.
The IR of a method is a flat sequence of instructions, organized into basic blocks. The flow of execution between the blocks is clear and concise. On the other hand, the AST being a tree, its navigation is not as straight-forward as a flat IR listing. While the concept of blocks exists, they are not necessarily basic blocks, and the flow of execution in the AST is not trivial to determine.
A consequence of the above is that data analysis is easier done at the IR level than at the AST level. The IR framework provides Data Flow Analysis objects with easy-to-use ways to determine where and by what variables are being accessed. This is a fundamental prerequisite for many non-trivial optimizers whose goal is code cleaning or restructuring (e.g. constant and variable propagation, dead code elimination, etc.).
Continuing the above, the IR framework generally offers more facility and helpers to perform advanced optimization, such as deobfuscation. Examples: dexdec offers an emulator and sandbox engine at the IR level, something unavailable at the AST level; gendec offers pattern matching facility making the development of complex IR rewriting rules easy.
The AST is closer to the final generated pseudo-code. As such, it is a place of choice to perform final beautification or clean-up passes. High-level clean-up, requiring the insertion of AST elements with no IR equivalents, can only be done at the AST level.
Generally, working at the AST level will seem more approachable and an easiest entry-point to writing decompiler plugins. However, in most cases, IR processors will be better suited to perform non-trivial optimizations and deobfuscation.
Development
For dexdec, IR and AST plugins can be developed as compiled jar, or plugin scripts (Java or Python). Plugin scripts are extremely convenient for quick prototyping. See example code in your JEB coreplugins/scripts/ folder.
For gendec, IR and AST plugins can be developed as compiled jar only. Support for plugin scripts will come soon.
Resources
This blog contains several tutorials on how to get started with writing IR and AST plugins for both dexdec and gendec.
In this post, we’re having a look at the first release of dProtect (v 1.0) by Romain Thomas. dProtect is a fork of ProGuard that provides four additional self-explanatory configuration flags:
-obfuscate-strings
-obfuscate-constants
-obfuscate-arithmetic
-obfuscate-control-flow (via flattening & opaque predicates — unfortunately, I was unable to get this flag to work, so it’s something we’ll have to revisit in the future.)
Let’s see how JEB’s dexdec’s built-in optimizers as well as custom IR plugins can be used to defeat some implementations of strings obfuscation, constants obfuscation, and arithmetic operations obfuscation.
Let’s disable dexdec’s built-in deobfuscators (CTRL+TAB to decompile, untick “Enable deobfuscators”) to get a chance to look at the obfuscated code. It decompiles to:
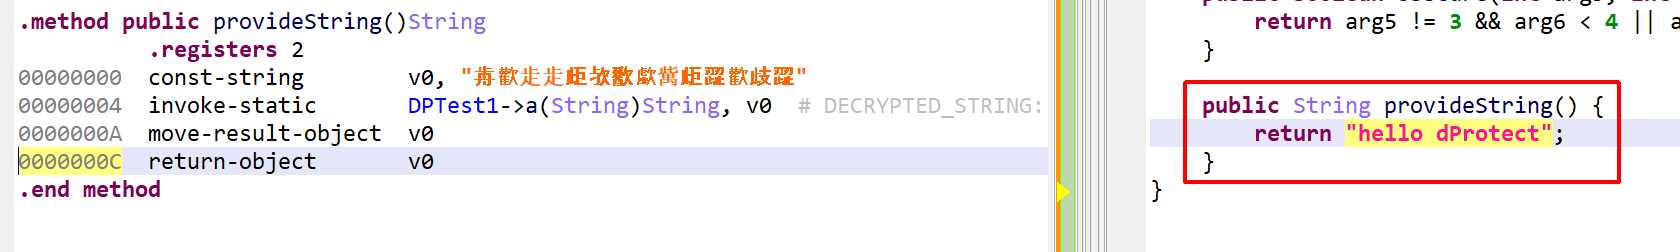
A decryptor method a(String):String was generated by dProtect. It performs various computations to decrypt the input string.
One built-in optimizer that ships with JEB’s dexdec uses the IDState object to perform emulation (explained in a previous blog). It cleans up such code automatically:
provideString() is auto-deobfuscated by JEB’s dexdec
Arithmetic Operations Obfuscation
The test method is as follows:
// targeted by: -obfuscate-arithmetic
public int calculate(int x) {
    return 100 + x;
}
With standard JEB settings (re-tick “Enable deobfuscators” if you had disabled it), the obfuscated code decompiles to:
As can be seen, the constant 100 has been replaced by an arithmetic operation, here, a XOR operating on an immediate and a static array element set up in the class initializer.
JEB does not ship with overly complex deobfuscators operating on arrays, because it is near-impossible in the general case to assess their finality (i.e. answer the question “will values be changed during the program execution?” definitively). However, to solve particular cases of obfuscation, writing a custom IR plugin to tackle this obfuscation is an acceptable solution. (Have a look at this post to get started on dexdec IR plugins.)
Let’s check DOptUnsafeArrayAccessSubst.java, a sample IR plugin that ships with JEB (folder coreplugins/scripts/) and does does exactly what we need: detecting the use of static array elements and replacing them by their actual values. We can enable the plugin by removing the “.DISABLED” extension. Now redecompile (CTRL+TAB). And… well, nothing has changed! It is time to examine the plugin code carefully, maybe even use your favorite IDE to troubleshoot and augment it. Here is what prevented the original plugin from kicking in: the plugin was looking for IR elements such as: IDArrayElt ^ IDImm. However, the IR it got was: (<int>IDArrayElt) ^ IDImm, that is, the array element was cast to int, making the IR expression an IDOperation, not an IDArrayElt.
Now we can redecompile. and things were deobfuscated as expected:
calculate() is deobfuscated by DOptUnsafeArrayAccessSubstV2
Constants Scrambling
Finally, let’s have a look at how constants obfuscation is achieved. The documentation gives examples of cryptographic-like S-boxes being initialized. The test method is as follows:
Note that the use of synthetic static arrays is made, as was the case for the arithmetic operations obfuscation pass. Therefore, let’s try the DOptUnsafeArrayAccessSubstV2 plugin. As careful examination of the above code may give in, the plugin fails to deobfuscate this code on the first go. The reason: if you examine the IR produced while debugging the plugin, you will notice that the static array elements are accessed via a variable (v0, above). In IR, those elements are IDVar. Therefore, we need to check whether this variable references a static array. We will do that by using the data flow analysis facility made available to all dexdec plugins (public field dfa of optimizers sub-classing AbstractDOptimizer):
...
analyzeChains();  // initialize the `dfa` member field
Long defaddr = dfa.checkSingleDef(insnAddress, varid);  // use-def chains
...
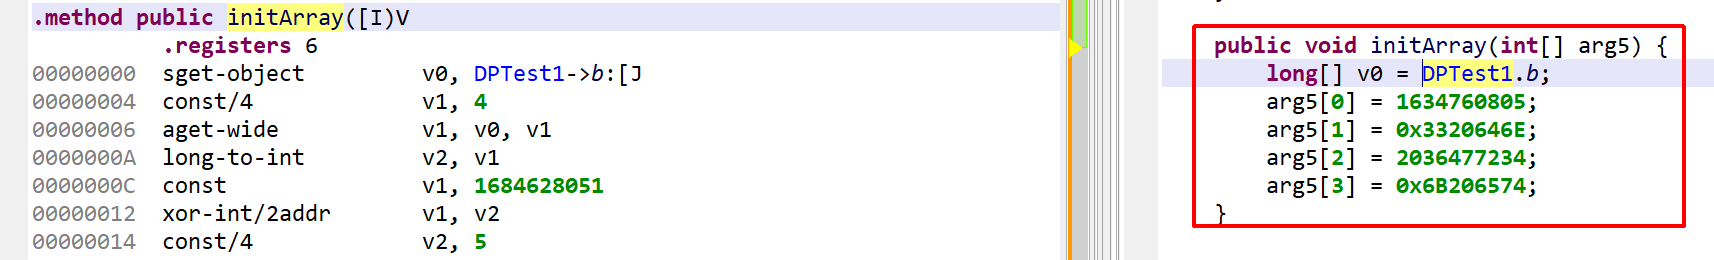
The obfuscated code is now processed as expected, and dexdec generates the following decompilation:
initArray() is deobfuscated by DOptUnsafeArrayAccessSubstV3
Conclusion and Future Work
dProtect is a great project to provide code obfuscation for the masses. Its compatibility with ProGuard makes integration into new and existing Android projects a breeze. I have little doubt many developers will try it out in the future. Let’s see how upcoming upgrades to the obfuscators fare against the decompiler!
In future blogs, we will have a look at dProtect’s control-flow obfuscation (once I’ve got it to work!) and we will see how O-MVLL, the LLVM-based native code obfuscator counterpart, does against JEB’s gendec (generic decompiler for native code).
Update: Oct 18 2023: as of JEB 5.4, JEB can parse Dart AOT snapshots version 2.10 to 3.1.
Update: Oct 5 2022: as of JEB 4.20, this plugin generates IDartAotUnit objects, easily accessible by API.
A “Dart AOT Snapshot” unit generated by the plugin (JEB >= 4.20), along with unit documents.
The original post can be found below:
JEB 4.17 ships with a Dart AOT (ahead-of-time) binary snapshot helper plugin to help with the analysis of pre-compiled Dart programs. A common use case for it may be to offer directions when reverse engineering Flutter apps compiled for Android x86/x64 or arm/aarch64 platforms.
Snapshots in ELF
Release-mode Flutter-based Android apps will generate AOT snapshots instead of shipping with bytecode or Dart code, like Debug-mode apps may choose to. The AOT snapshot contains a state of the Dart VM required to run the pre-compiled code.
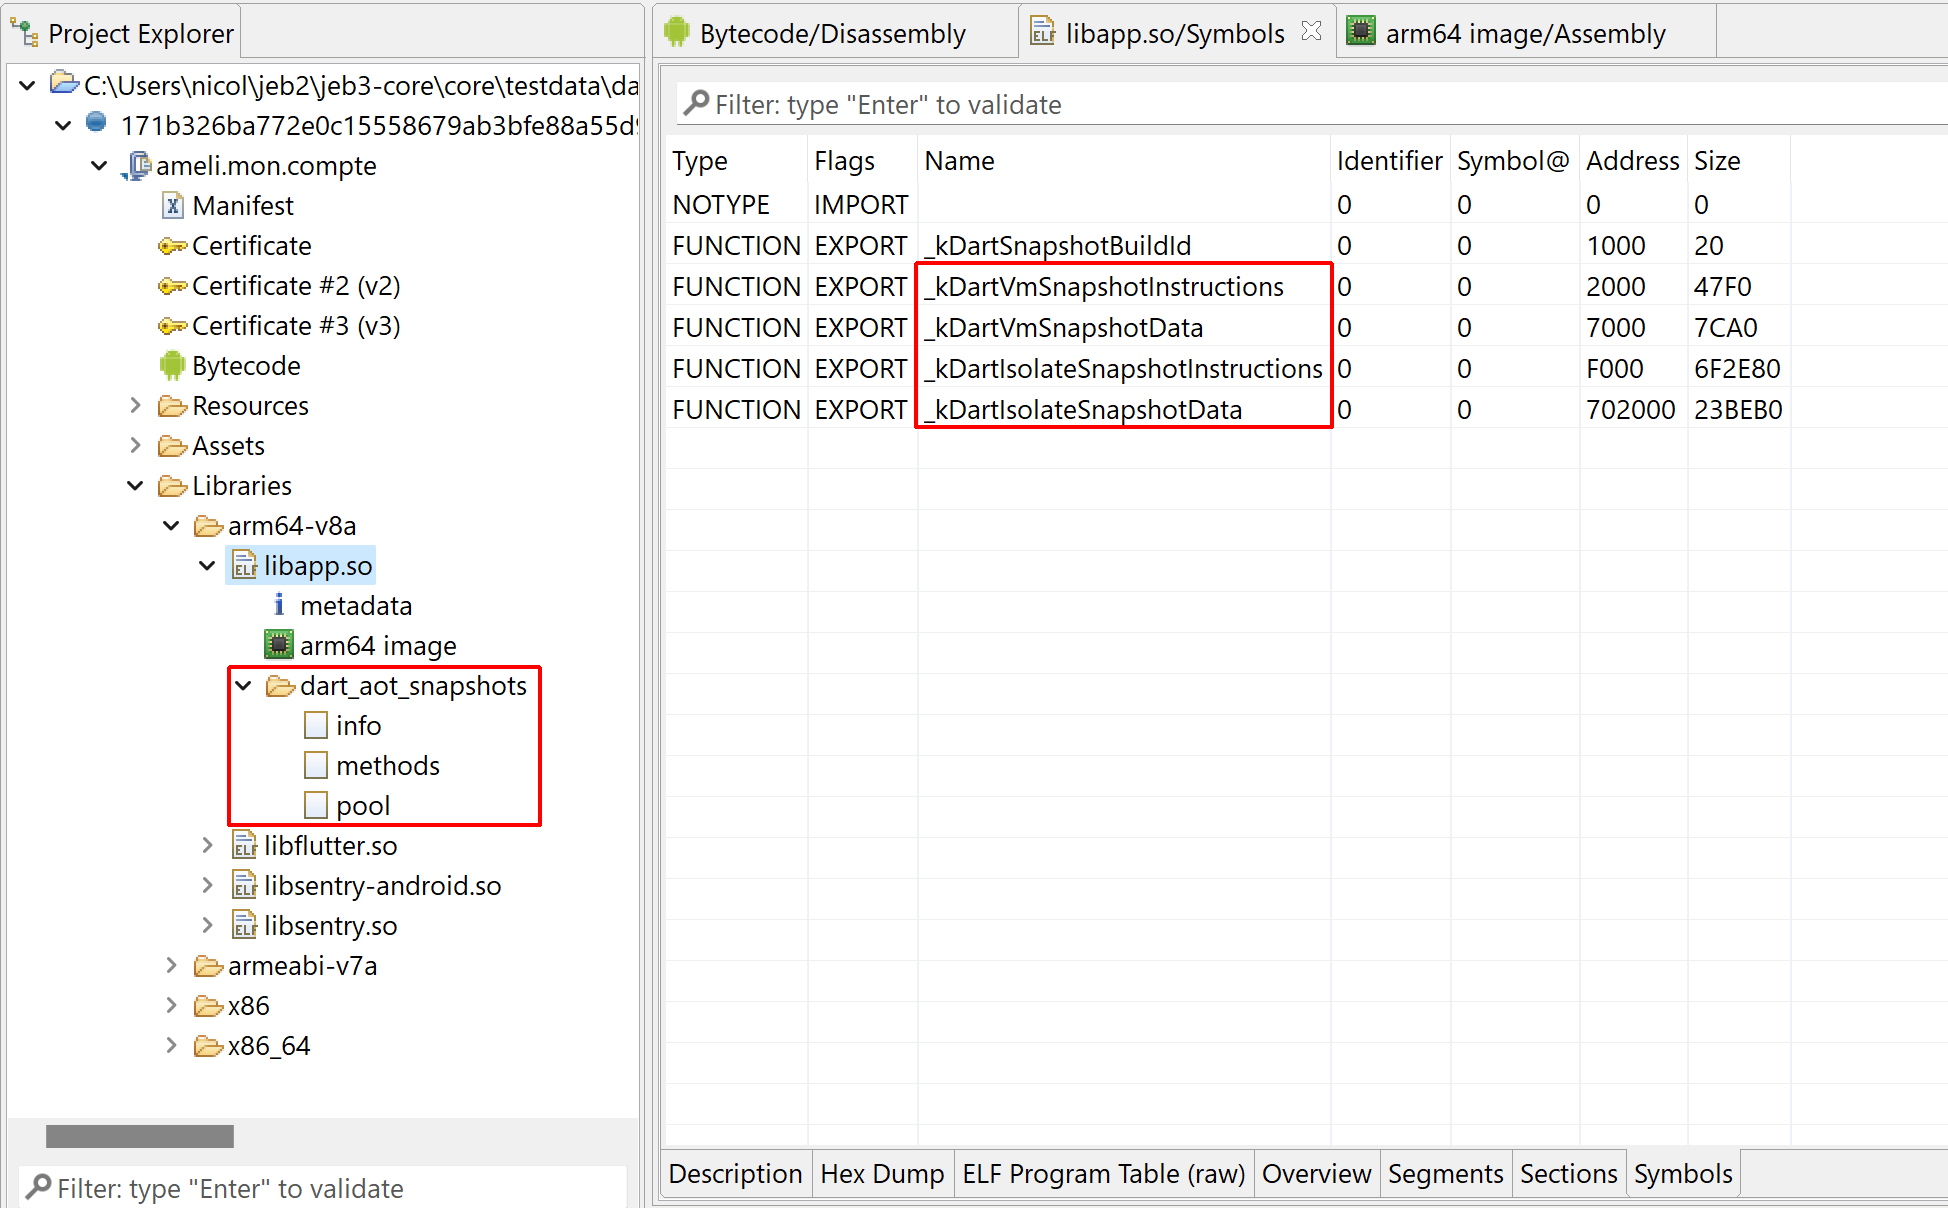
A snapshot is generally located in the lib/<arch>/libapp.so files of an APK. Since Dart may be used outside of Flutter, or since the file name or location may change, a reliable way to locate such files is to look for an ELF so exporting the following 4 symbols:
The XxxSnapshotInstructions symbols point to pre-compiled machine code. However, getting a starting point when dealing with stripped or obfuscated binaries may prove difficult. The XxxSnapshotData symbols point to Dart VM structures and objects that will be accessed by the executing code. That includes data elements such as pooled strings or arrays of immediate values. Snapshot data also include important metadata that will help restructure the hundreds or thousands of routines compiled in an AOT snapshot.
Using the Plugin
First, make sure that you are dealing Dart AOT snapshots or with a Flutter app containing precompiled AOT snapshots. Indeed other types of snapshots exist, such as JIT snapshots. The plugin does not provide help for those. In practice, non-AOT snapshots may be relatively easy to analyze, but you are unlikely to encounter them in the wild. Most Dart code or Flutter apps will be compiled and distributed in release mode. At best, some symbols and optional metadata may be left over. At worst, most will have been obfuscated (refer to Flutter’s --obfuscate option).
The plugin will automatically kick in and analyze AOT snapshots generated by Dart 2.10 (~Fall 2010) to Dart 2.17 (current at the time of writing). The analysis results will be placed in text sub-units located under the elf container unit. The code unit will be annotated (methods will be renamed, etc.), as explained in the next sections.
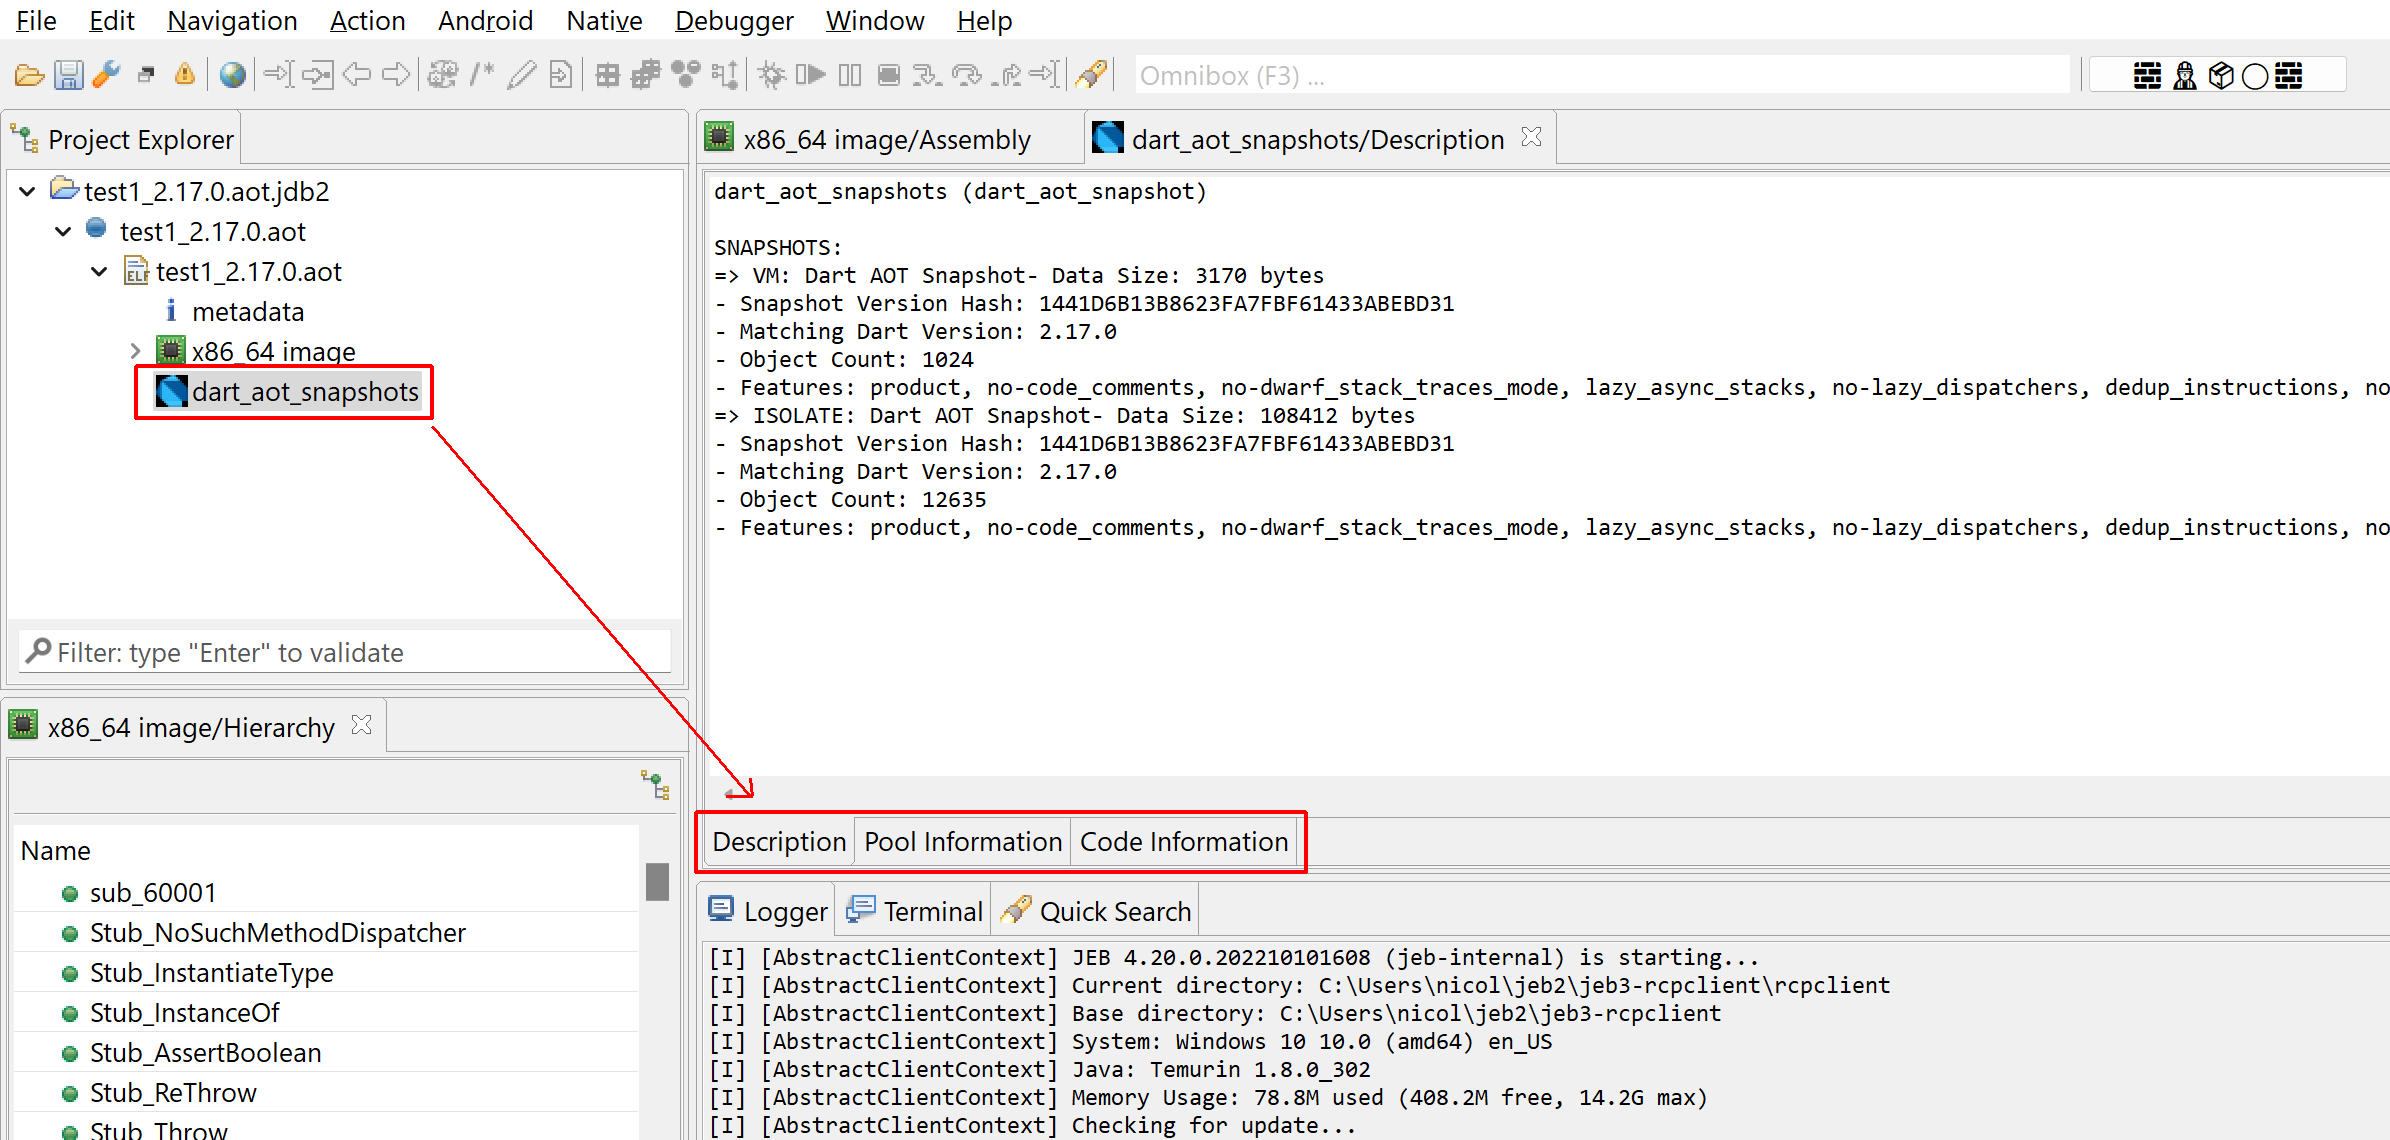
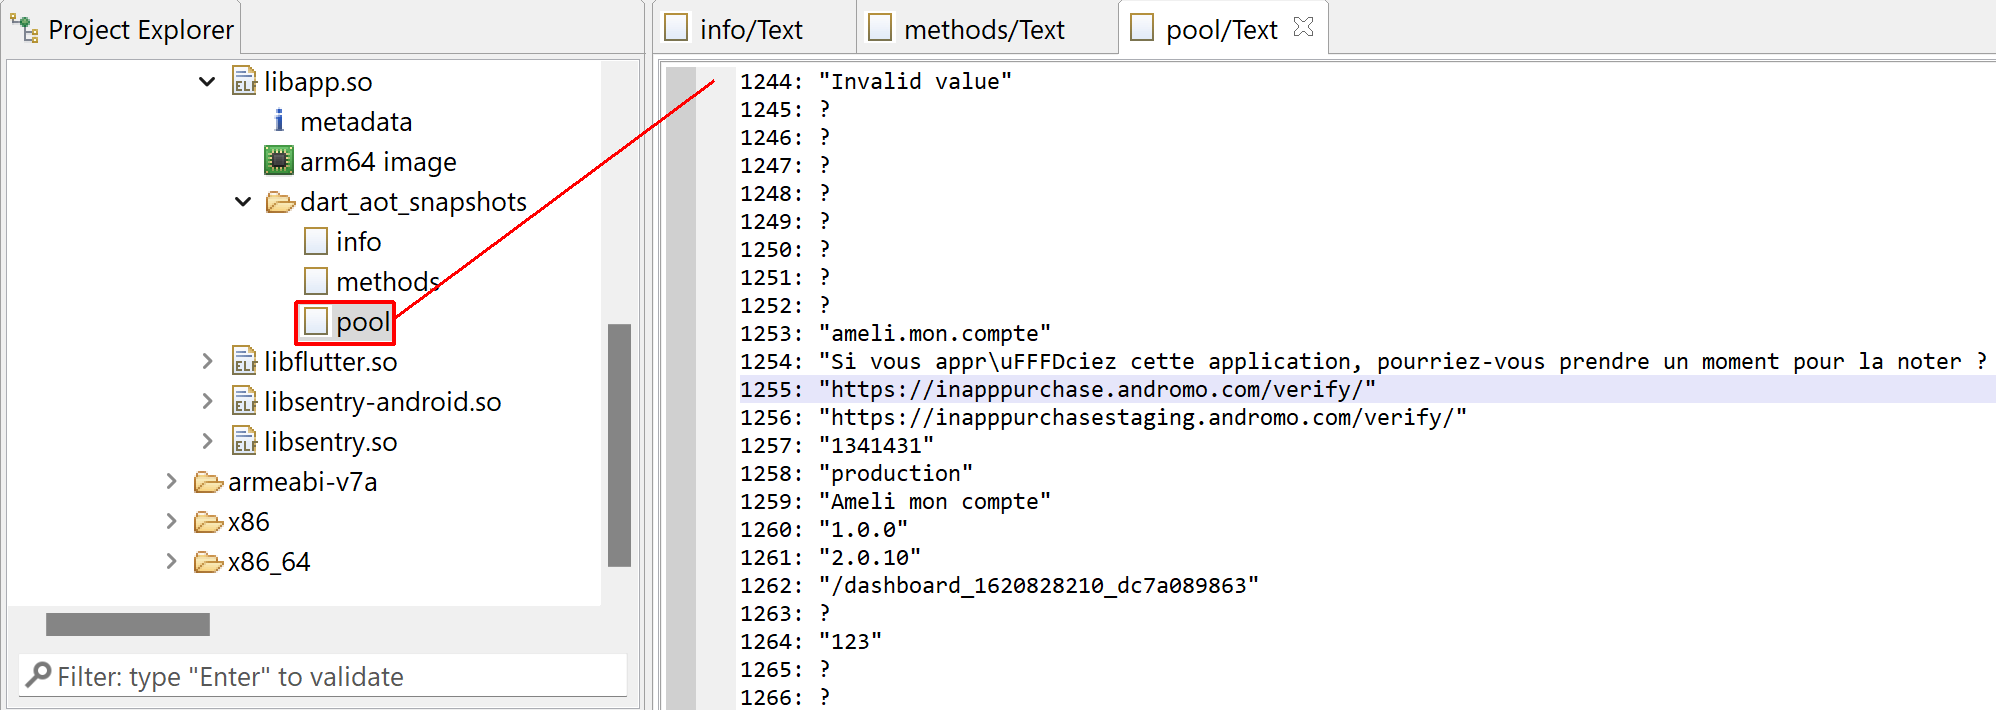
An aarch64 ELF file containing Dart AOT snapshots. The plugin generated reports in the dart_aot_snapshots sub-unit folder. Other information would be embedded into the native code unit itself (e.g. renamed routines, re-packaged routines, extra comments, etc.)is directly placed onto .
Textual Information
AOT snapshots contain lots of information. Deserializing them is relatively complicated, not to mention the fact that each revision of Dart changes the format — meaning that support will have to be added for Dart 2.18+ when that version ships… The plugin does not extract every potentially available bit of information. What is made available at this time is:
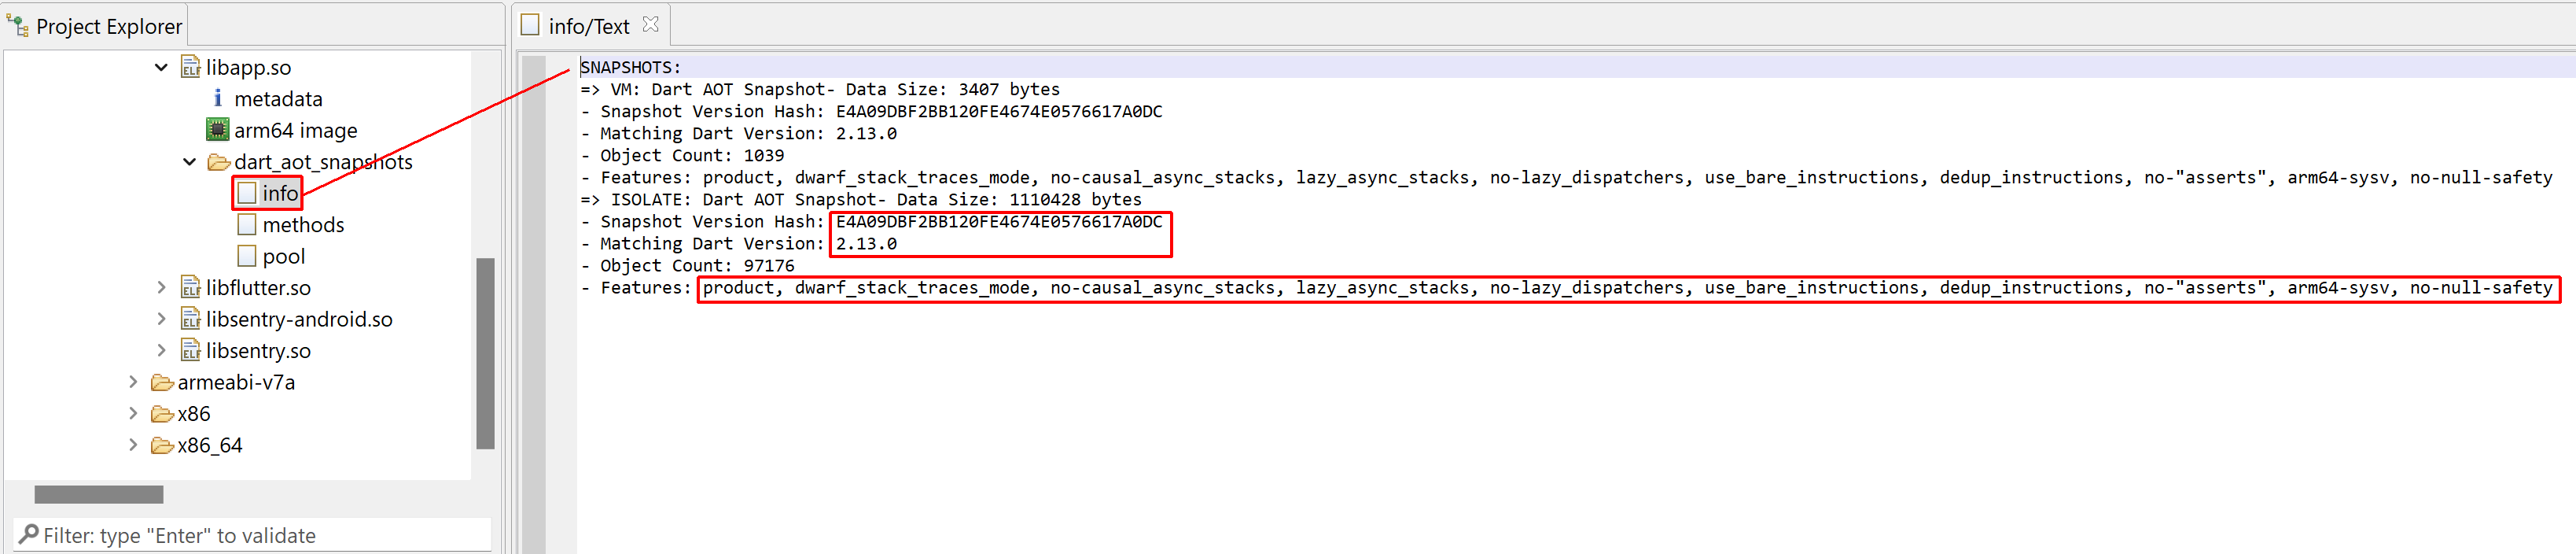
1- Basic information about the snapshots, such as version and features
Basic information about AOT snapshots
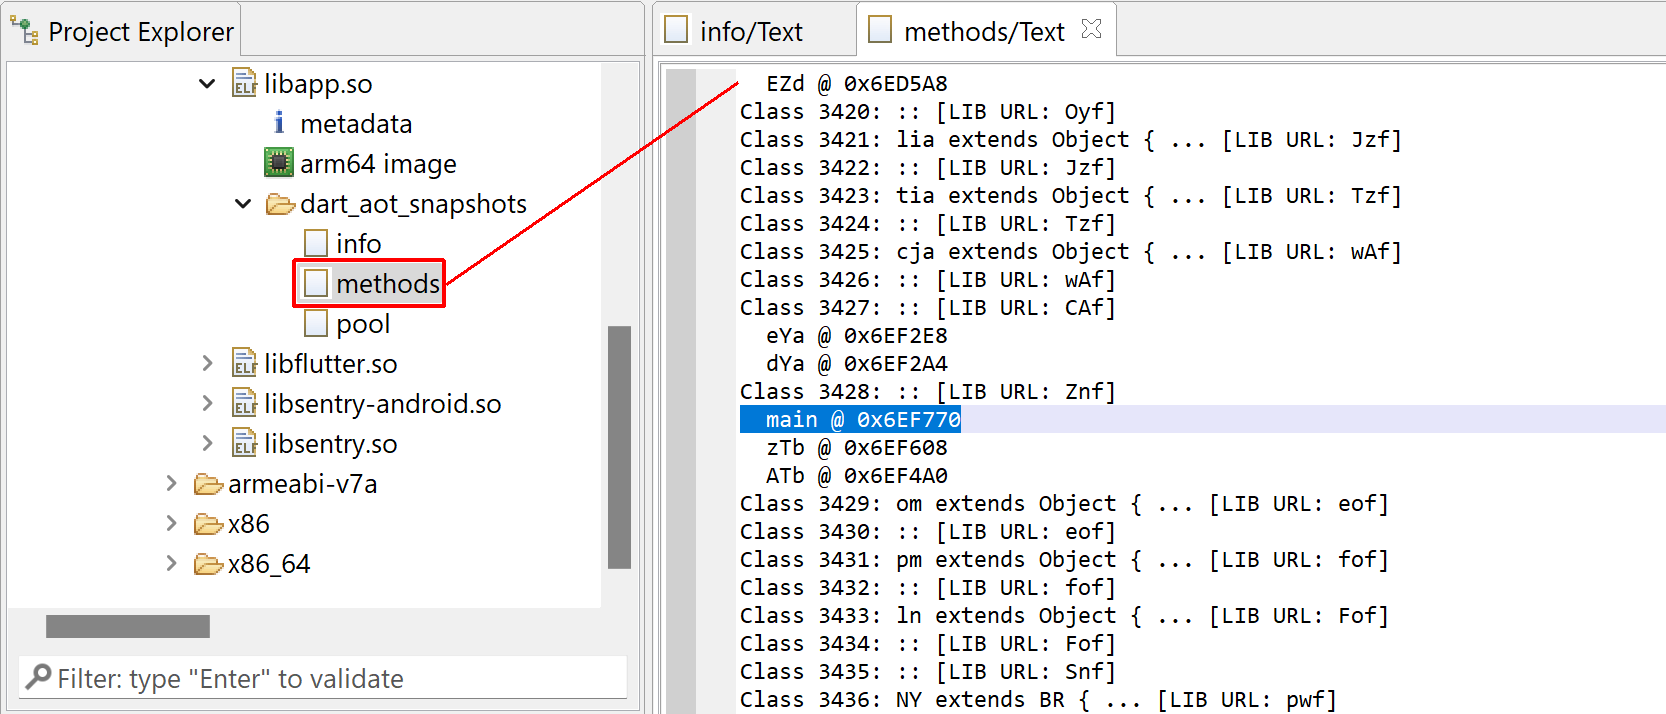
2- The list of libraries, classes, and methods
Classes, methods, libraries present a snapshot. Here, we can see that most names were obfuscated.
3- A view of the primary pool strings
Pooled items (including strings), some of them may be used by the natively executed code.
Code Annotations
Aside from static information, the plugin also attempts to:
1- Rename methods. Release builds will strip the method names from the ELF file. However, the AOT snapshot information references all AOT methods as well as their names, classes, library, etc. The names provided in the snapshot information will be applied to unnamed native routines.
You will be able to locate the main method, the entry-point of all Dart applications.
2- Annotate access to pooled strings. Native code accesses pooled items through a fixed register (containing an address into a pointer array to pooled elements). Below is a list of registers for the most common architectures:
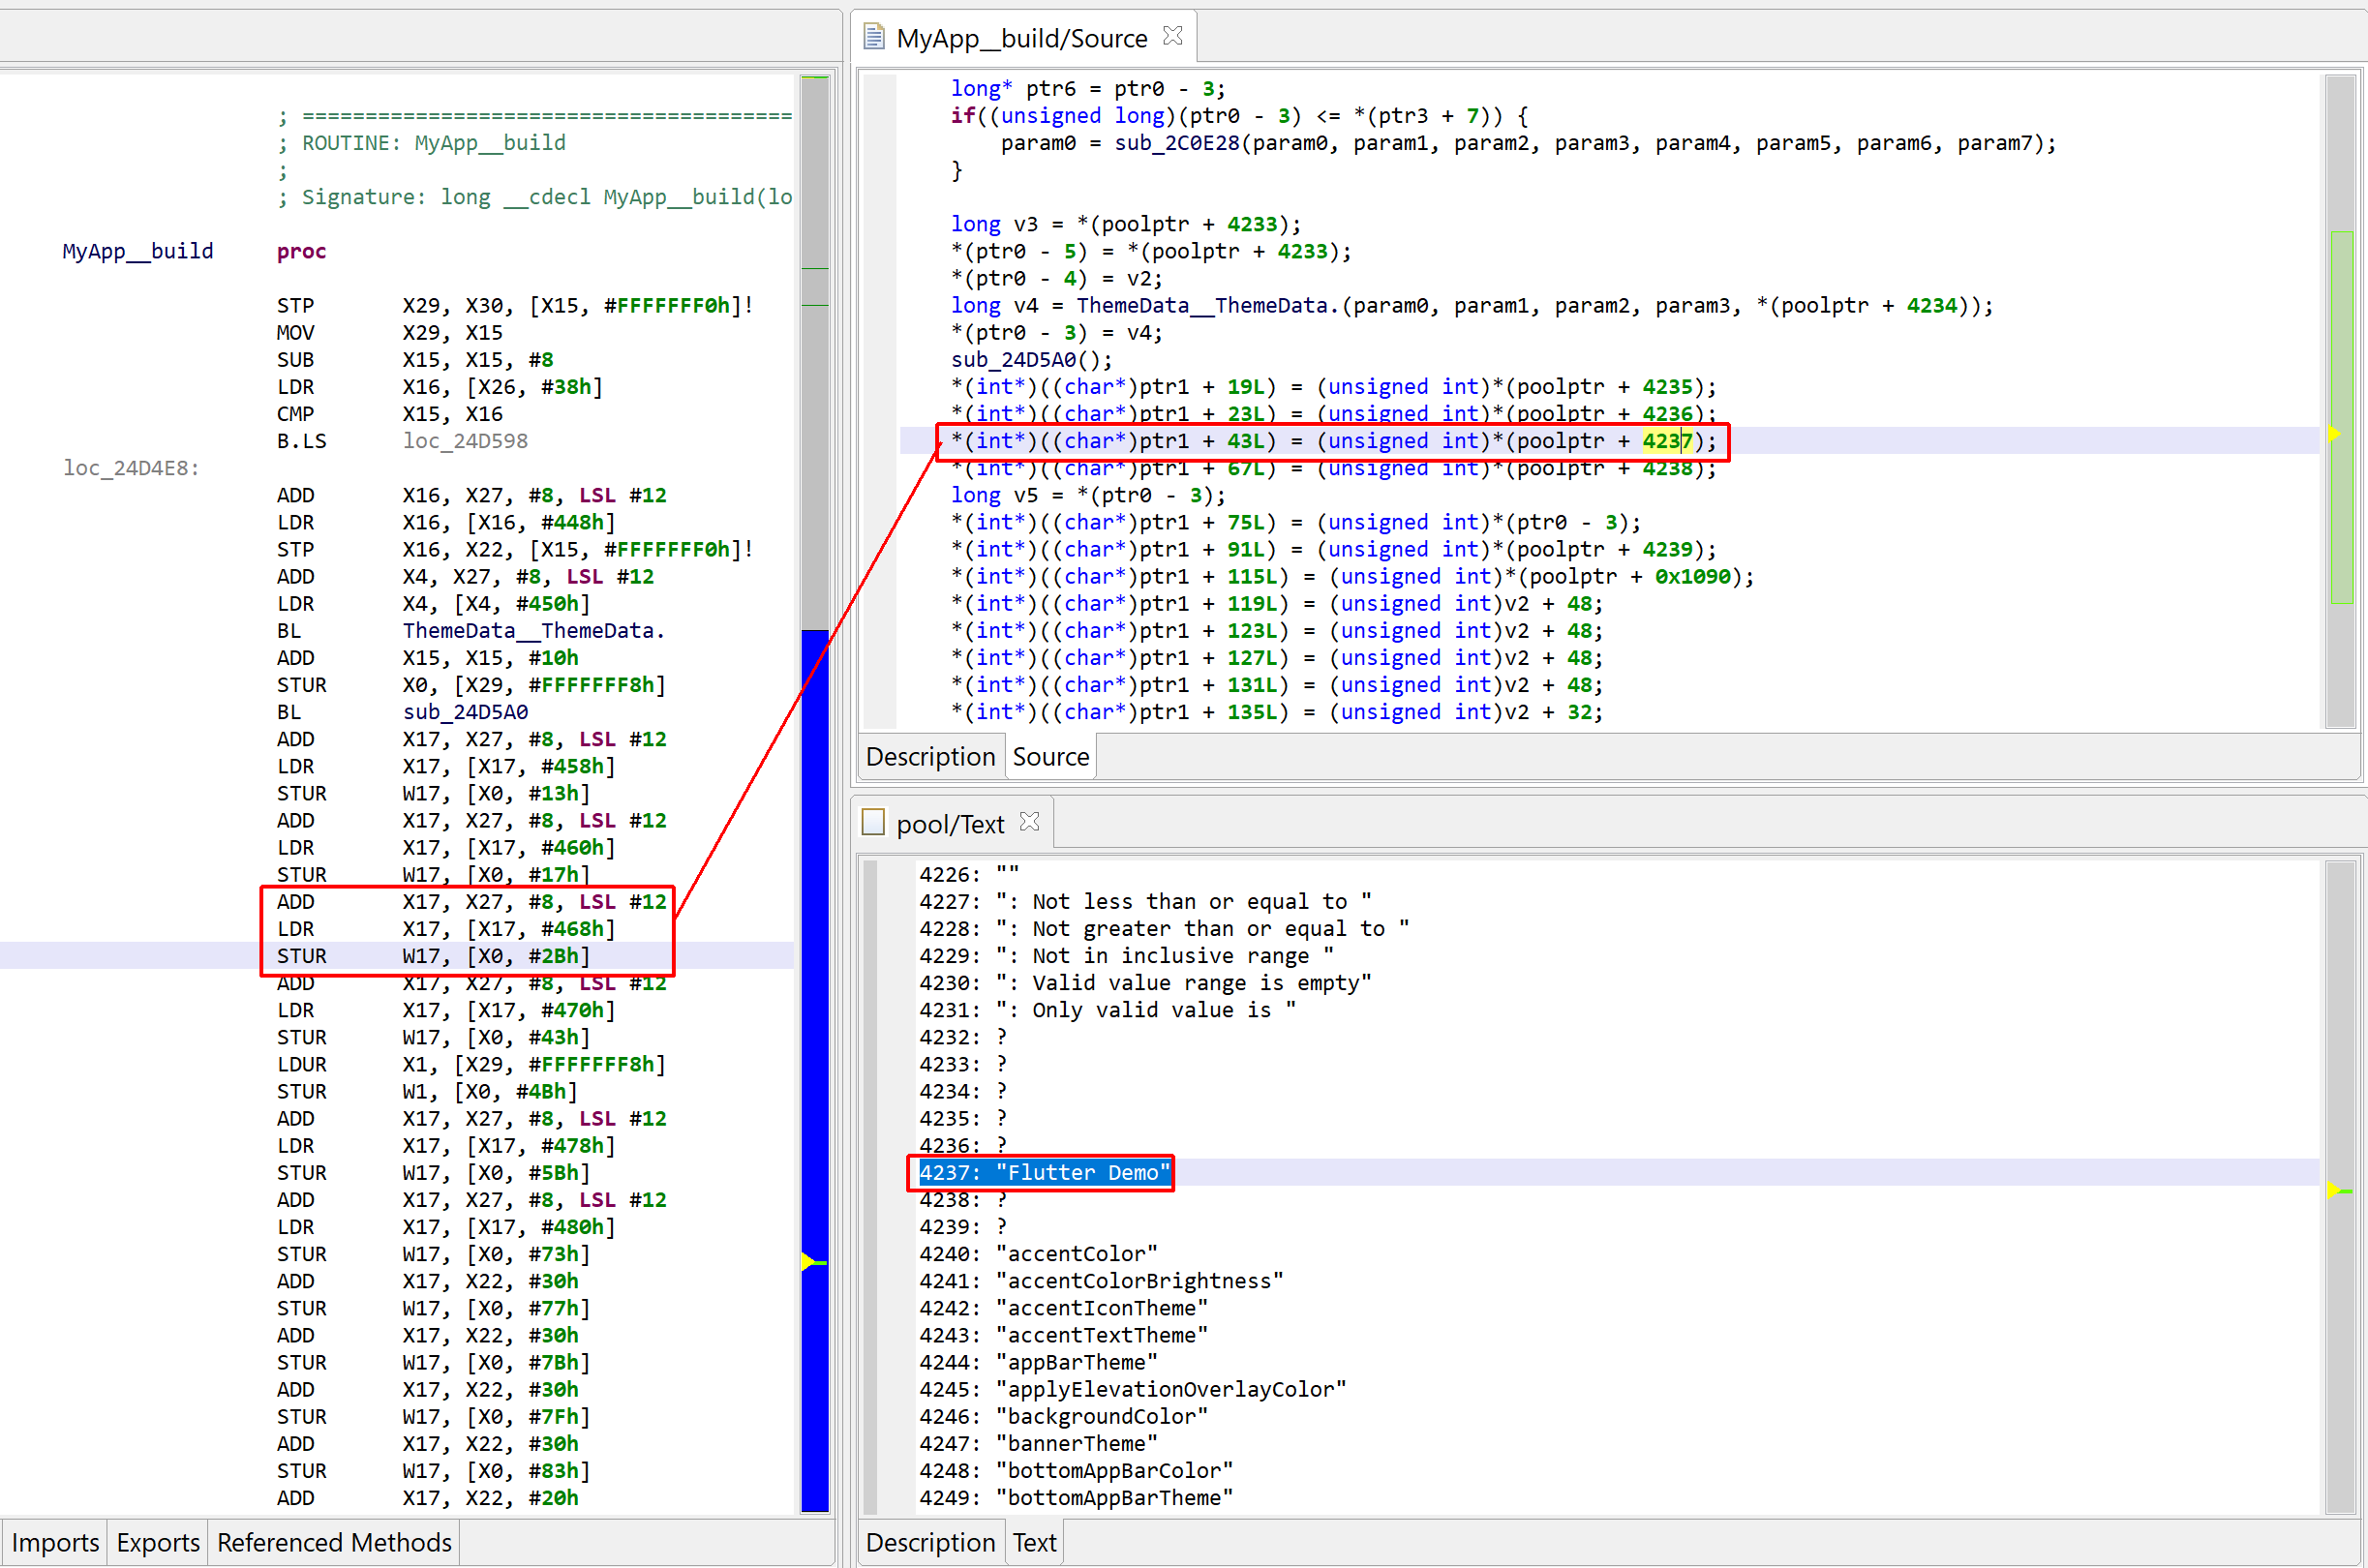
Unfortunately, due to how the assembly code for arm64 binaries is generated, those comments cannot be generated on such binaries. However, decompilation will yield slightly more digestible code, e.g.:
Pooled string access on an arm64 binary
Caveats & Conclusion
We recommend analyzing x64 or arm64 binaries, instead of their 32-bit x86 or arm counterparts, since the plugin may not parse everything properly in the latter cases. In particular, the functions are not mapped properly for arm 32-bit snapshots generated by recent versions of Dart (2.16’ish and above).
More could be done, in particular related to calling conventions (for proper decompilation), pseudo-code refactoring and restructuring (via gendec IR plugins for instance), library code flagging (e.g. classes and their methods belonging to dart::<well_known_namespace> could be visually standing out). Such additional features will be added depending on the feedback and the needs of the users. Please let us know your feedback via the usual means (Twitter, email, Slack).
Finally, thanks to Axelle Apvrille (@cryptax) for flagging Dart as something that JEB may be able to help with!
Further Reading
Discussion of the internal formats and binary details of AOT snapshots was out-of-scope in this blog. Readers interested in digging further should check the following resources:
At this point, you should be comfortable to dig through the source code at https://github.com/dart-lang/sdk. It is the ultimate source of truth, look no further 🙂 In particular, the runtime/vm/*_snapshot.[h,cc] files (and related files, such as class_id.h or raw_object.h) contain most information about the serialized snapshot formats.
Bonus reading material: https://mrale.ph/dartvm/ to get a high-level understanding of the Dart VM.
This article is a guide to reverse engineer Simatic S7 PLC program blocks. 1
Last revision: May 10 2022.
Introduction
PLC (Programmable Logic Controllers) are specialized computers designed to control industrial systems having real-time processing requirements. They take inputs provided by sensors and generate outputs for actuators. As programmable devices, they execute user-provided software and therefore are susceptible to some classes of software attacks. The most publicized demonstration of that was made by the Stuxnet malware, whose end-goal was to take control, damage, and destroy arrays of centrifuges in a uranium enrichment plant. The analysis of the malicious PLC payload proved to be a long and tedious road 2, and up to this day, tooling and knowledge related to those systems remain limited relative to broadly-known architectures such as x86 or arm.
We attempt to bridge some of this gap by providing S7 analysis modules for JEB Pro. This article shows how they can be used to acquire, analyze, disassemble and decompile PLC program blocks intended to run on Siemens Simatic S7-300 and S7-400 devices, a very popular line of PLC used to operate industrial processes.
Terminology
Throughout the rest of this document, the terms PLC, S7 or S7 PLC are used interchangeably to refer to S7-300 or S7-400 PLC devices. Newer devices in the S7 product line, namely the S7-1200 and S7-1500, are not supported by this JEB extension and won’t be considered here.
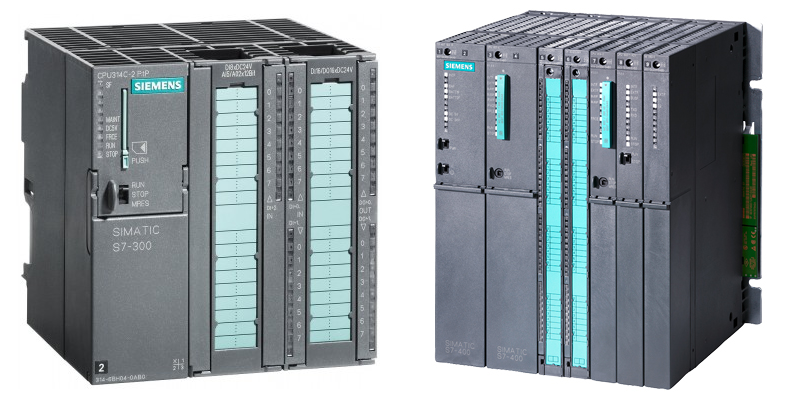
Models of Simatic S7-300 (left side) and Simatic S7-400 (right side) – Image (c) Siemens
The official IDE used to program S7 PLC is called Step 7. Step 7 may be used as-is or as a part of the larger software suite Totally Integrated Automation (TIA).
A PLC program is made of blocks, such as data blocks, function blocks, and organization blocks. In this document, the term program may be understood as (collection of) blocks.
A program is downloaded to a PLC from a Programming Station, that is, a Windows-based computer running the Step 7 editor. When a program is retrieved from a PLC, it is uploaded to the programming station.
The assembly language STL (Statements List) and its bytecode counterpart, MC7, are sometimes used interchangeably.
Finally, the names Simatic, Step 7, and Totally Integrated Automation are trademarks of Siemens AG (“Siemens”).
Primer on S7
This section briefly presents what S7 programs are, their structure, as well as lower level details important to know from a reverse engineering perspective.
Programming Environment
S7 PLC are programmed using Step 7 or TIA’s Step 7 (TIA is a platform required to program the most recent S7 devices), the IDE running on a Windows computer referred to as the Programming Device. Once the program is written, it can be downloaded onto a physical PLC or a simulator program (such as PLCSIM, part of Step 7).
Blocks
A PLC program is a collection of blocks. Blocks have a type (data, code, etc.) and a number.
Data blocks:
User data blocks are referred to as DB if they are shared by all code, or DI if they belong to a code block
System data blocks are named SDB
Code blocks, also called logic blocks:
Organization Blocks (OB) are program entry points, called by the firmware
The principal OB is OB1, the program’s main entry point. It is executed repeatedly by the firmware.
Other OB can be programmed and called when interruptions happen, exceptions occur, timers go off, etc.
Function blocks (FB) and System Function blocks (SFB) are routines operating on a provided data block, called the instance data block (DI)
Function (FC) and System Functions (SFC) are routines that do not require a data block to operate
The distinction between FB and FC is subtle. Any FB could be written to perform equivalently as an FC, and vice versa. They exist as an easy way to distinguish between a function working as-is, like a C routine would (FC), and a function working on a collection of pseudo-encapsulated attributes, like a C++ class method would (FB).
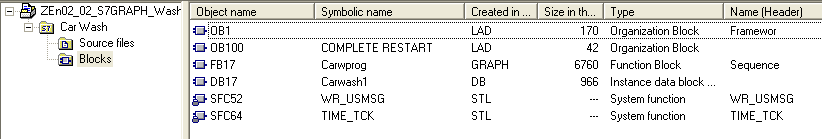
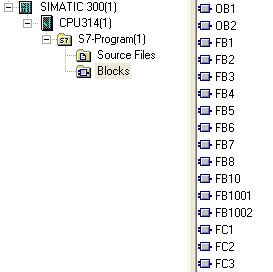
A sample program consisting of two OBs, one FB and its associated DB. Two system functions are used.A larger program designed to run on a S7-300 CPU 314.
There are various ways to write PLC code. Programmers may choose to write ladder diagrams (LAD) or function block diagrams (FBD); complex processes may be better expressed in statements list (STL) or in a high-level Pascal-like language (SCL). Regardless of source languages, the program is compiled to MC7 bytecode, whose specifications are not public.
A piece of MC7 bytecode is packaged in a block, along with some metadata (authoring information, flags, etc.) and the interface of the block. The interface of a data block is the block definition itself, a structure type. The interface of a logic block is its set of inputs, outputs, local variables, as well as static variables in the case of a FB, or return value in the case of a FC.
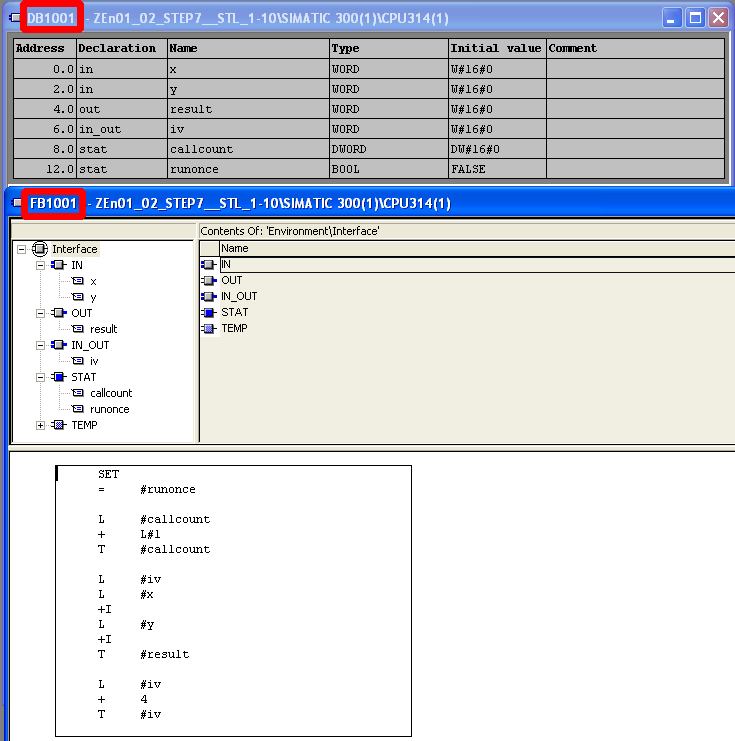
Example code of a Function Block (FB1000) programmed in STL and an associated data block DB1000. Note that both blocks share the same interface (IN/OUT/IN_OUT/STAT(=static)) data. The TEMP data section of the FB holds transient locals.
MC7 Code
PLC may be programmed using a variety of methods, such as:
Ladder logic (LAD)
Function block diagrams (FBD)
Assembly-like statement list (STL)
Structured control language (SCL, a high-level Pascal-like language)
Other methods exist
Step 7 compiles all source codes to MC7 bytecode, a representation that will be translated and executed by a virtual machine running on the PLC.
The MC7 instructions map STL statements, with several notable exceptions (e.g. STL’s CALL is translated to UC/CC with additional code to prepare the Address Register pointer, opened Data Block, set up parameters on the Locals memory area in the case of FC/SFC call, etc.).
Execution Environment
The execution environment for MC7 bytecode is the following:
Memory areas:
Digital input, called I (0 to 65536 addressable bytes)
Digital output, called Q (0 to 65536 addressable bytes)
Global memory, called M (0 to 65536 addressable bytes)
Local memory, called L (0 to 65536 addressable bytes)
A special area V references the local memory of the caller method, i.e. if function f1 calls function f2, V in f2 is L of f1
Shared data block bytes via the DB1 register, called DB
Instance data block bytes via the DB2 register, called DI
Timers, called T (256 addressable 16-bit timers)
Counters, called C (256 addressable 16-bit counters)
Registers:
A program counter PC, not directly accessible
The PC is modified by intra-routine branching instructions (JU/JL/JC/…)
A 16-bit Status Word register (only the 9 lower bits are used), from #0 to #8:
FC: First-Check: if 0, indicates that the boolean instruction to be executed is the first in a sequence of logic operations to be performed (“logic operation string”)
RLO: Result of Logic Operation: holds the result of the last executed bit logic operation
STA: Status: value of the current boolean address
OR: Determine how binary-and and binary-or are combined
OS: Overflow Stored: copy of the OV bit
OV: Overflow: set by integer/floating-point instruction on overflow
CC0/CC1: Condition Codes: updated by arithmetic instructions and comparison instructions (see arithmetic and branching instructions for details on how CC0/CC1 are set and used)
BR: Binary Result: can be used to store the RLO (via SAVE); is used by system functions (SFC/SFB) as a success(1)/error(0) indicator
Two 32-bit address registers (AR1/AR2)
The address register hold a MC7 4-byte pointer (see section on MC7 Types). The area part of the pointer may be ignored (for area-internal access), or may be used (for area-crossing access)
Two or four 32-bit accumulators (ACCU1/ACCU2, ACCU3/ACCU4 optionally)
Two data block registers, not directly accessible
Translation in JEB
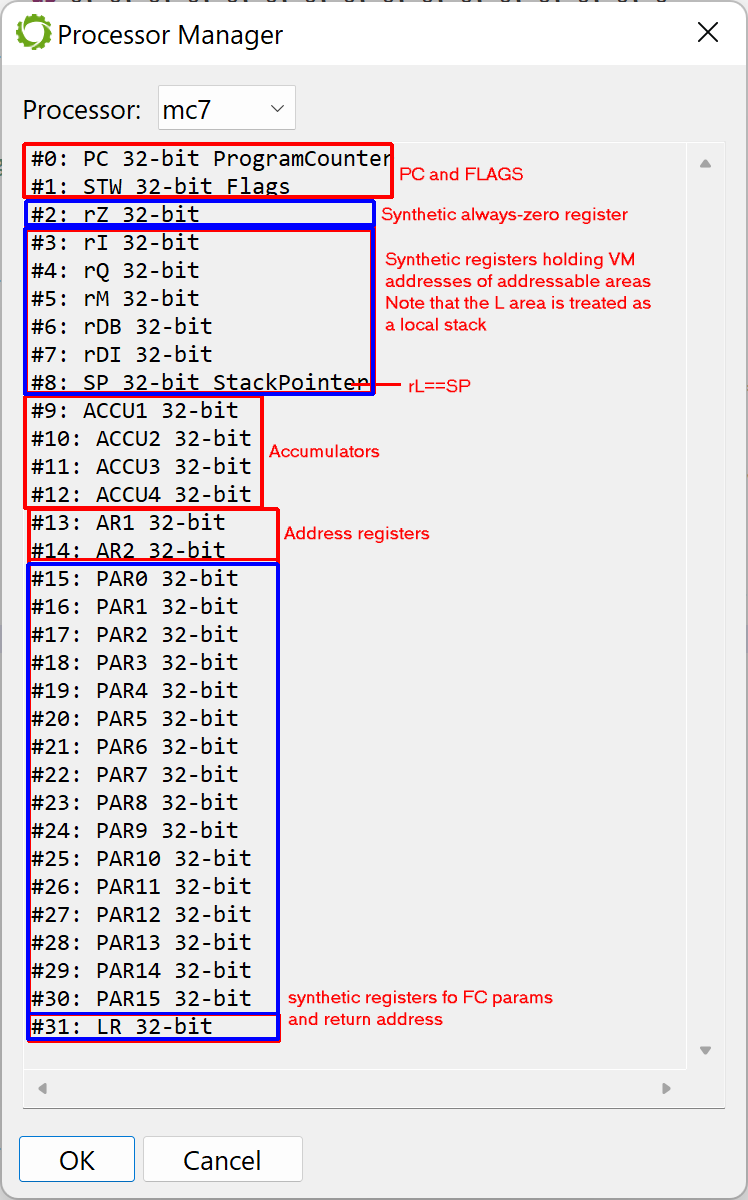
JEB’s MC7 plugin mirrors the execution environment, and adds several synthetic (artificial) registers to help with MC7 code representation and code translation to IR for the decompiler. The processor details can be examined in the GUI client (menu Native, handler Processor Registers).
Registers defined by the MC7 processor plugin
Instruction Set
Familiarity with STL is a topic that PLC reverse engineers will need to get familiar with. However, a complete and detailed guide to general STL programming is outside the scope of this document. Specific STL instructions will be discussed as need-be.
The instructions are grouped into the following categories:
bit logic: not/and/or/xor/and-not/or-not/xor-not, RLO access, etc.
word logic: and/or/xor on words
integer ops: add/sub/mul/div/mod, on 16- or 32-bit ints
shift/rotate: self-explanatory
floating ops: iee754 fp32 operations
comparison: compare and set CC0/CC1
conversion: int to float, float to int, signed extensions, etc.
data block: open data blocks as shared/instance, etc.
load/transfer: read and write the accus and address regs
accumulator: specific accumulators instructions
logic control: jumps, unconditional or CC0/CC1-based
program control: sub-routine calls to FB/FC/SFB/SFC
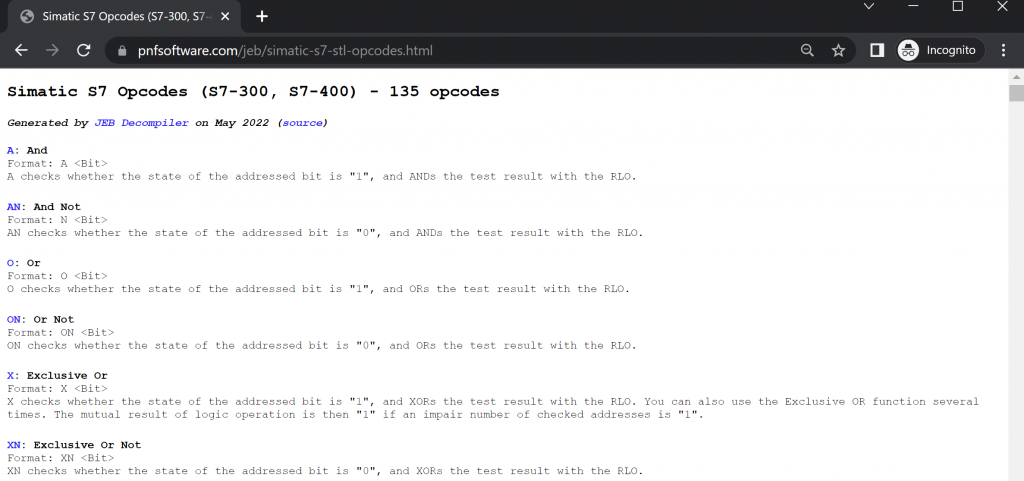
If you are looking for a quick reference on some opcode, this page may be more handy than the full reference manual.
Operands
Instructions carry 0 or 1 operand. The operand type can be one of the following:
Access to some area bytes or a direct immediate: L MB 300: load the global byte at address 300 (decimal) into ACCU1 L L#1000: load the double-integer value 1000 into ACCU1
Indirect access, optionally using AR1/AR2:
Area-internal: the area is hardcoded in the instruction (below, I) = I [MD 100]: assign RLO to the input bit at X, where X is the pointer located at offset 100 of the global memory (M) X I [AR1, P#30.4]: binary-xor RLO with the input bit located at *(AR1+30.4)
Area-crossing: the target area is determined dynamically AN [AR1, P#10.0]: binary-and-not RLO with the bit located at *(AR1+10.0), the target area is specified in the MSB of AR1 T QW [AR2, P#2.0]: transfer ACCU1L to the word located at *(AR2+2.0)
A bit operation: A I 2.0: binary-and RLO with the input bit 2.0 (bit #0 of byte 2) O Q 40.4: binary-or RLO with the output bit 40.4
A branching immediate, in word units: JU 15: jump to “instruction address + 2 *15”
Parameter access (for FC calls): T Z#6.0: transfer ACCU1 to the third parameter
Implicit operands, zero or one: NOP 0 NOP 1
Types
Interestingly, some instructions encode the type of operand immediate (this allows for unambiguous STL code rendering). Below is a list of examples with the L instruction, which loads ACCU1 with an immediate value. Note that the immediates are encoded big-endian:
TYPE      INSTRUCTION          BYTECODE      IMM. (BE, 8- 16- or 32- bit)

bin32     L 2#10101010         300200aa      0x00aa

dec16     L 1000               300303e8      0x03e8
dec32     L L#1000000          3803000f4240  0x000f4240
hex8      L B#16#45            2845          0x45
hex16     L W#16#6677          30076677      0x6677
hex32     L DW#16#11223344     380711223344  0x11223344

float32   L 3.14               38014048f5c3  0x4048f5c3

char1     L 'z'                3005007a      0x007a
char2     L 'ab'               30056162      0x6162
char4     L 'abcd'             380561626364  0x61626364

bytes2    L B#(3, 6)           30060306      0x0306
bytes4    L B#(3, 6, 7, 8)     380603060708  0x03060708

bcd       L C#345              30080345      0x345

pointer   L P#100.2            380400000322  0x00000322 (area NOT specified)
pointer   L P#M 10000.0        380483013880  0x83013880 (area specified)

time      L T#10s31ms          38090000272f  0x0000272f
date      L D#2022-4-25        300a2e1a      0x2e1a
tod       L TOD##16:20:59.100  380b03821e5c  0x03821e5c
s5t       L S5T#1m40s          300c2100      0x2100
The types used in STL or MC7 are described in the next section.
Bit operations, RLO and FC
Newcomers to STL may be baffled by this type of code:
// assume a new routine
A I 0.0  // 1. binary-and
A I 0.1  // 2. binary-and
= Q 1.0  // 3. assign the result (in RLO) to output bit 1.0
If "A <SRC>" means "RLO = RLO & <SRC>", what does line (1) do, and does it depend on the value of RLO at (1)? The general case answer is no. A more precise translation of A would be:
if FC == 0:
  RLO = SRC
  FC = 1
else:
  RLO = RLO & SRC
If the FC flag is false, RLO takes the value of the source bit. What is the value of FC then? At the beginning of a program, it is false (because the sub-routine dispatch instructions – such as UC – set it to 0). It is also set to false after an end-of-logic-string operation, such as = (assign the RLO to a destination).
Data and Interfaces
Every block, code or data, has an interface that defines…
for a data block: the structure of the data block itself
for a logic block: its parameters for invocation
FC Block Interface
The interface of an FC block consists of at most 4 sections. The order matters.
IN: Input parameters
RET: single return value
IN_OUT: input/output parameters
OUT: output parameters (any number of returned values)
FB Block Interface
The interface of an FB block consists of at most 4 sections (they are not the same as FC’s though). The order matters as well, since it determines the memory layout of the associated DB.
IN: input parameters
OUT: output parameters
IN_OUT: input/output parameters
STATIC: the static data (held by the associated instance DB, and laid out right after the parameter data, that is, IN/OUT/IN_OUT)
Local Area
The interface of a logic block may also defines a TEMP area, holding temporary local variables (area L). Note that the local storage, just like any other storage, may be accessed without the need to be defined in an interface. Example:
L LB 3  ; load the byte at 0x3 in local storage into ACCU1
T QB 4  ; transfer ACCU1 to the output byte at 0x4
In practice, L-variables are going to be defined for most user-generated code. However, many synthetic statements generated by the compiler for behind-the-scene operations use L-variables that are located after what’s defined by the interface of a logic block.
The binary interfaces located in compiled blocks do not carry the names used when defining those interfaces.
Types
The variables defined in an interface belong to three general categories:
Elementary types: primitive types not exceeding 4 bytes (e.g. BYTE, WORD, INT)
Complex types: compound types (e.g. ARRAYs) and large types (e.g. DATE_AND_TIME)
Parameter types: block number, timer, counter, pointers or references
=> Elementary types: ("normal" types)
TYPE     BITSIZE  DESCRIPTION
BOOL           1  single bit stored on 1 byte
BYTE           8  unsigned integer
CHAR           8  ascii character
WORD          16  unsigned integer
INT           16  signed integer
DWORD         32  unsigned integer
DINT          32  signed integer
REAL          32  ieee-754 fp32 number
DATE          16  date (number of days since Jan 1 1990)
S5TIME        16  elapsed time in [0, 2h46m30s] (*)
TIME          32  elapsed time in ms, range +/- ~24d20h
TIME_OF_DAY   32  time of day in ms since midnight

=> Complex types: ("normal" types, continued)
TYPE     BITSIZE  DESCRIPTION
DATE_AND_TIME 64  timestamp (*)
STRING[n]     var strings, 16 to 2048 bits, n in [0,254] (*)
ARRAY         var N-dimensional arrays (*)
STRUCT        var structures

=> Parameter types: ("special" types, used in IN/OUT/IN_OUT sections)
TYPE     BITSIZE  DESCRIPTION
POINTER       48  pointers (*)
ANY           80  pointers with size (*)
TIMER         16  timer number
COUNTER       16  counter number
BLOCK_FB      16  FB number
BLOCK_FC      16  FC number
BLOCK_DB      16  DB number
BLOCK_SDB     16  SDB number

(*) details follow
JEB generates equivalent native types. They carry the same names and may be examined with the Type Editor in the GUI (menu Native, handler Type Editor).
Most types are self-explanatory. A few types require additional information.
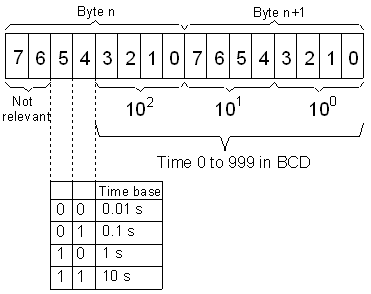
S5TIME type
The S5TIME type is essentially a BCD (binary coded decimal) value ranging from 0 to 999 (in 1/10s), with a multiplier from 1 to 1000, stored on a word. The maximum value is therefore 9990 seconds, which is 2h46m30s.
Layout of a S5TIME object in memory – Image (c) Siemens AG
DATE_AND_TIME type
This type, also referred to as DT, holds a date/time value (similar to another type S7TIME (described later), although the S7TIME uses 6-byte instead of 8). It is limited to dates after Jan 1 1984. Each component of the DT is BCD-coded:
Byte     Value    Description
0        Year     90-99=>1990-1999, 00-89=>2000-2089
1        Month    1 to 12
2        Day      1 to 31
3        Hour     0 to 23
4        Minute   0 to 59
5        Second   0 to 59
6 (hi)   Millis2  0 to 9 (*100)
6 (lo)   Millis1  0 to 9 (*10)
7 (hi)   Millis0  0 to 9
7 (lo)   DoW      1 to 7 (1=Sunday)
Array types of single- or multi-dimensional types whose element type may be any primitive of complex type, with the exception of ARRAY.
Note that it is common practice for PLC programmers to use non-zero based arrays, e.g. ARRAY[1 ..10, 1..20 ] of INT. The first element of this two-dimensional array would be [1,1]. Therefore the translated code to access an element [x,y] in memory is slightly more elaborate than RowLength*x+y, it would be RowLength*(x-1)+(y-1).
String types
The string types are fixed-length arrays of single-byte characters. They can hold from 0 to 254 characters. The layout in memory is as follows:
M L A(0) ... A(n-1)
where:
  M is a byte holding the maximum length
  L is the current string length (L <= M)
  A(i) are the string bytes

Example of a STRING[8]:
  08 05 41 41 41 41 41 00 00 00
would be the 5-char string 'AAAAA', which can accommodate up to 8 characters
The string types are STRING[0], STRING[1], STRING[2], …, STRING[254]. The STRING type is an alias for STRING[254].
Just like other complex types (arrays, structs, DT), string types are always 16-byte aligned in memory.
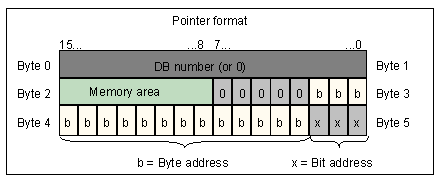
POINTER type
The pointer type (referred to as MC7 pointer in this document) is used to reference the address of a variable. It is 6-byte long, and made of two parts:
The WORD at 0 is a DB number if the data is stored in a data block (else it is 0), that is, the basic pointer (see below) references a DB/DI block
The DWORD at 2 is a 4-byte address (referred to as MC7 address)
A MC7 address has the following bit layout:
AAAAAAAA 00000BBB BBBBBBBB BBBBBXXX
where:
  A is the area code
  B the address in bytes [0,65535]
  X the bit position in [0,7]
The area codes are as follows: (reference: S7.AreaType)
0x00: no area
0x81: I (digital input)
0x82: Q (digital output)
0x83: M (global memory)
0x84: DB (shared DB)
0x85: DI (instance DB)
0x86: L (local data, i.e. the stack)
0x87: V (previous local data, i.e. the caller's stack)
The diagram below summarizes the memory layout of a POINTER type.
Layout of a 6-byte POINTER object in memory – Image (c) Siemens
The JEB native types associated with MC7 pointer types are:
For the 6-byte MC7 pointer type (full structure): the associated JEB native types for such objects are named MC7PTR_xxx
For the 4-byte MC7 address types: the associated JEB native types for such objects are named MC7P_xxx
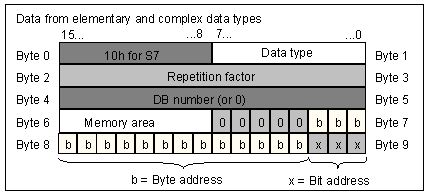
The ANY type, in its common form, is the combination of a pointer with a pointed non-special element type and a repetition count. It allows pointing an area of memory (including memory located in data blocks) with bounds, e.g. 7 DWORDs at memory address 100.0.
It is 10-byte long:
The first 4 bytes contain the pointed data type code and the repetition counter
The remaining 6 bytes are the POINTER bytes
Format of ANY for normal types:
10 CC RR RR, followed by a POINTER (see above)
where:
- C is the data type code (see below)
- R is the repetition count
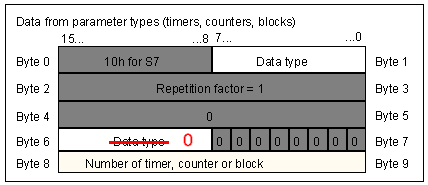
The ANY type is also used to provide or receive “any” data type. It is not just a “pointer with a pointed size”. That means that special types like counters, timers, or block numbers, may be specified as well. In this case, the format of ANY is different:
Format of ANY for special types:
  0x10 CC 00 01 00 00 00 00 NN NN
where:
- CC is the data type code
  0x17 BLOCK_FB
  0x18 BLOCK_FC
  0x19 BLOCK_DB
  0x1A BLOCK_SDB
  0x1C COUNTER
  0x1D TIMER
- NN is the block/timer/counter number
- note that the repetition count is set to be 1
  a single item may be provided by this type format
- note that there is no offset, as they are N/A for the special types
The diagram below is another way to visualize the ANY type layout for special types:
Layout of an ANY data type for special types – Image (c) Siemens
Examples of encodings:
Passing FC9 to an ANY parameter : 10 18 0001 0000 00000009
Passing T2  to an ANY parameter : 10 1D 0001 0000 00000002
Reversing S7 Programs
JEB Pro can be used to reverse one or several PLC blocks making up a full program.
Binary blocks
Internally, Step 7 manipulates PLC blocks as binary blobs whose formats are officially undocumented. At least two formats appear to exist:
Binary blocks used by Step 7 internal primitives, which exist inside the Step 7 program memory.
Binary blocks encoded in network packets, used when uploading or downloading blocks from/to the PLC.
Both formats are supported by JEB (reference: interface IS7Block). Below is their binary specifications. Note the following:
Some parts may be unknown or incorrect (noted ‘?’)
Bytes are 8-bit, words are 16-bit, dwords are 32-bit long.
The s7time type uses 6 bytes and is encoded as follows:
AA AA AA AA BB BB
where:
  B: big-endian WORD, number of days since Jan 1 1984
  A: big-endian DWORD, number of milliseconds in the days
     (range: 0 to 86400000)
example:
  00 00 EA 60 00 01 represents the timestamp Jan 2 1984 00:01:00.000
Format 1 (internal, LE)
The header is 0x4E bytes in length. There is no trailer. Integers are encoded little-endian.
The JEB native type for this type is S7_BLOCK1_HEADER.
offset      type      description
00          word      source language id (see S7.LangType)
02          word      block type id (see S7.BlockType)
04          word      block number
06          word      format and/or version (?)
08          dword     total block size (=0x4E+S1+S2+S3)
0C          dword     S1= payload size in bytes (*)
10          dword     S2= interface size in bytes
14          dword     S3= ? size in bytes
18          word      ?
1A          s7time    last modification of the block
20          s7time    last modification of the interface
26          dword     key
2A          char[8]   author name
32          char[8]   family name
3A          char[8]   block name
42          byte      block version (major.minor)
43          byte      ?
44          word      crc
46          word      ?
48          word      ?
4A          word      ?
4C          word      ?
4E          byte[S1]  payload
4E+S1       byte[S2]  interface
4E+S1+S2    byte[S3]  ?
4E+S1+S2+S3 -
The payload is:
For a logic block: the MC7 code
For a data block: the current (stored) data bytes
Format 2 (network, BE)
Both header and trailers are 0x24 bytes in length. Integers are encoded big-endian.
The equivalent JEB native types are S7_BLOCK2_HEADER and S7_BLOCK2_TRAILER.
offset      type      description
00          word      magic ('pp')
02          byte      source language id (see S7.LangType)
03          byte      block type id (see S7.BlockType)
04          word      block number
08          dword     total block size
0C          dword     key
10          s7time    last modification of the block
16          s7time    last modification of the interface
1C          word      interface size in bytes
1E          word      ? length
20          word      ? length
22          word      payload size in bytes
24          byte[]    payload bytes
24+S1       byte[]    interface bytes
24+S1+S2    -         trailer, see below
The trailer is defined as:
offset      type      description
00          char[8]   author name
08          char[8]   family name
10          char[8]   block name
18          byte      block version (major.minor)
19          byte      ?
1A          word      crc
1C          word      ?
1E          word      ?
20          word      ?
22          word      ?
24          -
Block Acquisition
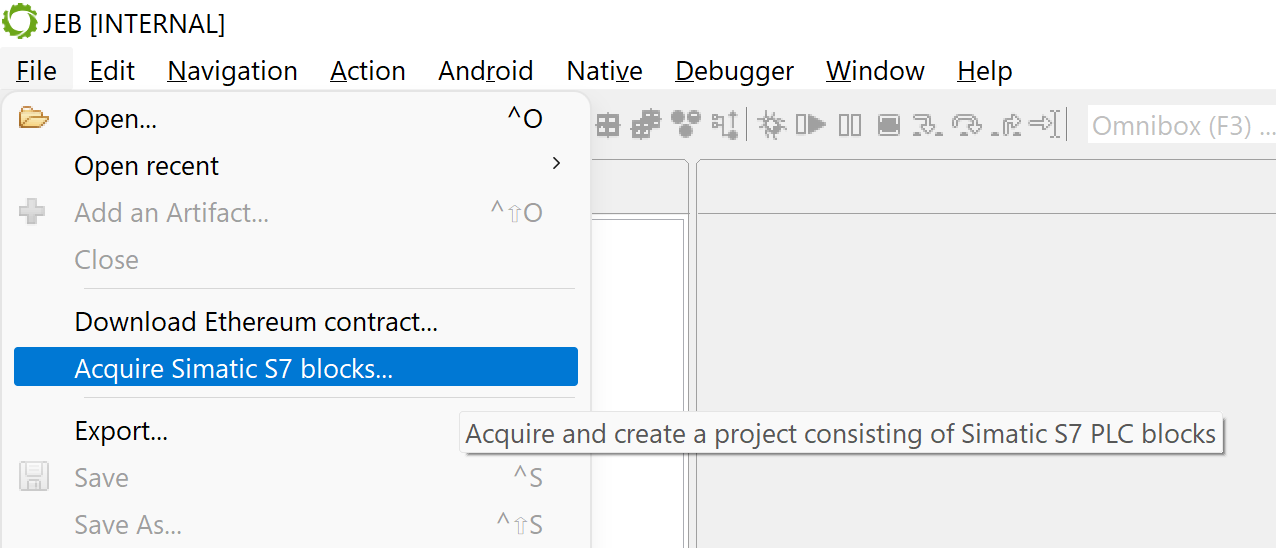
JEB can acquire blocks of type (1), living in the Step 7 editor program memory. Fire up the Step 7 editor, upload blocks in your Step 7 project, then start JEB, open the File menu, Acquire Simatic S7 Blocks handler.
Menu File, Handler Acquire Simatic S7 Blocks
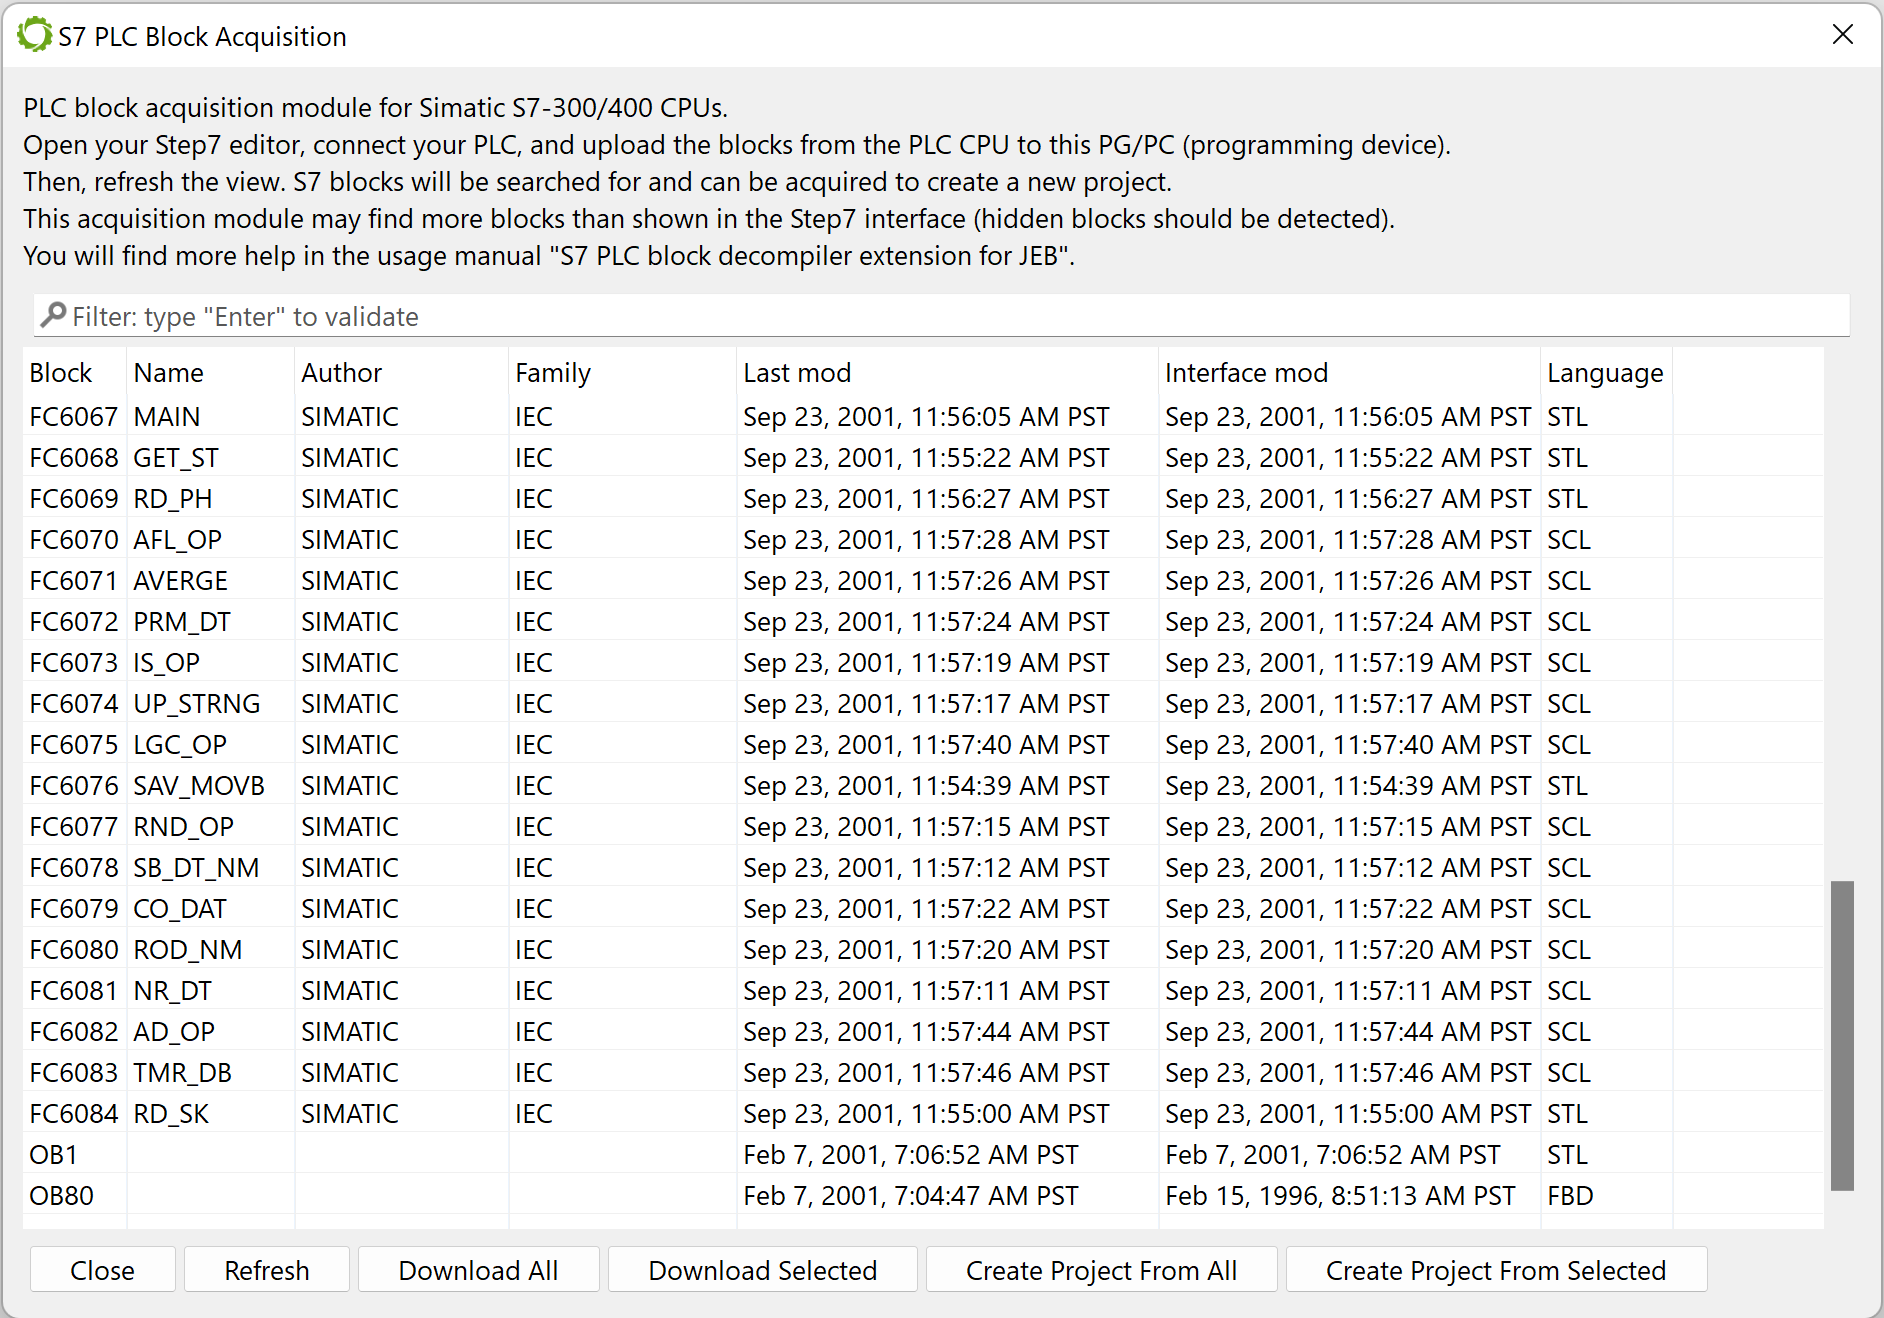
The acquisition widget will show up. It will list binary blocks found in the Step 7 editor memory. You can save some or all of them as binary files or import them directly into a newly-created project.
S7 Block Acquisition widget showing the inspection results of a live instance of Step 7
Of course, PLC blocks may be collected by other third-party means, such as a network sniffer during upload/download, or by a memory scanner.
S7 Analysis Projects
To create a project, either acquire blocks (as described in the above section) or use the File/Open handler in the GUI client to load up a block or archive of blocks:
A single block file should have the .s7blk extension in order to be treated by JEB as a S7 PLC block.
A collection of blocks (the most likely scenario) should be placed in a zip archive having a .s7zip extension. All blocks inside the archive will be treated by the plugin.
IMPORTANT: To decompile a collection of blocks, zip them in an archive and rename it with “.s7zip” extension.
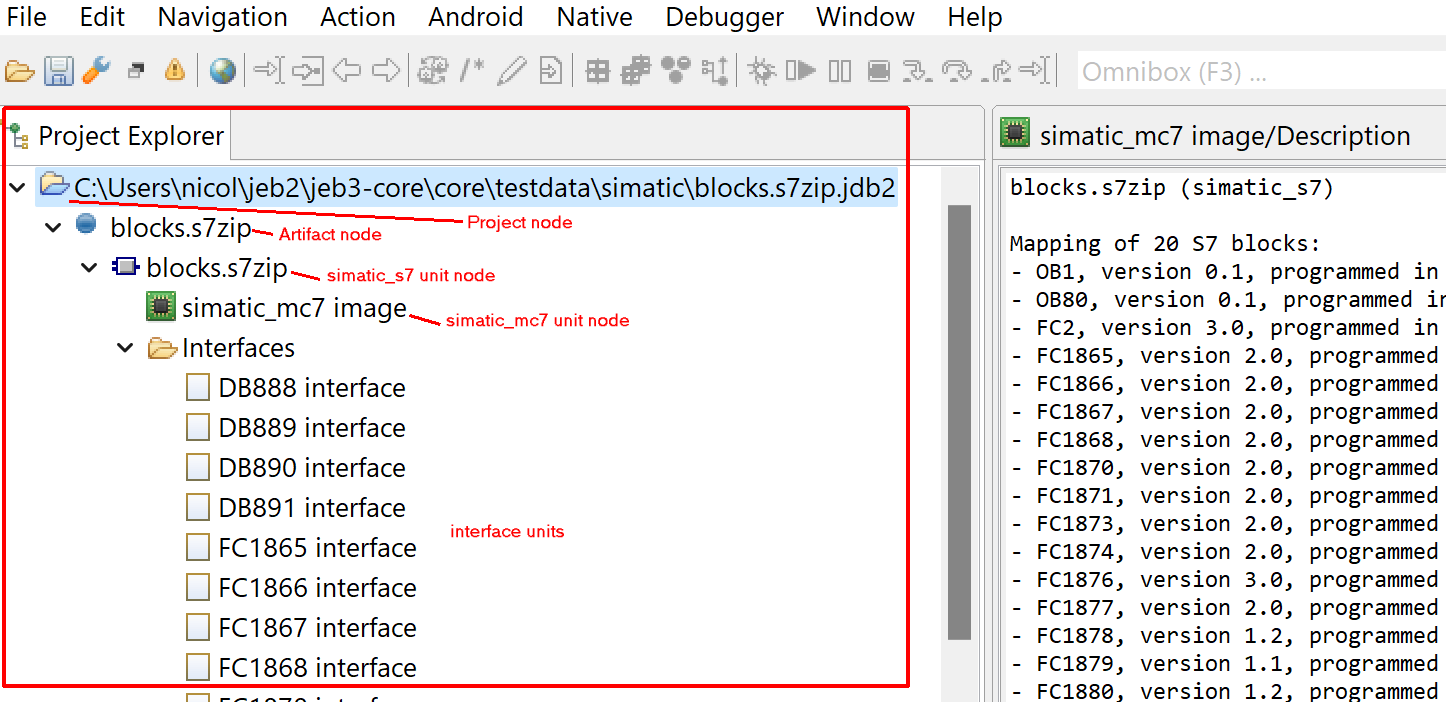
In this example, an archive (blocks.s7zip) containing 20 blocks was loaded into JEB.
A new project will display the following minimal node hierarchy:
The project node (top node)
The artifact node representing the input file (in the above example, blocks.s7zip)
The simatic_s7 container unit node (under the artifact), representing the virtual container for all blocks
The simatic_mc7code unit node (under the container unit node), representing a machine-like view of the code and data, mapped in a unified virtual memory segment
Other unit nodes may be present, such as:
Interface definition text unit nodes for all blocks
A decompiler unit node under the simatic_mc7 image unit
Container Unit
The container unit, of type simatic_s7, holds the blocks, parses them and decides where their code and data will be mapped in the child unit of type simatic_mc7. Note that this way of processing blocks is not related to how blocks are processed by a PLC. It is simply the plugin’s way to organize the blocks into an entity that fits within JEB’s public interfaces and representation models of plugins adhering to the native code analysis framework.
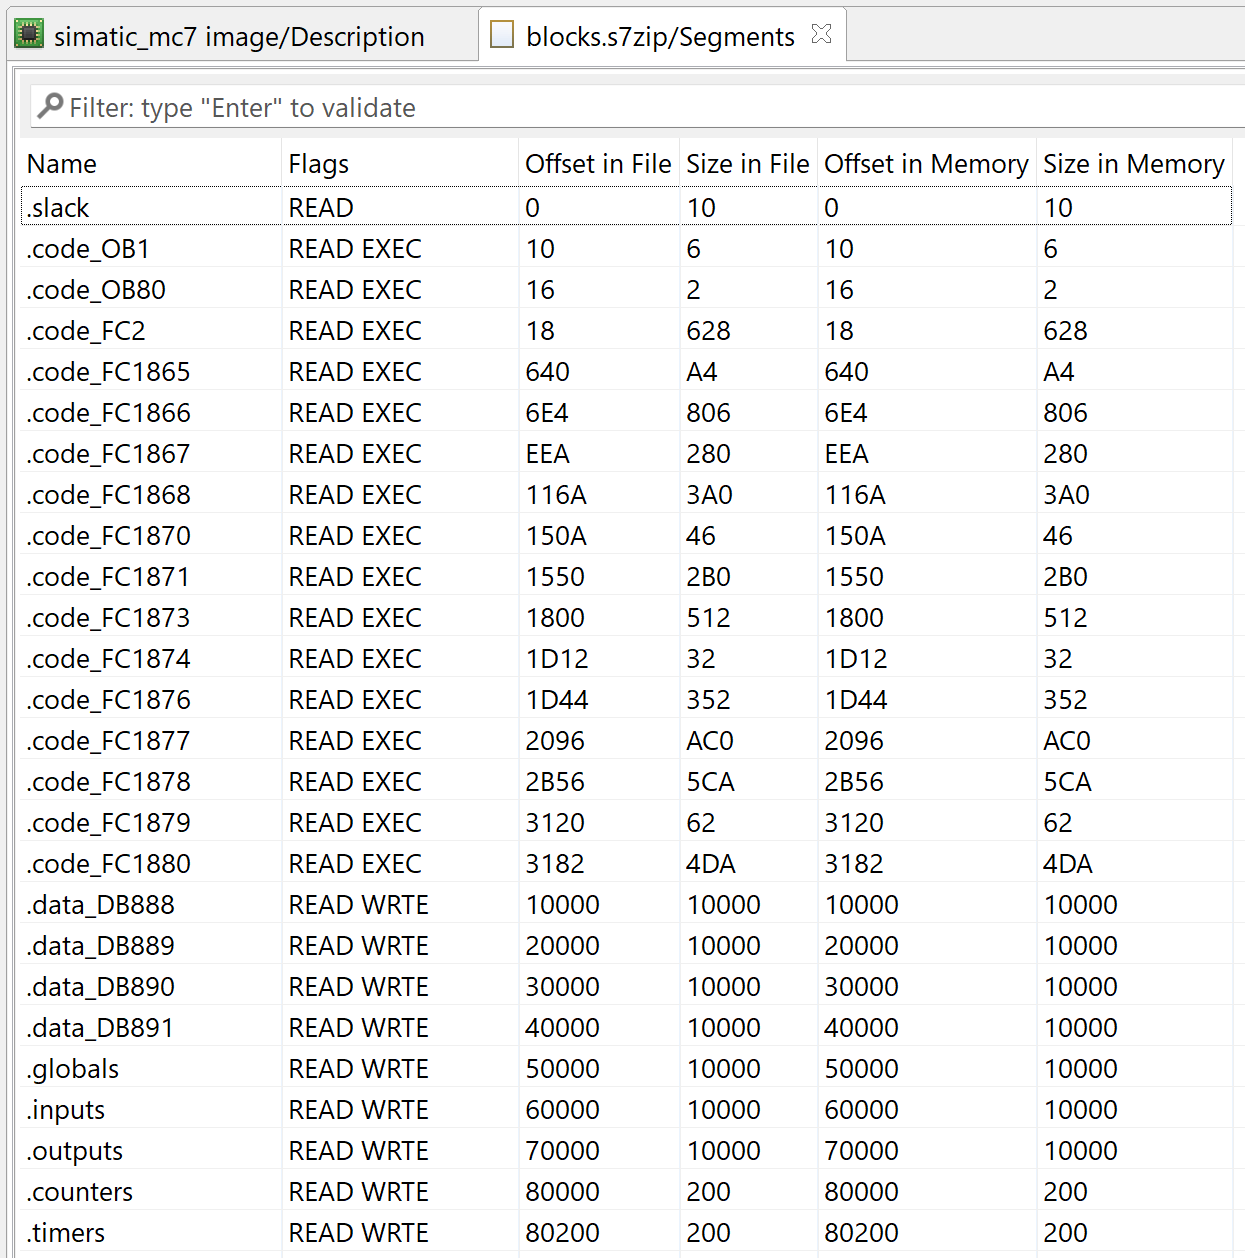
The Segments view of a simatic_s7 unit, showing how block bytes will be mapped in a virtual memory object
As can be seen in the “Segments” view of the container unit:
The MC7 bytecode of code blocks (OB, FC, FB) are mapped in individual segments named .code_<BlockName> (where <BlockName> consists of the block type appended with the block number, e.g. DB1000, FC1100, OB85)
The payload bytes of data blocks (DB) are mapped in individual segments named .data_<BlockName>
The memory areas I, Q, G, C, and T are also mapped as separate segments, respectively named .globals, .inputs, .outputs, .counters, .timers
Optional segments .blk_<BlockName> holding the raw bytes of of PLC blocks may be created for informational purposes, but this option is disabled by default.
The base address used for mapping is 0x100000 (=BASE). In most cases, the MC7 codes will be found at address BASE+0x10. The data blocks will be mapped at BASE+0x10000, BASE+0x20000, etc. since a data block contains at most 65536 bytes of addressable bytes. Other segments (for M, I, Q, C, T areas) are also 0x1000-aligned and mapped after the data blocks.
Image Unit
The image unit, whose default name is “simatic_mc7 image”, owns a virtual memory object mapping the various segments described in the previous section. Those segments represent different parts of blocks (MC7 bytecode, data block bytes, memory areas, etc.).
Each segment is prefixed with block metadata information for convenience (names, timestamps, versions, etc.). Keep in my mind that most of this information is purely informative and should not be taken as-is: An attacker may manually edit block headers and change, for example, authorship information or timestamps.
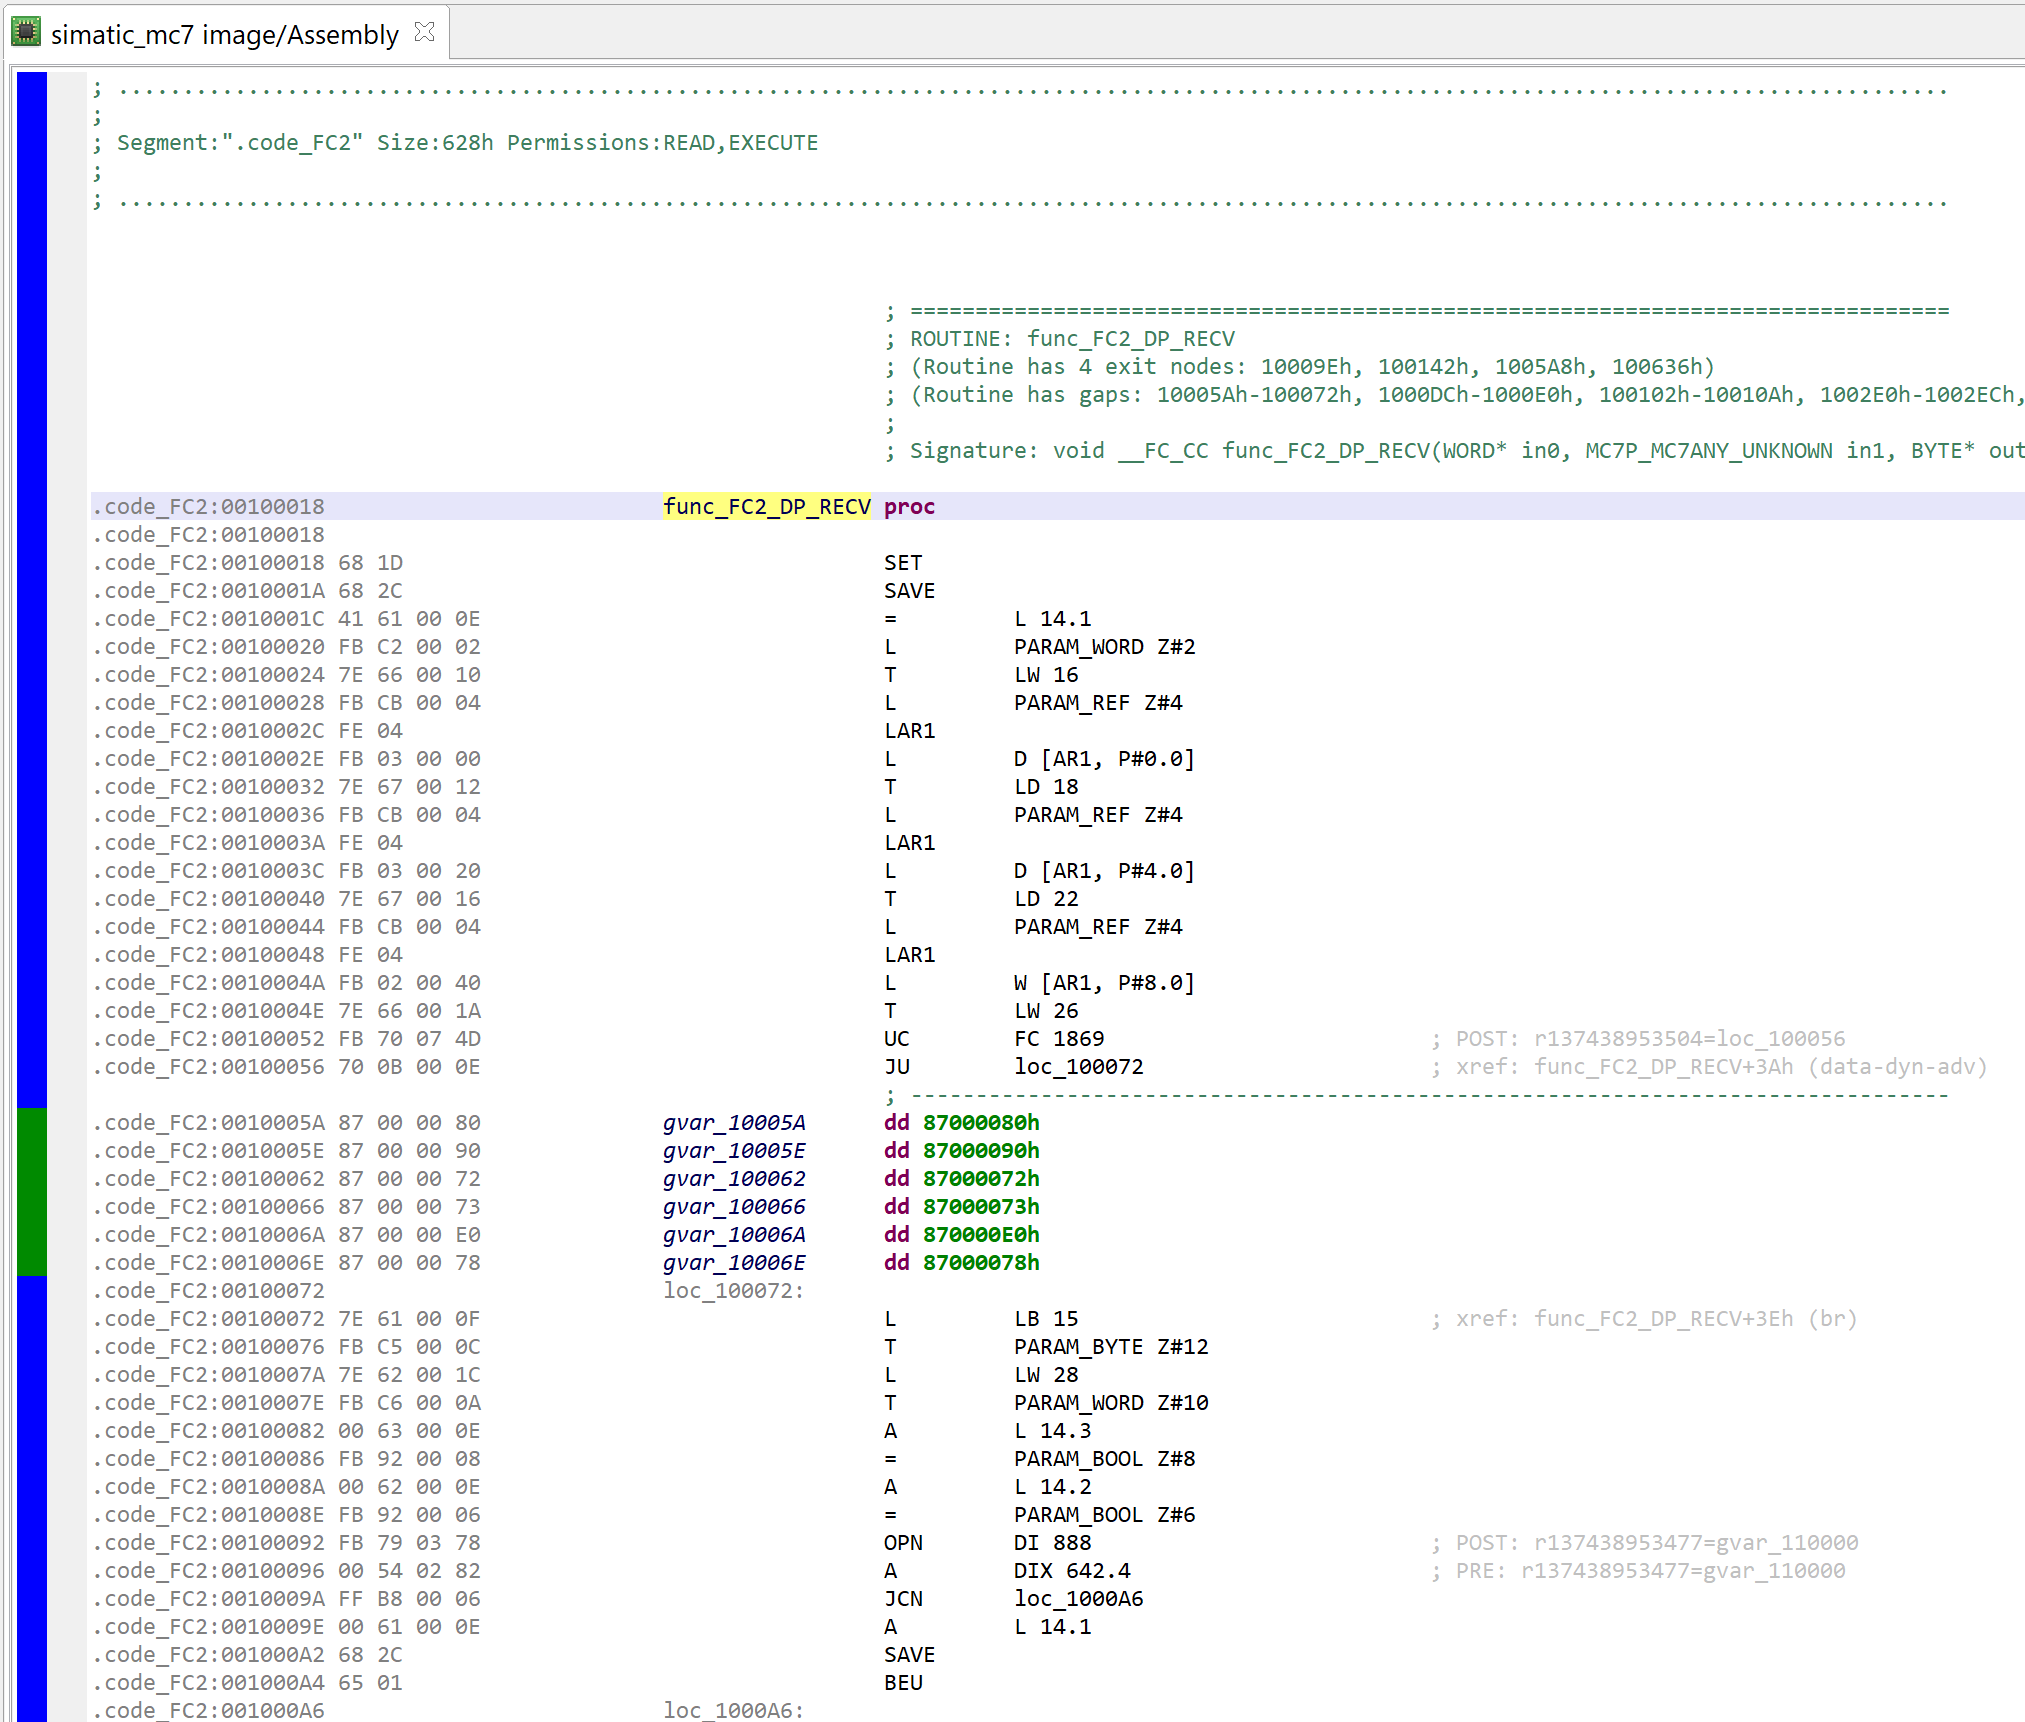
In the example below, we can look at the MC7 code of FC2, who was mapped in a segment “.code_FC2”. Most of the code is standard STL code. Some instructions and idioms are not (e.g. UC FC, param-access instructions), they will be mentioned later.
Disassembled MC7 bytecode of a Function Block
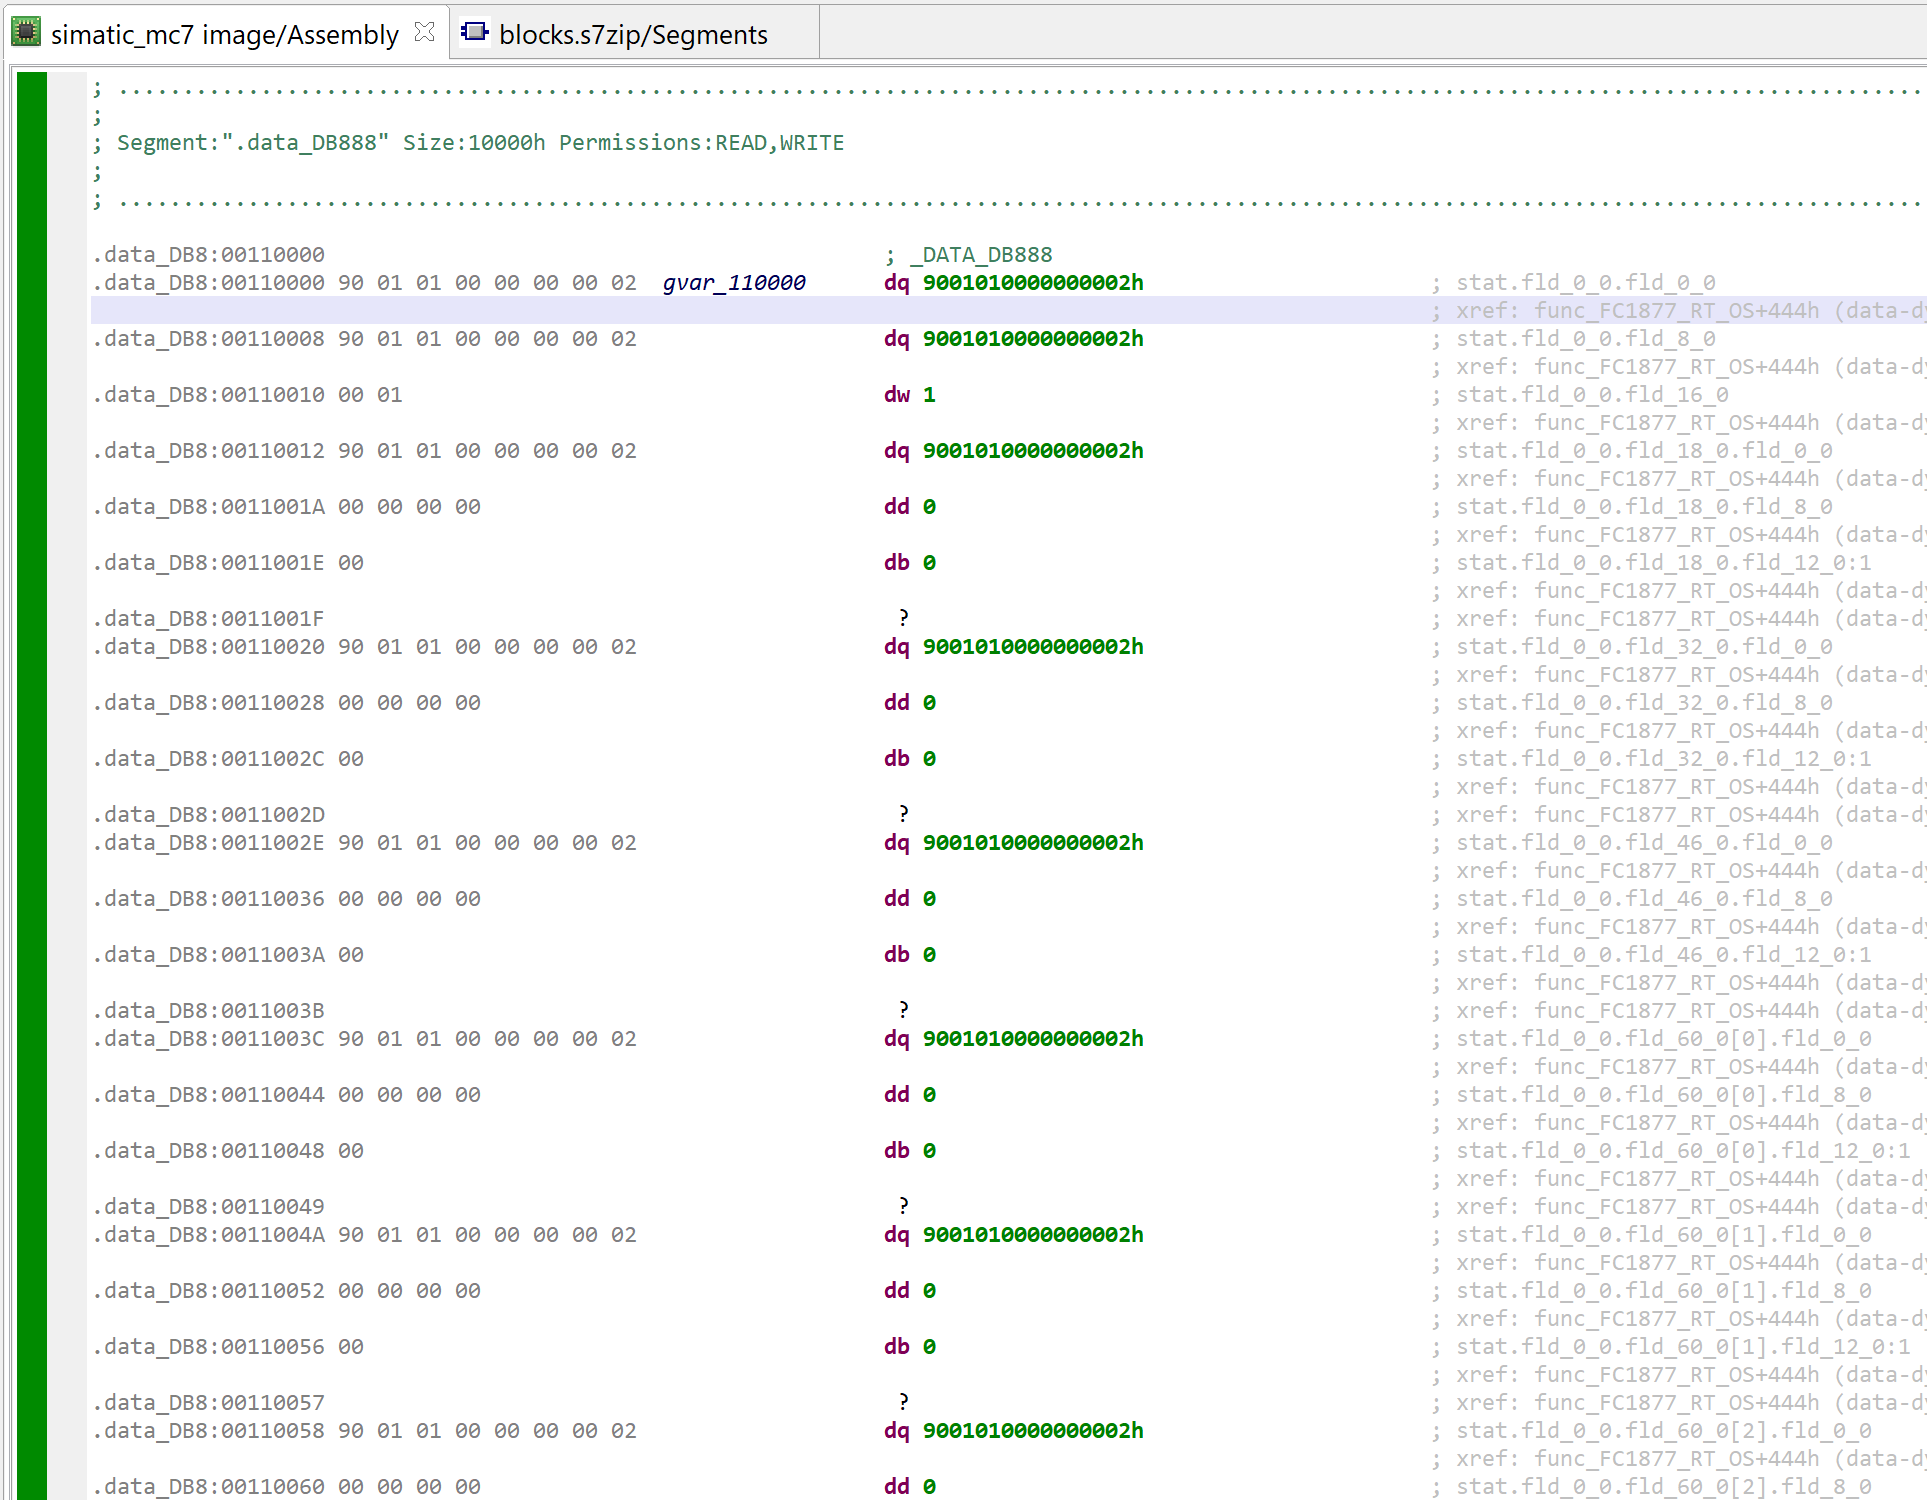
The unified virtual memory also holds data block bytes. Below, one can see that DB888 was mapped at virtual address 0x10000 by the analyzer.
Data bytes of DB888
Parsing Options
When creating a new project, parsing options will be presented to the user.
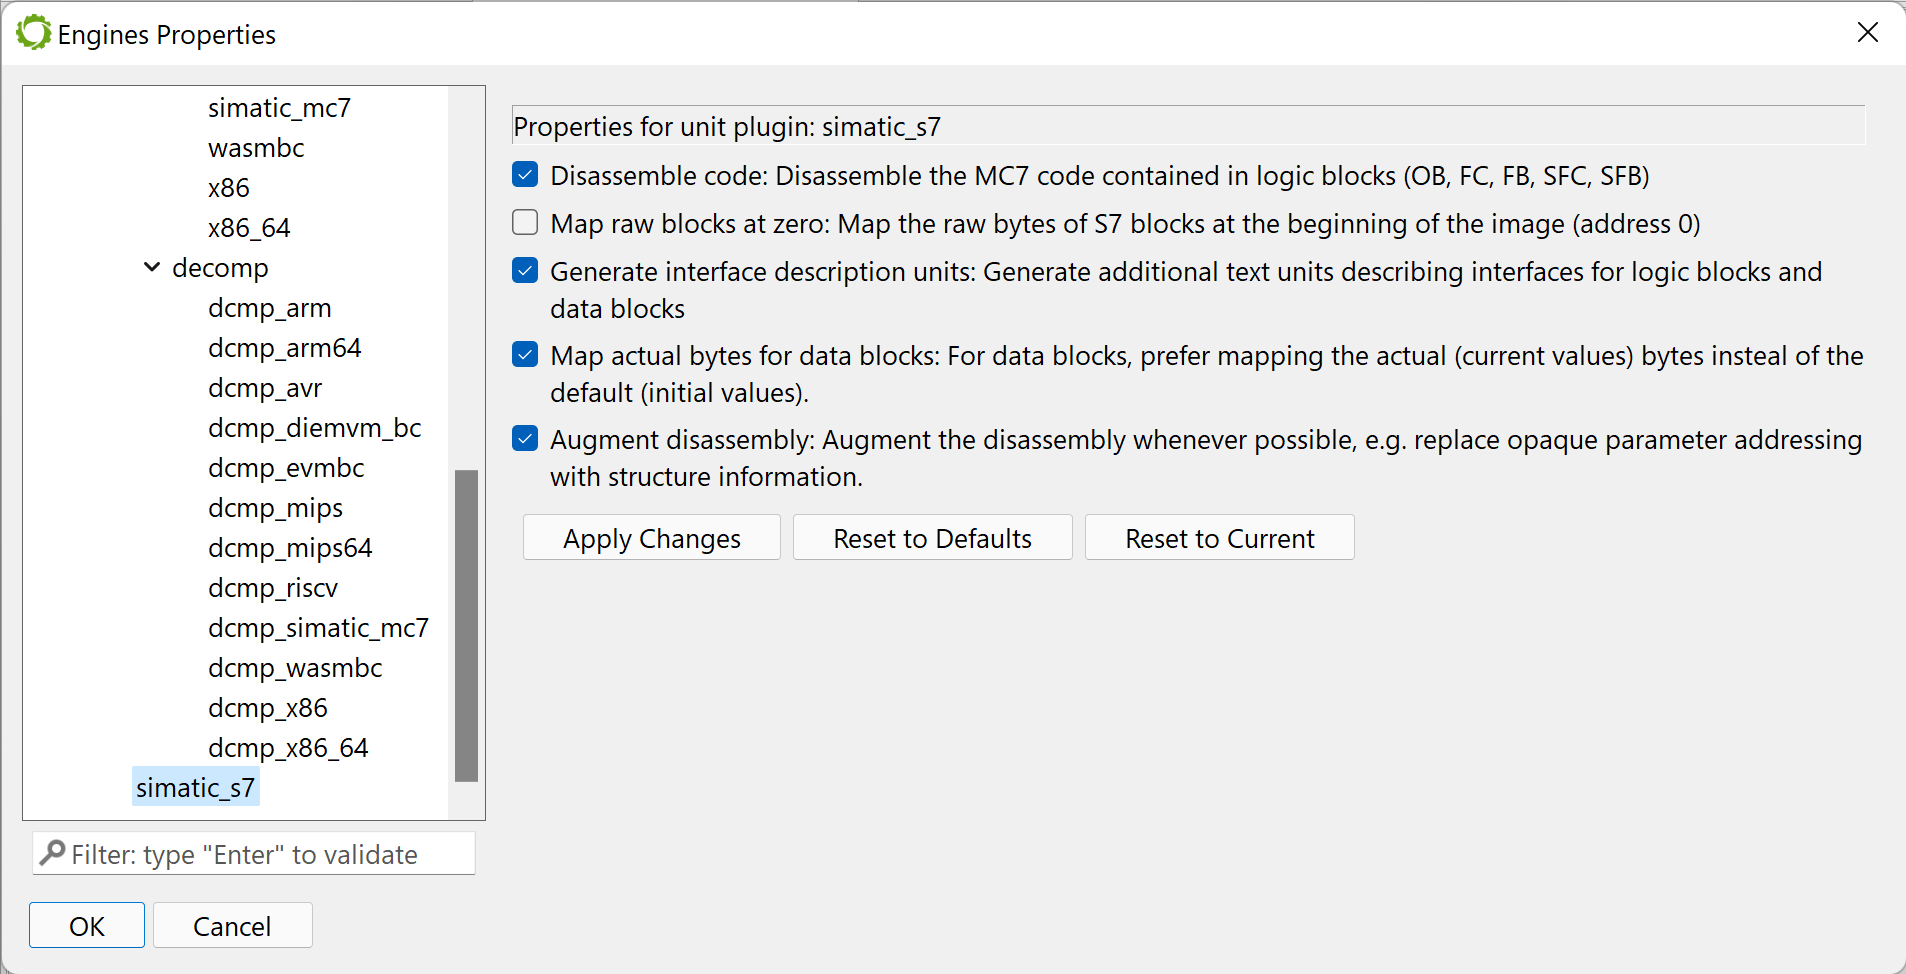
S7 plugin parser options.
The currently available options are:
DisassembleCode: true to disassemble the code. Keep this option on unless code examination or decompilation is not necessary.
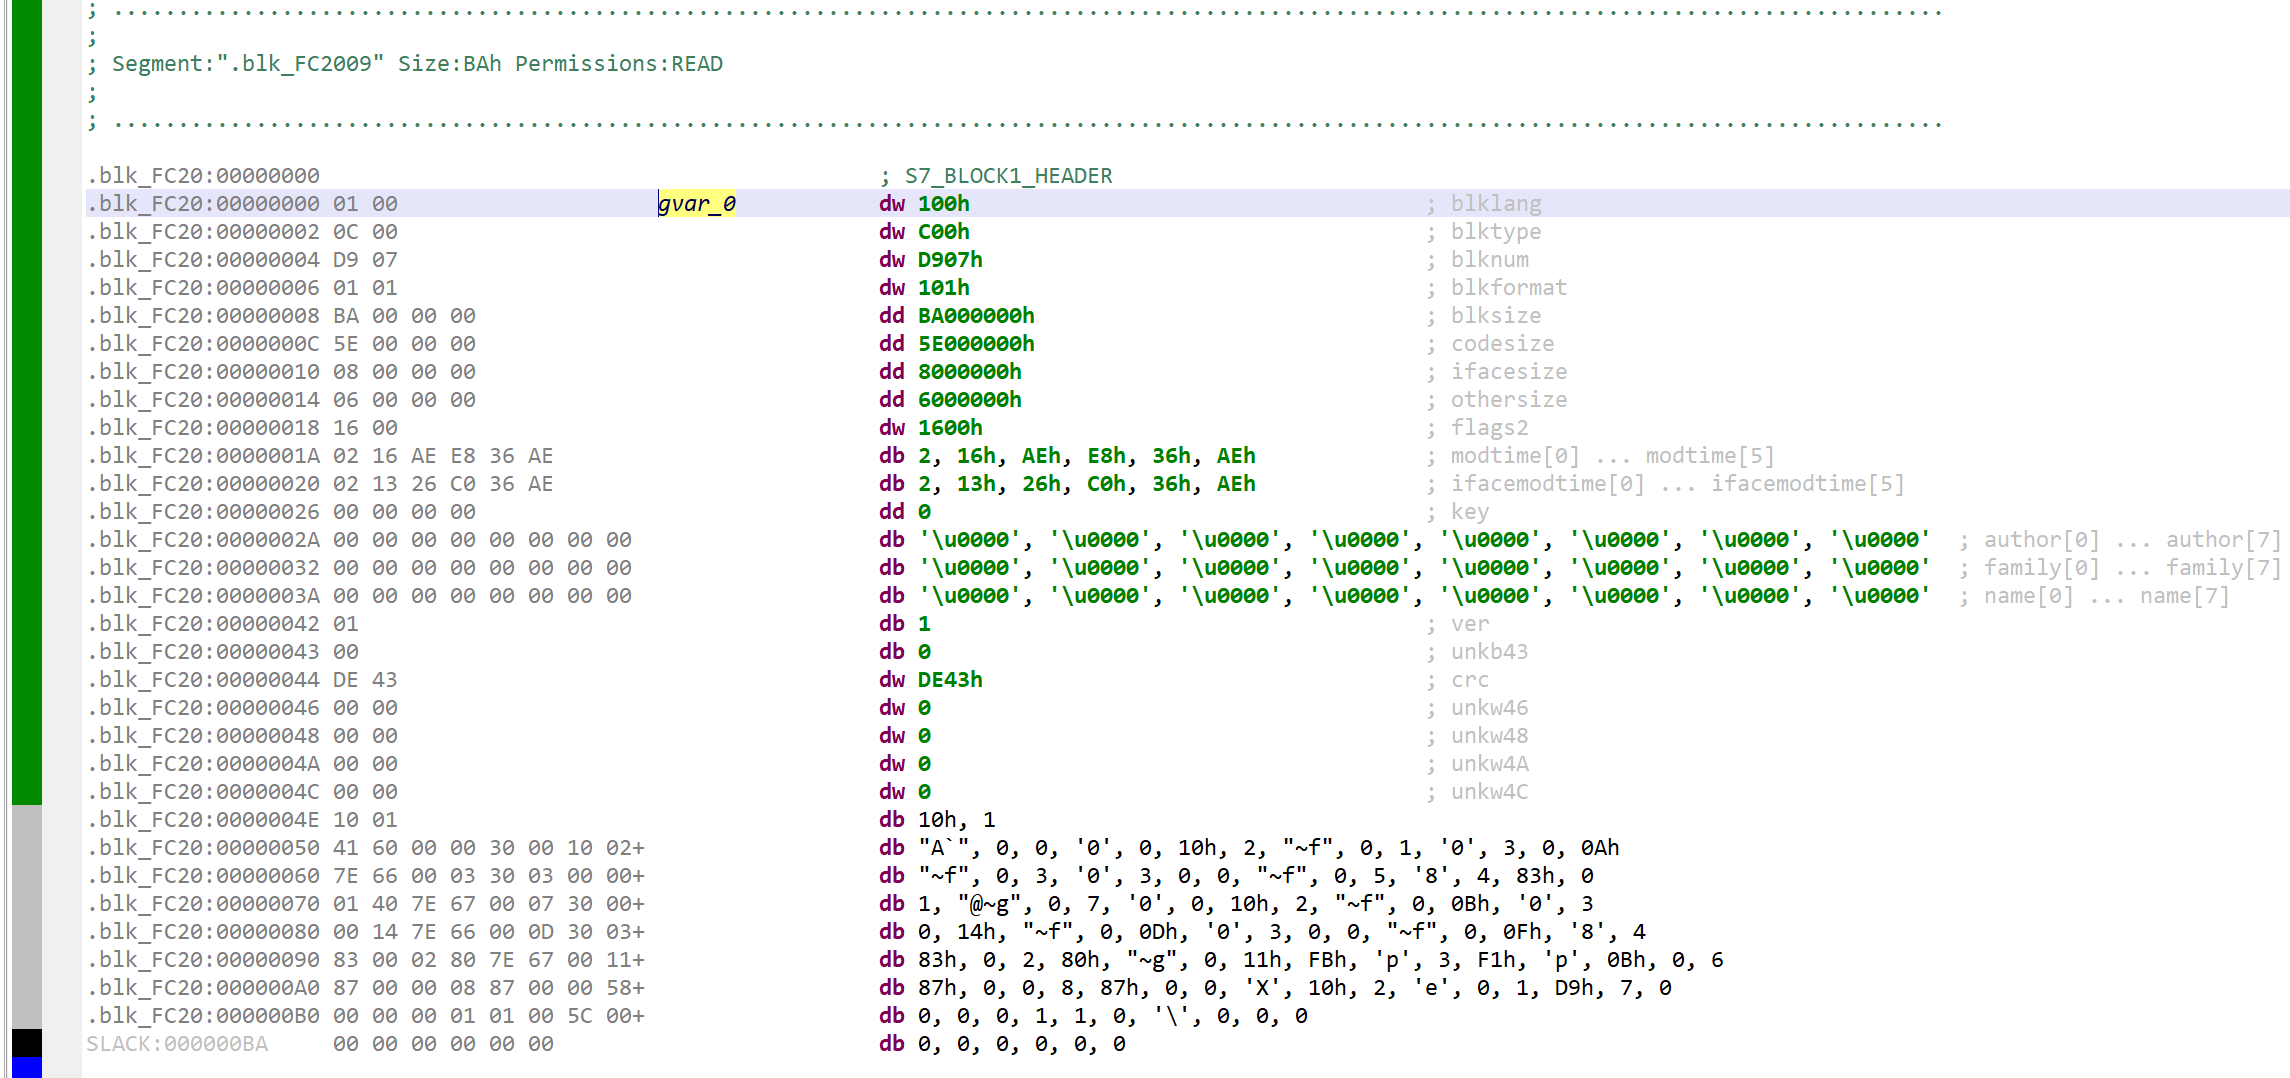
MapRawBlocksAtZero: true to map the raw bytes of blocks before mapping their payload (code or data). It may be useful to examine very specific bits not rendered as metadata in the various description strings present throughout the disassembly
A FC block (binary format 1, internal) whose raw bytes were mapped at address 0 in a segment “.blk_FC20”. Note that a type S7_BLOCK1_HEADER was applied to the data.
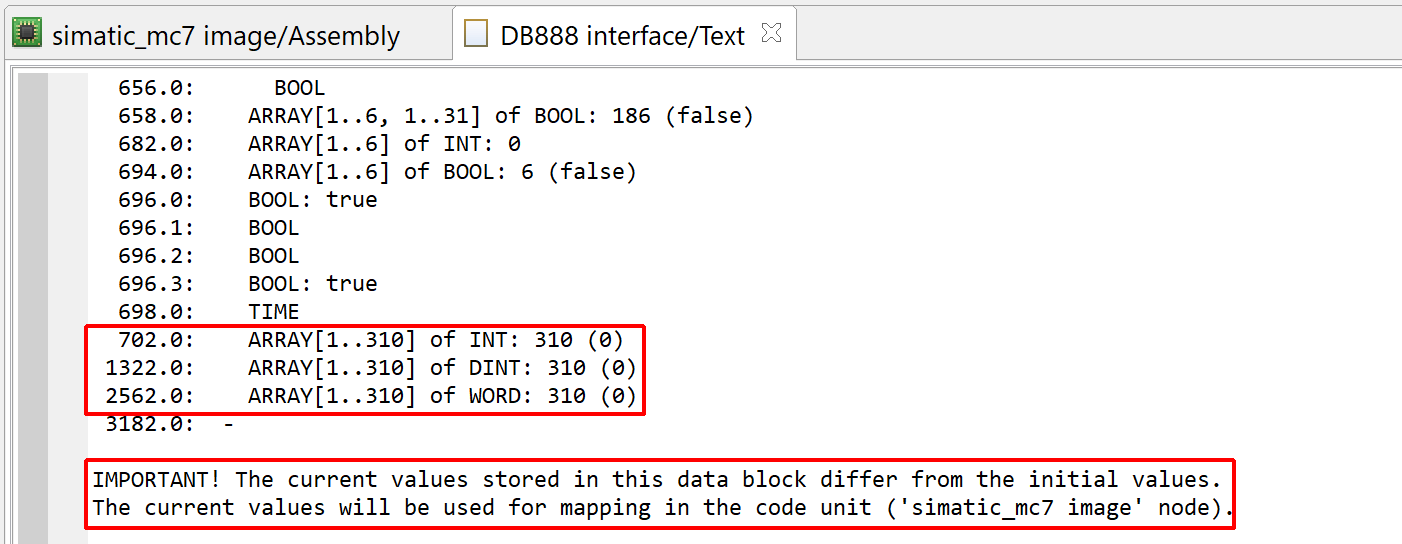
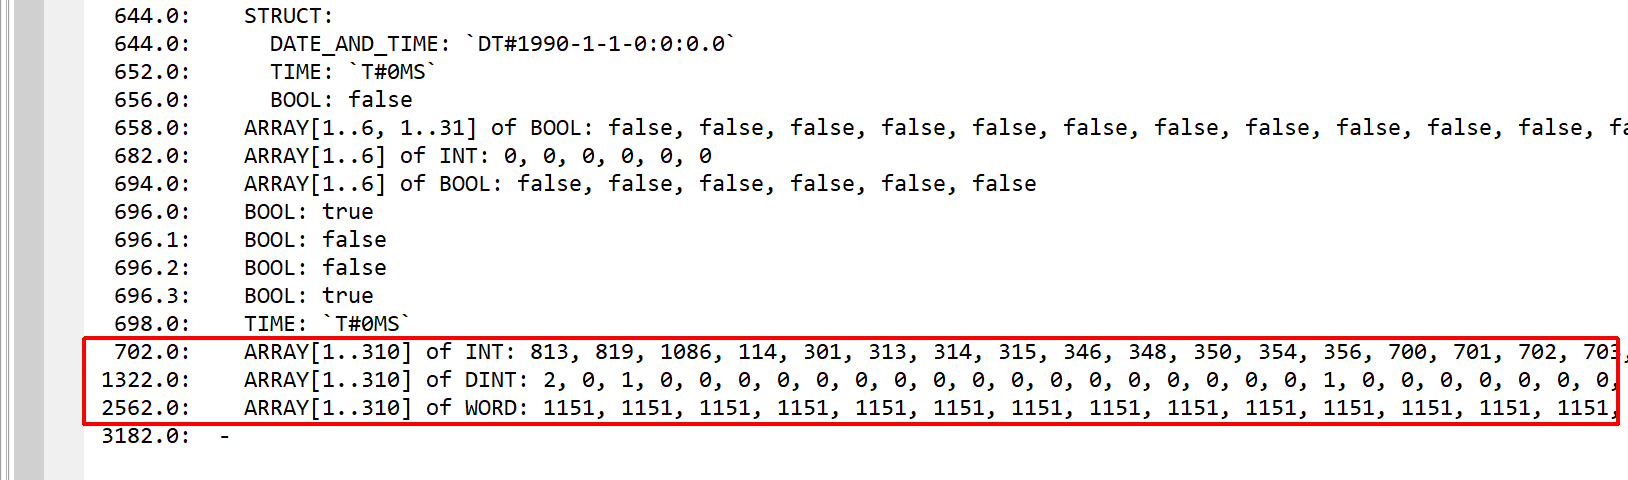
GenerateInterfaceDescriptionUnits: true to generate interface definition text units, false otherwise. The interface units are very useful to have a global look at the various fields that make up an interface, as well as (for data blocks), the default values and current values of those fields.
Example for a data block (DB 888):
1/2 – Part of the definition of DB 888. A notification indicates that the current bytes in the block differ from the default values. (See below)2/2 – The actual values for the arrays at offsets 702, 1322, 2562.
MapActualBytesForDataBlocks: true to use the current (actual) bytes of a data block when mapping the block to VM, false to use the default values.
Actions and Navigations
Readers are encouraged to go through the JEB Manual6 pages related to Actions and Views to learn more about how to interact with the disassembly. Of particular interest, we recommend reviewing:
Cross-references and navigating references
Commenting, bookmarking
Renaming items, such as routines, labels
Viewing and creating types and prototypes
Checking calling conventions and processor registers for reference
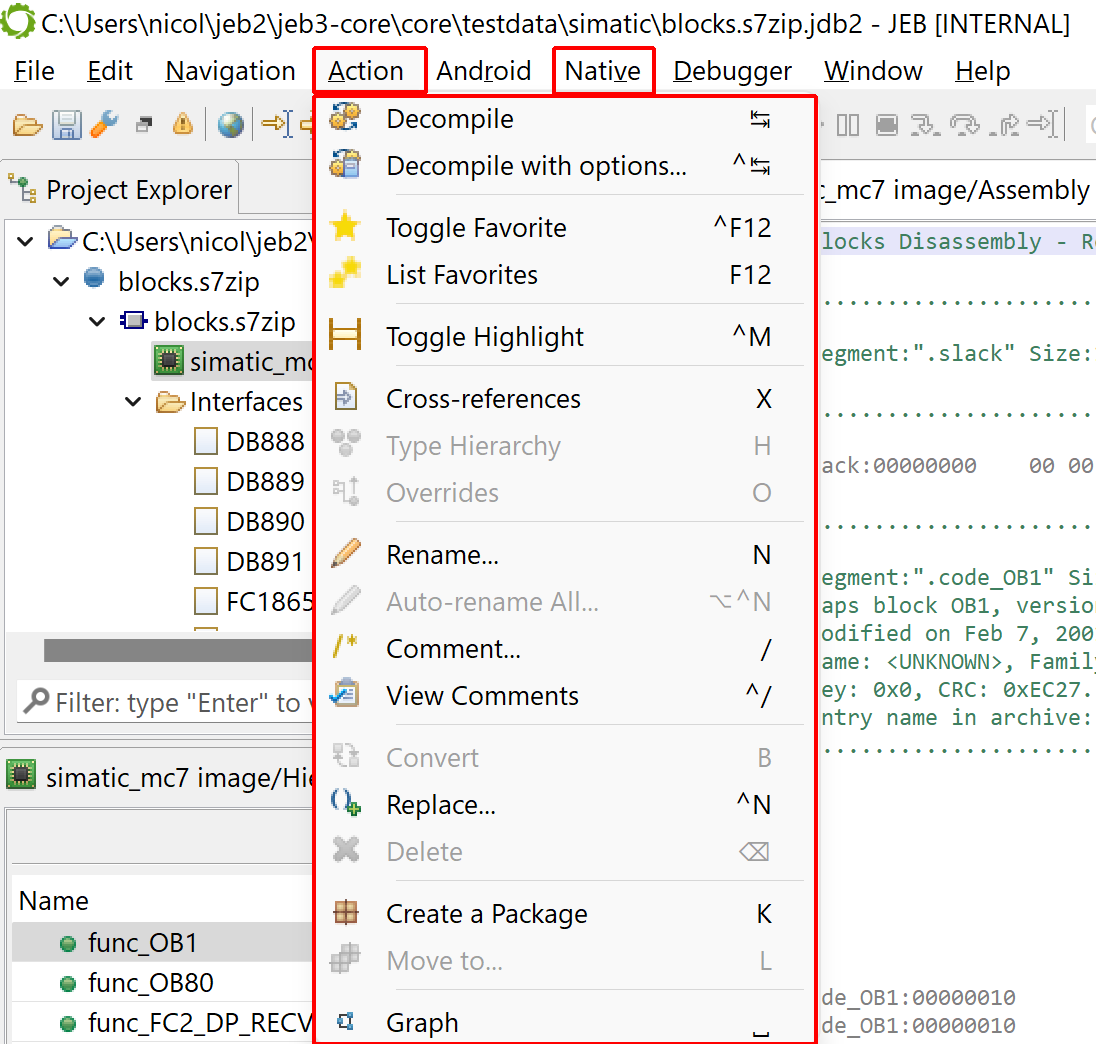
Most actions offered by the GUI client are located in the Action and Native menu.
Most actions offered by the GUI client are located in the Action and Native menu.
MC7 Binary Interfaces
Processor internals
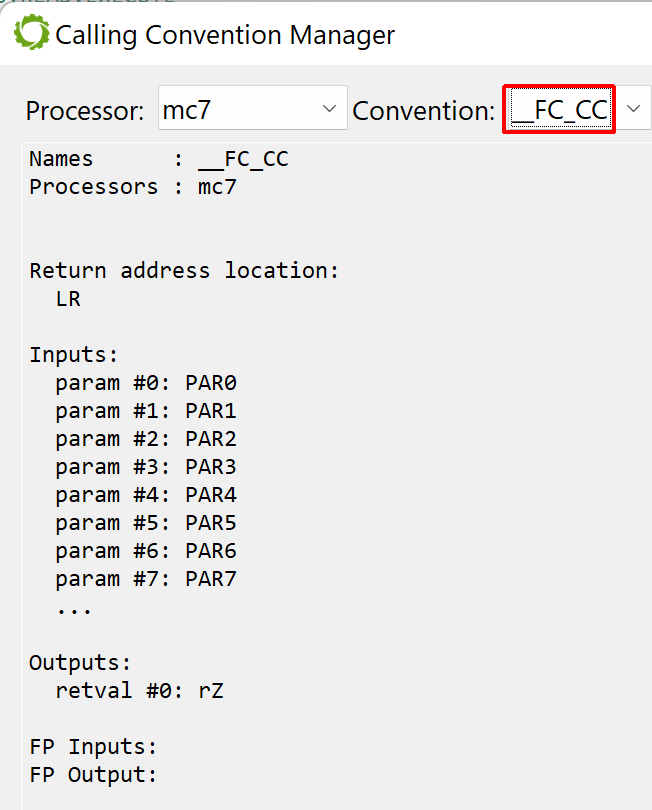
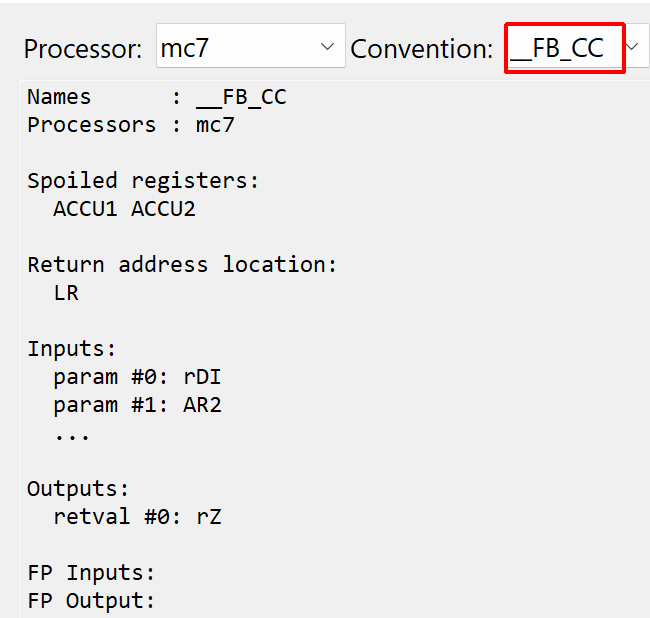
The S7 plugin uses two custom calling conventions:
__FC_CC for FC/SFC/OB blocks
__FB_CC for FB/SFB blocks
You may see their details by opening the Calling Convention Manager widget (in the Native menu)
Widget showing a custom calling conventions used by the S7 plugin, __FC_CCAnother custom calling conventions used by the S7 plugin, __FB_CC
To understand why two conventions area required to represent calls to sub-routines, we need to detail how sub-routine calls are implemented in MC7.
FC calls
The order of parameter indexing is important: IN, RET, OUT, IN_OUT.
Let’s assume FC 1001 with the following interface:
Note that this interface uses only primitives and does not have OUT or IN_OUT parameters.
In STL such an FC would be called, for example, like that:
  L     3000
  T     #tmp
  CALL  FC  1001
   IN0    :=#tmp              // symbolic ref to a variable on the stack
   IN1    :=DW#16#10002000    // literal immediate
   RET_VAL:=MD100             // address in memory for a return value
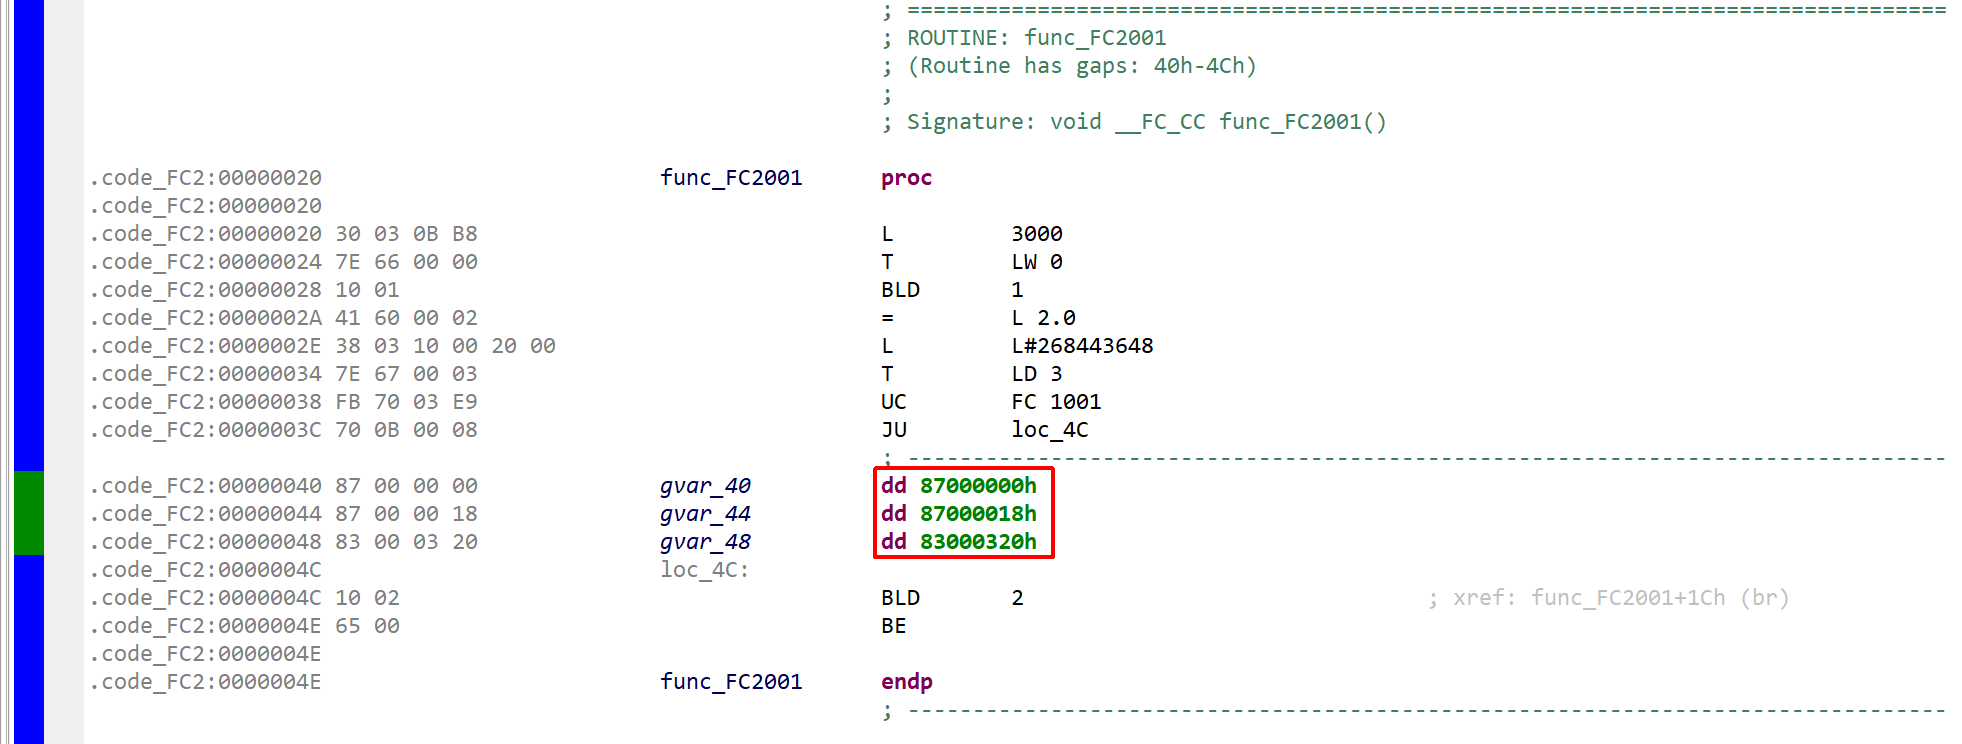
Which a compiler may translate to this piece of MC7 code:
FC 2001, calling FC 1001
Note the following:
The “call” was translated to a UC (unconditional call) and JU (unconditional jump)
The parameters are provided by reference, as raw DWORDs, just after the JU. The references are 4-byte MC7 addresses, whose structure was detailed in the previous section.
Reminder: MC7 address (4-byte): AAAAAAAA 00000XXX XXXXXXXX XXXXXBBB where A is the area code, X the offset in bytes, B the bit position (0-7)
The area codes are as follows: (S7.AreaType)
I (digital input): 0x81
Q (digital output): 0x82
M (global memory): 0x83
DB (shared DB): 0x84
DI (instance DB): 0x85
L (local data, i.e. the stack): 0x86
V (previous local data, i.e. the caller’s stack): 0x87
With this laid out…
0x87000000 can be translated as P#V 0.0, that is a reference to the first bytes/bits of the caller stack (the parameters are to be interpreted from the callee’s perspective). Indeed, the caller’s stack at 0 contains word 3000 (L 3000 / T LW 0).
0x83000320 can be translated as P#M 100.0 (0x320=800), which matches what was assigned for RET_VAL in the original STL snippet.
Because of how the MC7 VM deals with locals, it is simpler for JEB to not treat those parameters as stack parameters. Instead, they are assigned to individual synthetic registers named PAR0, PAR1, PAR2, PARn (limited to 16 entries). Those registers can be seen in the calling convention definition for FC/SFC/OB, namely “__FC_CC”.
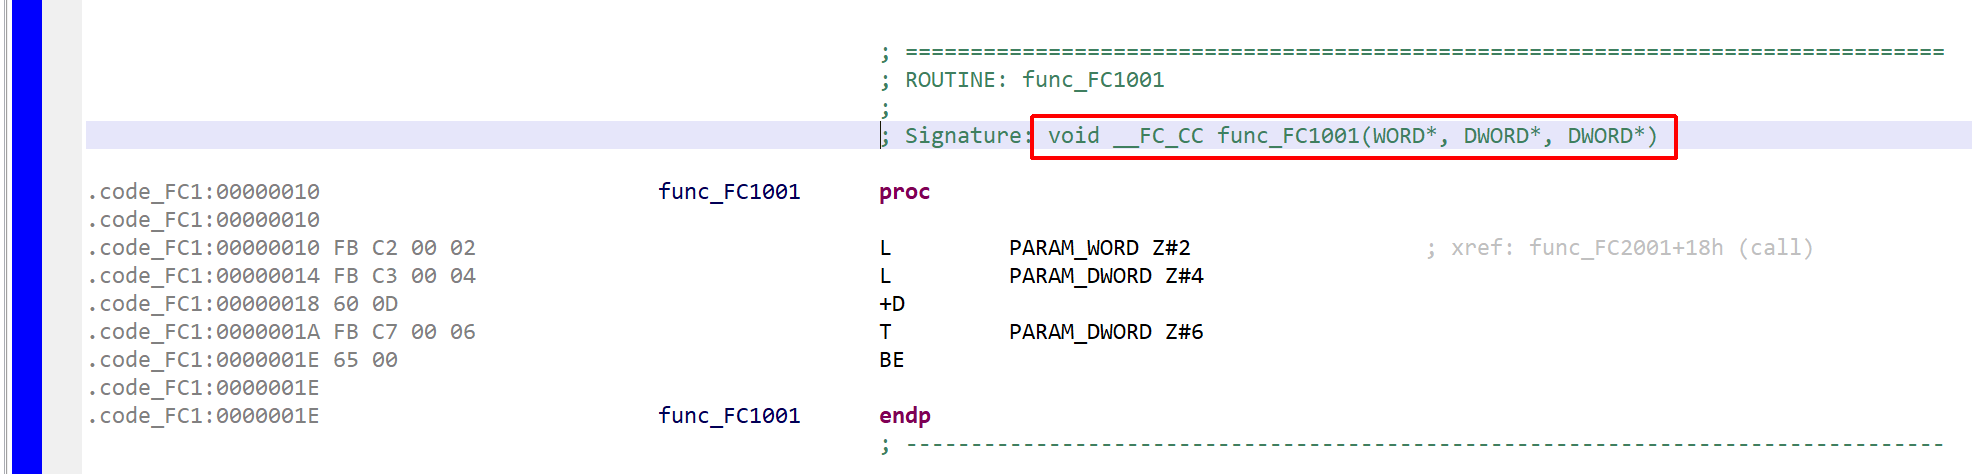
Let’s look at the code for FC 1001:
  L     #IN0
  L     #IN1
  +D
  T     #RET_VAL
Which was compiled to:
MC7 code of routine FC 1001 (the callee)
First, note the signature and prototype assigned by JEB:
void __FC_CC func_FC1001(WORD*, DWORD*, DWORD*)
As said above, in this example, parameters were provided by reference. The order follows the interface definition’s: the first parameter matches the first IN; the second parameter matches the second IN; the last parameter matches RET_VAL
What about other parameter types? Are all of them provided by reference? The answer is no. Some parameters are provided by value (obviously, they must be IN parameters as well). Others are provided by references to pointers or references to any variables.
Primitives (BOOL, BYTE, CHAR, WORD, INT, DWORD, DINT, REAL, DATE, TIME_OF_DAY, TIME, S5TIME) are provided by reference, i.e. a 4-byte MC7 address.
The special types TIMER, COUNTER, BLOCK_FB, BLOCK_FC, BLOCK_DB, BLOCK_SDB (16-bit, IN only) are provided by value (16-bit, zero-padded to fit a 32-bit slot).
The complex types DATE_AND_TIME (8 bytes), STRING (up to 256 bytes), ARRAY and STRUCT are provided by reference to a pointer referencing the actual data. (Special types are generated, more on this below.)
POINTER (10 bytes) parameters are provided by reference (to the pointer parameter).
ANY (10 bytes) parameters are provided by reference (to the any parameter).
OB Prototypes
Note that OB blocks are always assigned the following prototype:
void __FC_CC func_OBx()
FB calls
FB (Function Blocks) mode of invocation is different. A DB is provided along with the call. The DB (referred to as the FB’s DI – that is, instance Data Block – in this context) will contain the call parameters (IN, OUT, IN_OUT), along with the rest of the block’s static data (referred to as STATIC).
The order is important: IN, OUT, IN_OUT, STATIC.
Let’s assume FB 1001 to have the following interface header (TEMP omitted):
IN:
  0.0: WORD x
  2.0: WORD y
OUT:
  4.0: WORD res
IN_OUT:
  6.0: WORD seed
STAT:
  8.0: DWORD
 12.0: BOOL
It is expected that the DB provided during a call have the same or a compatible interface. In this example, we will pass DB 1001.
In STL, the FB would be called like this:
CALL  FB  1001 , DB1001
   x     :=W#16#7
   y     :=W#16#8
   result:=MW10
   iv    :=MW14
The parameters will be copied into the provided block’s (DB 1001) actual slots. Compilation of this code:
.code_FB1:00000046              func_FB1003      proc
.code_FB1:00000046
.code_FB1:00000046 10 03                         BLD       3
.code_FB1:00000048 41 60 00 04                   =         L 4.0
.code_FB1:0000004C FB 7C                         CDB                  ;1
.code_FB1:0000004E FB 79 03 E9                   OPN       DI 1001    ;2
.code_FB1:00000052 FE 6F 00 00                   TAR2      LD 0       ;3
.code_FB1:00000056 30 03 00 07                   L         7          ;4
.code_FB1:0000005A 7E 56 00 00                   T         DIW 0      ;...
.code_FB1:0000005E 30 03 00 08                   L         8
.code_FB1:00000062 7E 56 00 02                   T         DIW 2
.code_FB1:00000066 12 0E                         L         MW 14
.code_FB1:00000068 7E 56 00 06                   T         DIW 6
.code_FB1:0000006C FE 0B 84 00+                  LAR2      P#DBX 0.0  ;5
.code_FB1:00000072 FB 72 03 E9                   UC        FB 1001    ;6
.code_FB1:00000076 FE 6B 00 00                   LAR2      LD 0       ;7
.code_FB1:0000007A 7E 52 00 04                   L         DIW 4      ;8
.code_FB1:0000007E 13 0A                         T         MW 10      ;...
.code_FB1:00000080 7E 52 00 06                   L         DIW 6
.code_FB1:00000084 13 0E                         T         MW 14
.code_FB1:00000086 FB 7C                         CDB                  ;9
.code_FB1:00000088 10 04                         BLD       4
.code_FB1:0000008A 65 00                         BE
.code_FB1:0000008A
.code_FB1:0000008A              func_FB1003      endp
Notes:
The current DI (since the caller is itself an FB) is saved by being transferred to DB
The to-be instance data block is opened
AR2 is copied to LD0
IN and IN_OUT parameters are copied to the instance DB
AR2 is to offset 0 (N/A here, useful in the case of multi-instance data blocks; note that the attentive reader may have noticed that the pointer is loaded with an area DB! Why not DI? Well, the area will be disregarded by the client code in the callee routine, only the offset part of the pointer is used. )
The call is translated to UC
The caller’s AR2 is restored
IN_OUT and OUT parameters are read and transferred to their final destination
The DI that was in-use before the call is restored
Unlike an FC call, the parameters are located in the instance data block. The transfer does not involve the local stack.
The prototype of FB methods uses the __FB_CC convention:
void __FB_CC func_FB1003(_DATA_FB1003*, DWORD)
They use two parameters:
The first one is a pointer to the associated data block type. It is stored inside the register rDI.
The second one is an offset inside this data block. For single-instance data block (common case), that offset, held in the register AR2, is 0. For multi-instance data blocks, it may differ. Note that the decompiler plugin does not support multi-instance data blocks at the time of writing.
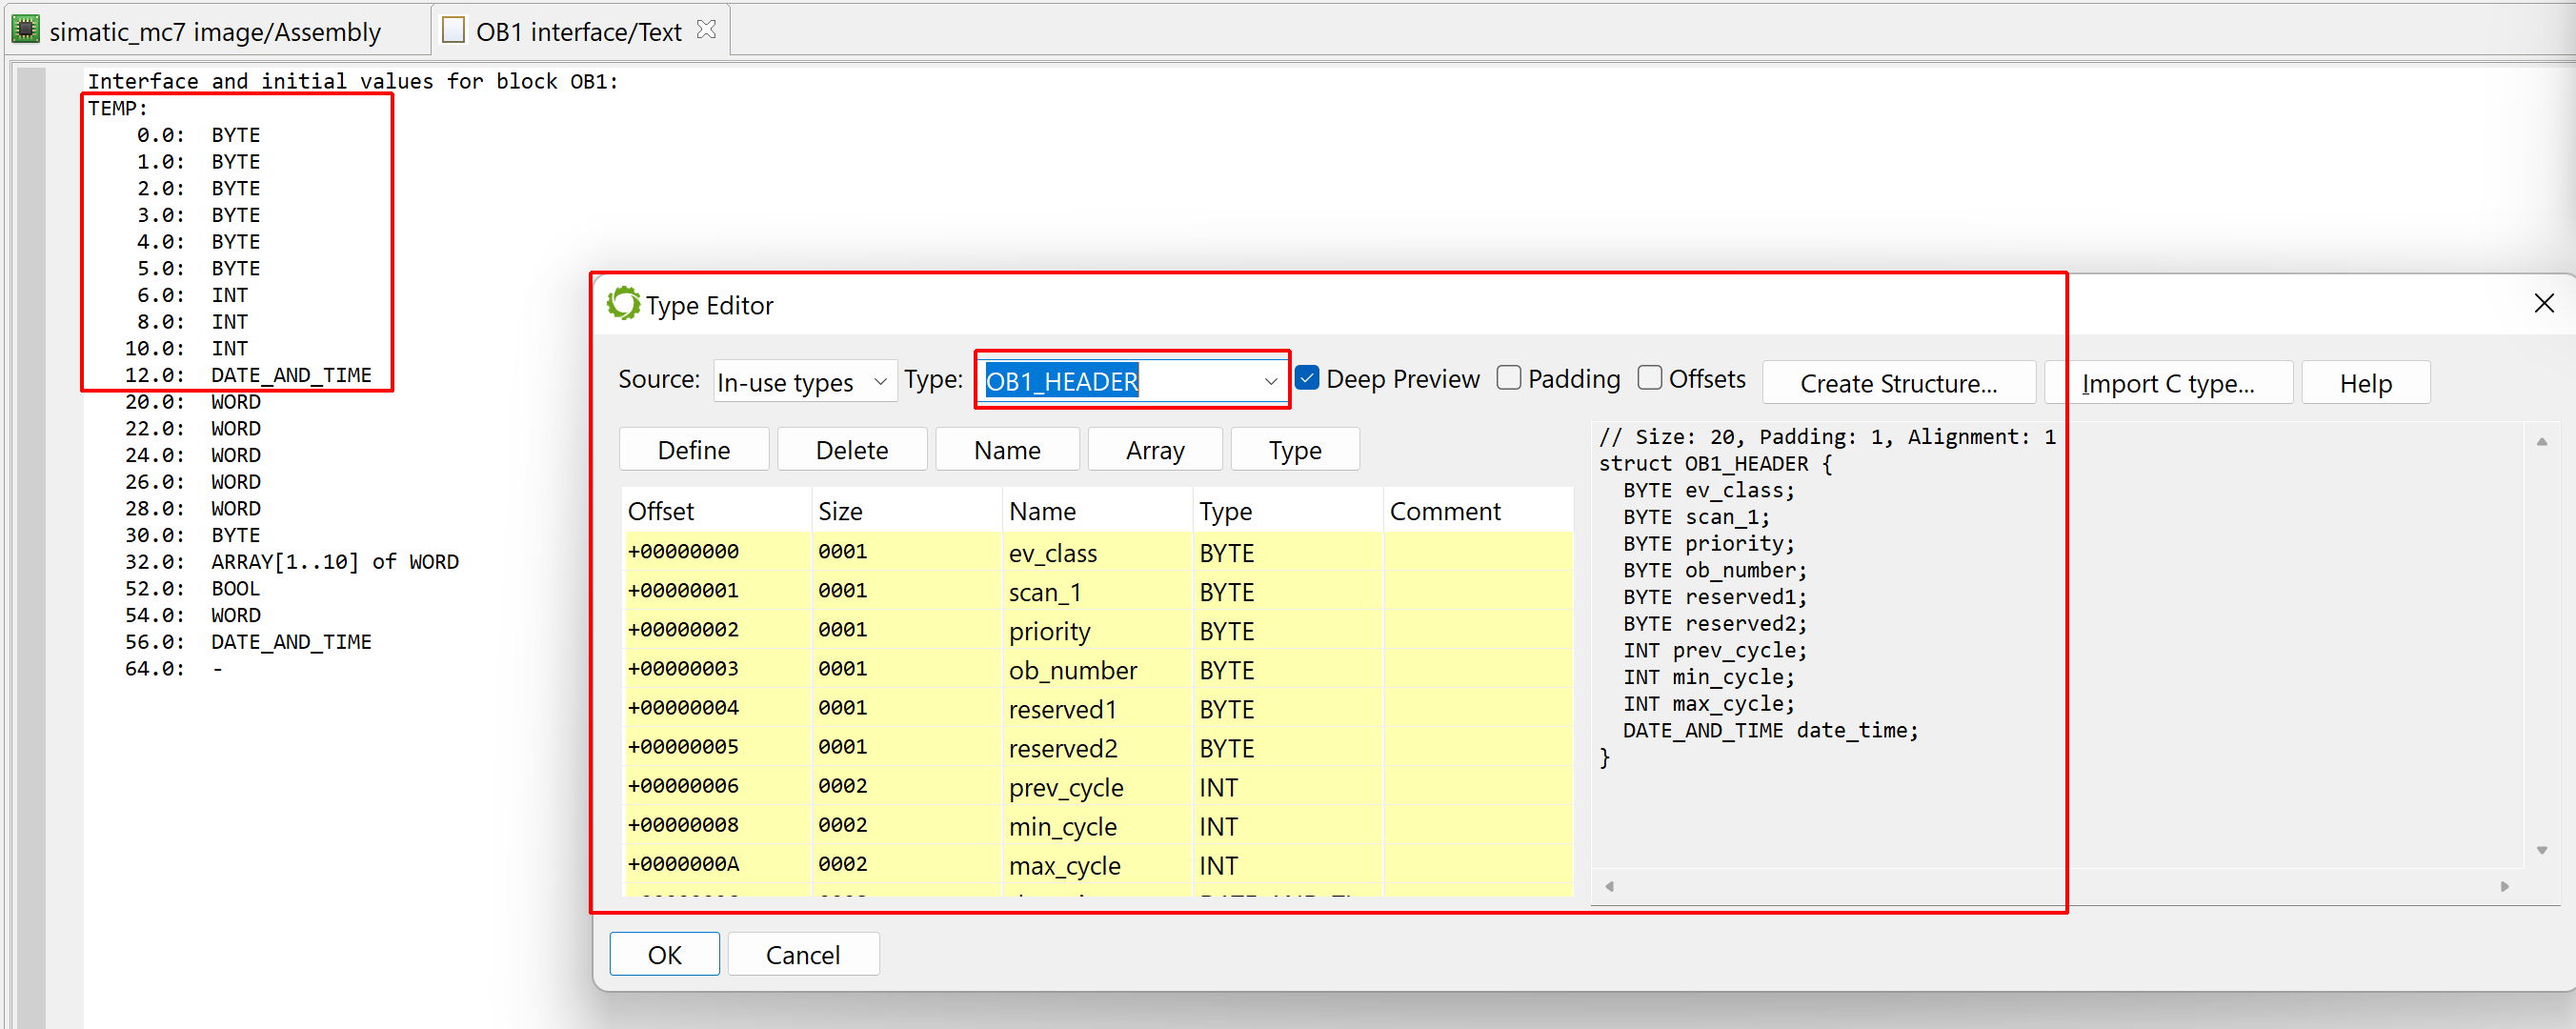
OB1 local data
The OB1 may be the most important block of your Simatic programs. While it adheres to the general structure of OB blocks (that is, a parameter-less version of FC blocks), OB1 has an important specificity to keep in mind: the first 20 (0x14) bytes of its local area is set up with important fields when the block is invoked.
off  type           name        description
 00  BYTE           EV_CLASS    event class (0x11= OB1 is active)
 01  BYTE           SCAN_1      scan type (*)
 02  BYTE           PRIORITY    priority class (?)
 03  BYTE           OB_NUMBER   OB number (1)
 04  BYTE           RESERVED_1  -
 05  BYTE           RESERVED_2  -
 06  INT            PREV_CYCLE  run time of previous cycle (ms)
 08  INT            MIN_CYCLE   min cycle time since last start-up
 0A  INT            MAX_CYCLE   max cycle time since last start-up
 0C  DATE_AND_TIME  DATE_TIME   OB calling timestamp

(*) scan types:
1: completion of a warm restart
2: completion of a hot restart
3: completion of the main cycle
4: completion of a cold restart
5: first OB1 cycle of the new master CPU
Refer to the reference documentation for more details on scan types.
You may see that by checking the interface of an OB1 block loaded in your analysis project. It is likely (although not necessary) that the interface TEMP data (locals) will start with 6 BYTEs, 3 INTs, and 1 DATE_AND_TIME fields.
The native structure used by JEB to represent this header is called OB1_HEADER. You may examine it using the native type editor widget (menu Native, Type Editor).
Interface of an OB1 block. Native type OB1_HEADER examined in the type editor widget.
Other OB blocks also receive parameters on their stack upon execution. Refer to the S7 programming manuals for details.
Idiomatic Constructs
N-way branching
The way N-way conditional branching is implemented in MC7 is via the JL instruction.
Example:
      L     MB 100  // load m[100] inside ACCU1LL (=x)
      JL    labx    // default target (x>=5)
      JU    lab0    // target if x==0
      JU    lab1    // target if x==1
      JU    lab2    // target if x==2
      JU    lab1    // target if x==3
      JU    lab2    // target if x==4
labx: L     1
      JU    next
lab0: L     W#16#10
      JU    next
lab1: L     W#16#100
      JU    next
lab2: L     W#16#1000
      JU    next
next: T     #RET_VAL
This would get decompiled as something like:
    ...
    switch(x) {
        case 0: {
            v0 = 0x10;
            break;
        }
        case 1:
        case 3: {
            v0 = 0x100;
            break;
        }
        case 2:
        case 4: {
            v0 = 0x1000;
            break;
        }
        default: {
            v0 = 1;
        }
    }
    ...
Decompiling MC7
The S7 decompiler plugin is a gendec7 plugin. As such, the plugin adheres to the INativeDecompilerPlugin interface, and can itself be customized via INativeDecompilerExtension plugin extensions.
Decompilation works on per-function basis. Select the function, then hit the TAB key (or menu Action, handler Decompile).
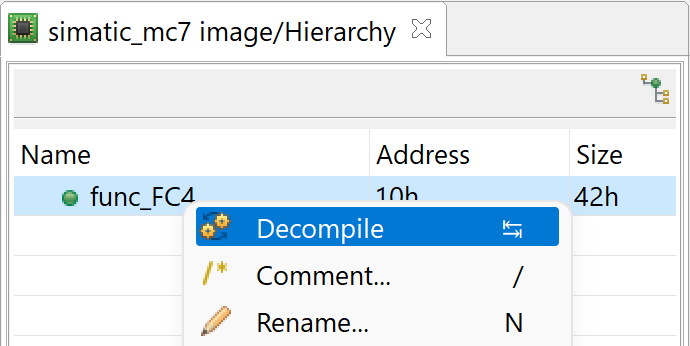
The context-menu of a method provides basic actions.
The decompiler generates a child unit of type “c“. It is represented by the client as pseudo-C code rendered in a separate fragment. (See an example below.) The pseudo-code unit, just like the disassembly code, has a flexible output actionable via the Action and Native menus. If you position the caret on a line of code and press TAB again, you will be brought back to the closest corresponding MC7 code in the disassembly view, matching the pseudo-C code.
The decompiler does not decompile to SCL. The output is not meant to be recompilable. It is meant to provide a higher-level representation of complicated, verbose, MC7 code, markable and analyzable for reverse-engineering and analysis purposes.
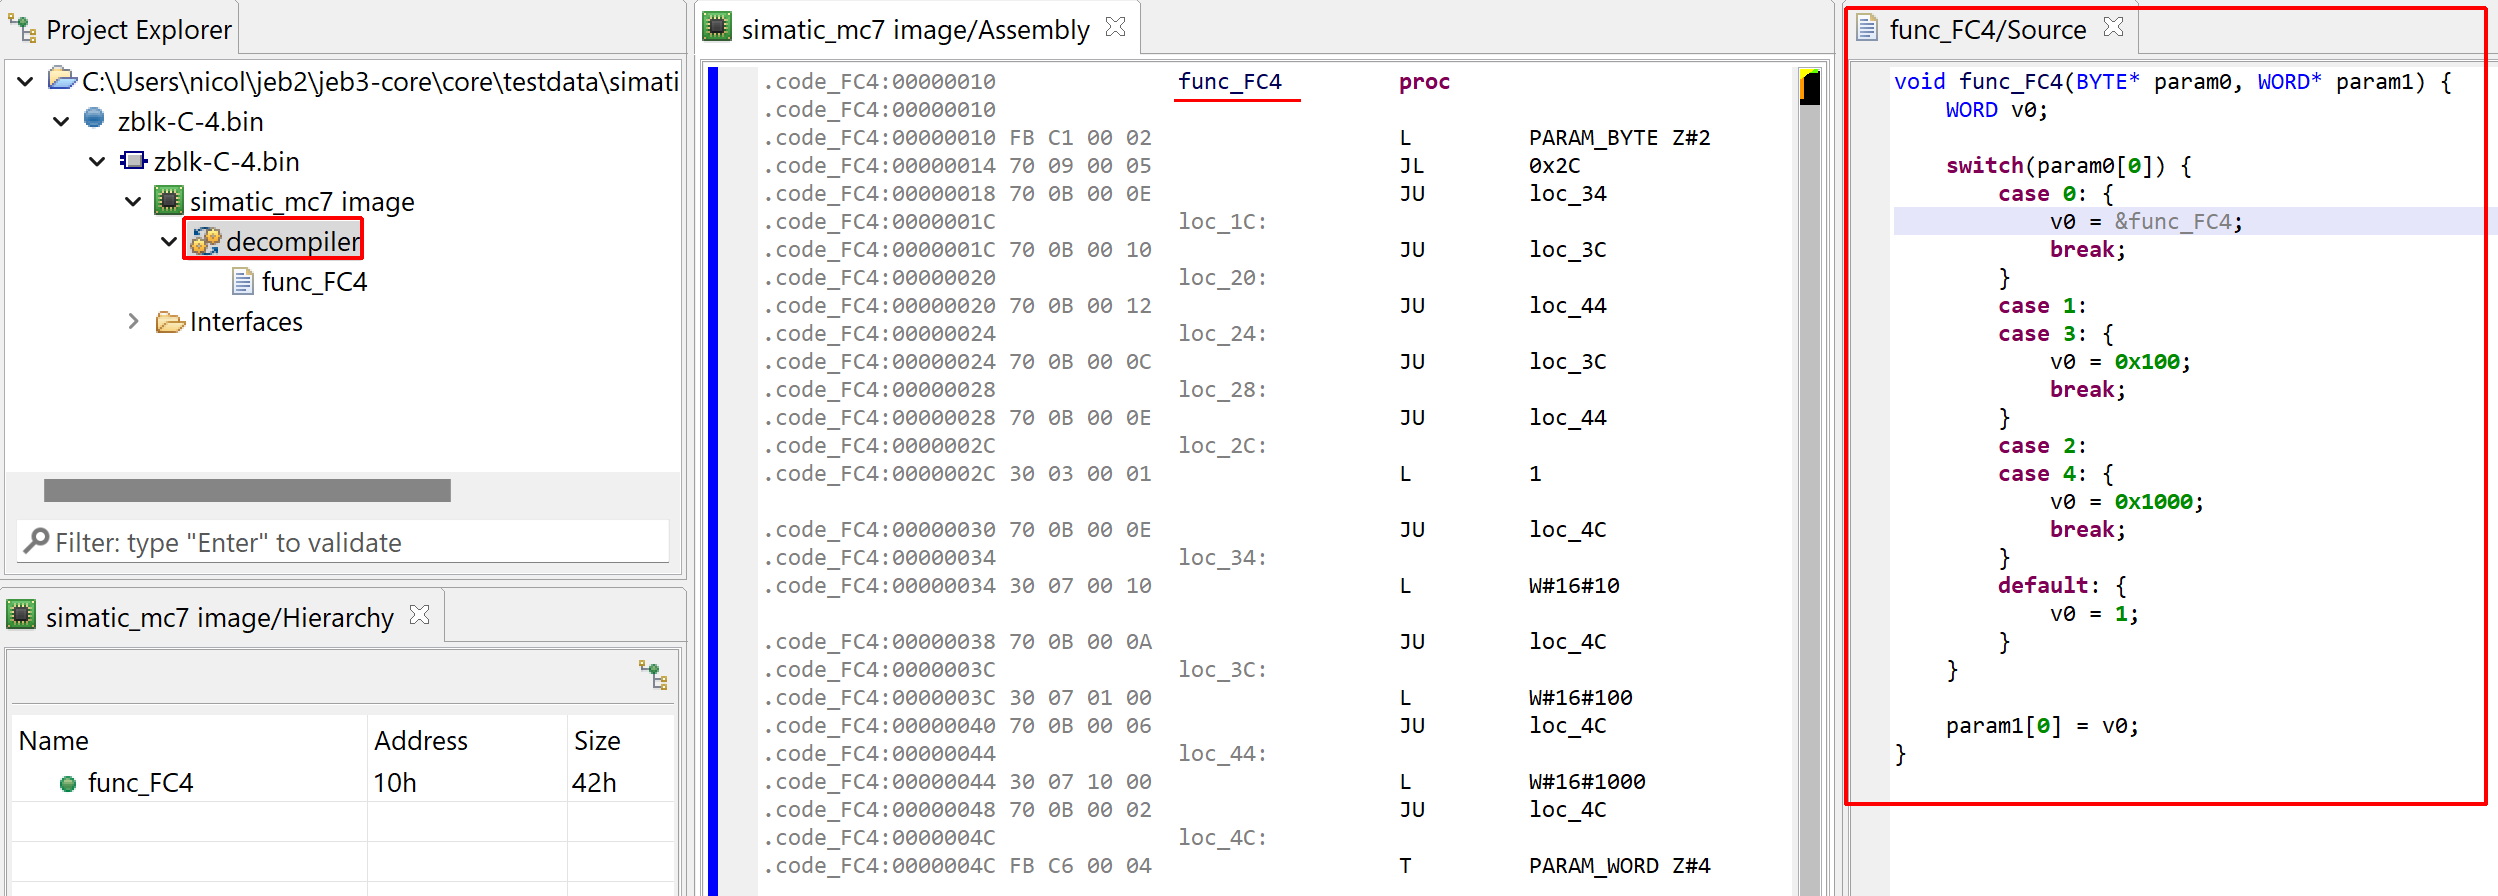
Example decompilation of a block FC4
Special operators
The decompiler may create the following custom operations (underlying IR: IEOperation with a FunctionOptype):
ExtractOff(mc7_address) -> byte_offset: extract the offset from a 4-byte MC7 address. This is equivalent to “addr >> 3) & 0xFFFF”
ExtractBit(mc7_address) -> bit_position: extract bit from a 4-byte MC7 address. This is equivalent to “addr & 7”
ToNP(mc7_address) -> native_address: convert a 4-byte MC7 address to a native VM address
ToMC7P(native_address) -> mc7_address: convert a 32-bit native address to a MC7 address
ToMC7PPTR(native_address) -> mc7_address: convert a 32-bit native address to a MC7 address referring to a MC7 pointer
FPOP(fpval) -> result: the following floating point operations: FPOP= SQR, SQRT, EXP, LN, SIN, COS, TAN, ASIN, ACOS, ATAN.
IntToBCD(int_value) -> bcd_value: convert an integer to a binary-coded decimal value
ReadTimer(timer_number) -> value
ReadCounter(counter_number) -> value
GetDBAddress(db_number) -> native_address
along with GetOBAddress, GetFBAddress, GetFCAddress, GetSFBAddress, GetSFCAddress
GetDBLength(db_number) -> block size
BitAddr(byte_offset, bit_position) -> pointer: a native pointer not referencing a byte (i.e. bit_position != 0)
Gotchas
FC conversions and invocations
As a reminder, for FC blocks, the prototypes should be converted to:
for special type arguments (block, timer, counter): by value
for primitives type arguments: by reference: MC7 address to the actual data
for POINTER/ANY arguments: by reference: MC7 address to the actual data
for complex types: by double-reference: MC7 address to MC7 pointer to the actual data
However, when generating native prototypes for FC blocks, the converter does not do that for primitive type arguments: the generated prototype uses native reference types instead of MC7 opaque references. e.g. a function (WORD,TIMER,STRING) will have its native prototype set to (WORD*,WORD,MC7P_MC7PTR_STRING) instead of (MC7P_WORD,WORD,MC7P_MC7PTR_STRING)
As for invocations: instead of rendering opaque MC7 references, such func1(0x87000010, 0x84001000), the decompiler will attempt to replace them by native references wrapped in ToMC7P or ToMC7PPTR operators, e.g. func1(ToMC7P(&varY), ToMC7P(&varZ))
Limitations
Below is a list of limitations, at the time of writing. Some limitations will disappear as the decompiler matures.
Some data types are not properly rendered by the AST component, e.g. time and date types. Most would be rendered as regular integers instead of being interpreted and rendered as pseudo strings.
The decompiler does not support multi-instance data blocks.
Nested bit operations, such as A(, O(, ), etc. are currently not translated and will fail a decompilation
The CPU is assumed to have 2 accumulators, not 4.
MCR (master-control relay) is disregarded.
The decompiler may fail converting MC7 pointers to native pointers (referencing the virtual memory).
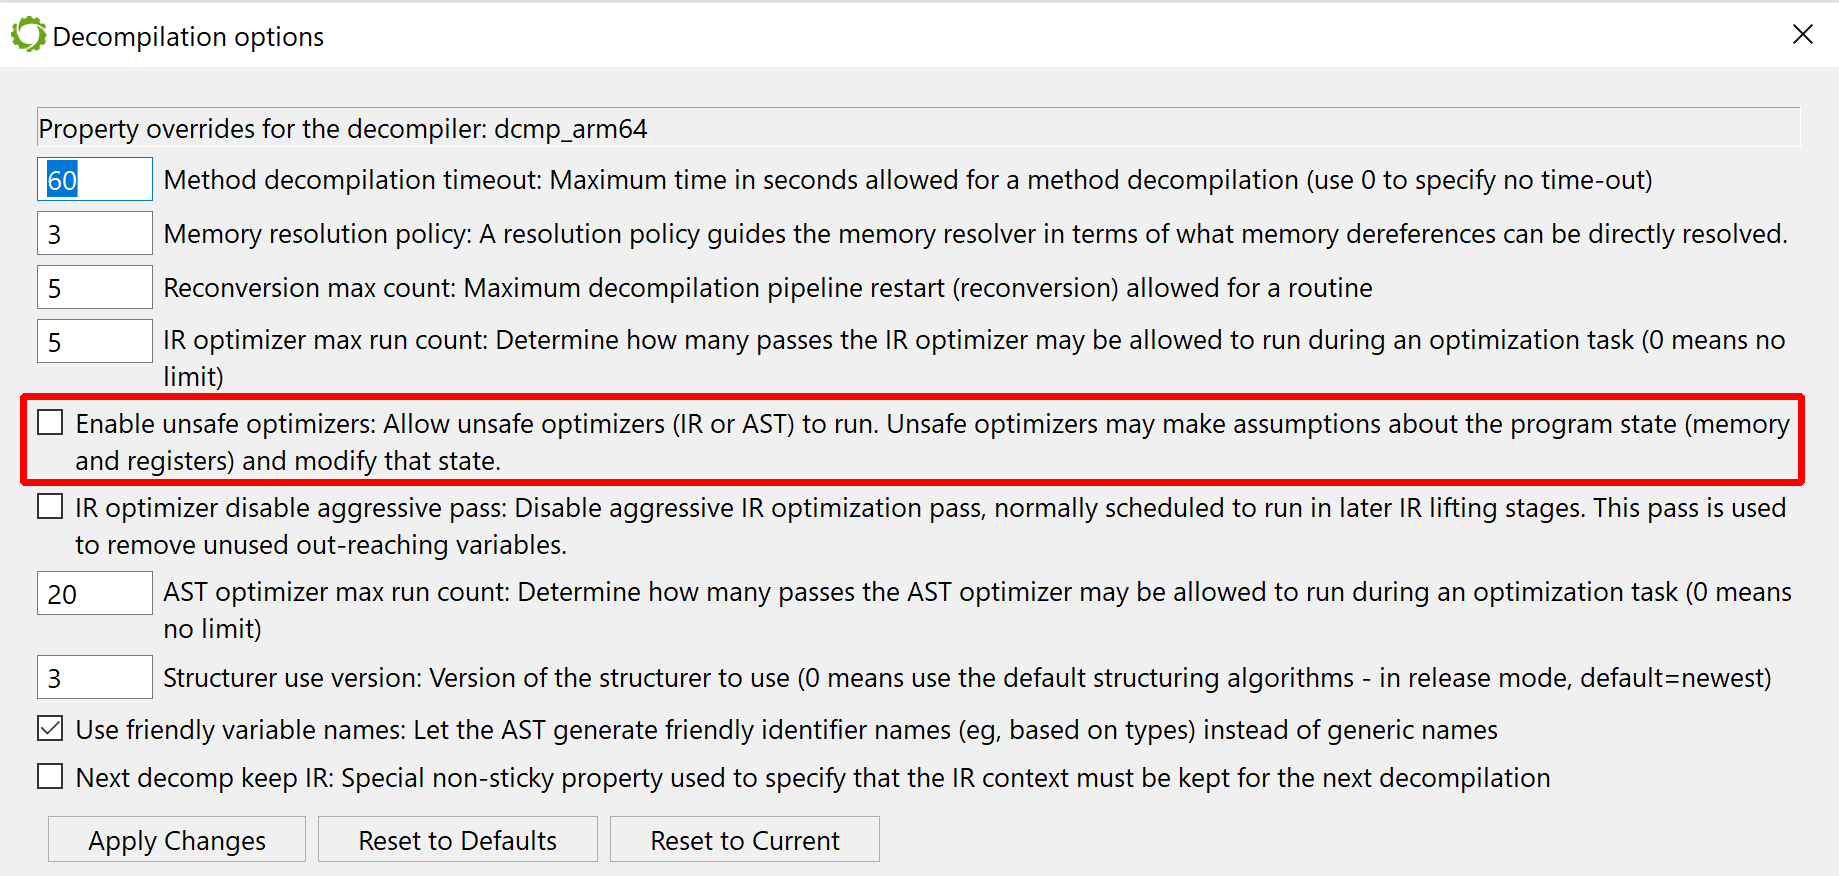
Some stack variables, representing L-variables, may subsist and appear to clutter a decompilation output. The reason is that called FC’s have access to the stack of their caller (V area), and establishing guarantee that that area is accessed as intended is very hard to establish. Unsafe optimizers may clear variables when they are deemed unused; however, in the general case, many locals should stay in place.
Generally, decompilation of MC7 code presents challenges stemming from the execution environment of MC7 and the design of the MC7 virtual machine itself: multiple memory areas (no unified VM), unorthodox pointer structures, etc. While gendec deals with those constructs in a generic way and attempts to generate pseudo-C code best representing them, it will not succeed in producing the best or most readable code in many scenarios. Such issues will be ironed out by incremental upgrades. Power-users should also keep in mind that JEB offers an expansive API allowing them to craft all sorts of extensions, including decompiler IR optimizers or AST massagers.
Library functions
While SFC and SFB blocks are reserved for system uses, the common convention is to reserve the low ranges of FC/FB block numbers for library code not classified as system code, such as utility routines whose interfaces were standardized by the IEC (International Electrotechnical Commission).
For a number of reasons, it may be inconvenient or impossible to include those blocks in your JEB project. Consequently, how would a call to a library FC or a system FC be rendered, since their prototype is theoretically unknown? While gendec has several way to recover prototypes by heuristics, the S7 extension also ships with a database of library block types and numbers with their common name and interface.
Example: if a call to FC 9 is found, but no FC 9 exists in the project, the block library will be checked for a match. In this case, the block will be understood as being “EQ_DT”. Refer to the S7 system reference manuals for details on well-known library and system blocks.
Public API
Users may craft extensions, such as scripts and plugins, in Java or Python. The reference documentation for JEB public API is located at https://www.pnfsoftware.com/jeb/apidoc.
This document’s original purpose was to be a usage manual for JEB S7 block analysis extensions.
It grew into a full-blown introduction to Simatic S7 PLC reverse engineering. While the first half is mostly tool-agnostic, the second half demonstrates how JEB can be used to speed up the analysis of S7-300/S7-400 PLC programs, from block acquisition to block analysis and code disassembly, interface recovery, and of course, decompilation.
This first draft will be updated and augmented in the future, as the extensions mature. Thank you for reading, and a big thank you to our users for your continued support!
—
Nicolas Falliere (nico at pnfsoftware dot com) Twitter @jebdec, Slack @jebdecompiler
The S7 analysis modules (https://www.pnfsoftware.com/jeb/plc) ship with JEB Pro, and are also available with JEB Demo, the trial version of JEB Pro. ↩
An analysis of the Stuxnet infection code targeting S7-300 devices by this author can be found in the Symantec paper (archived at https://www.pnfsoftware.com/other/w32_stuxnet_dossier.pdf) ↩
Starting with JEB 4.2, users have the ability to instruct dexdec1 to load external Intermediate Representation (IR) optimizer plugins. 2
From a very high-level perspective, a Dex method scheduled for decompilation goes through the following processing pipeline:
Dalvik method converted to low-level IR
SSA transformation and Typing
IR optimizations
Final high-level IR converted to AST
AST optimizations
Final clean AST rendered as pseudo-Java code (NOTE: access to the AST is already possible via JEB’s Java AST API)
Phase 3 consists of repeatedly calling IR processors, that essentially take an input IR and transform it into another, further refined IR (that process is called “lifting”). IR processors range from junk code cleaner, to variable propagation, immediate propagation, constant folding, higher-level construct rebuilding, compound predicate rebuilding, code restructuring, to all sort of obfuscation removal, advanced optimizers that may involve emulation, dynamic or symbolic execution, etc.
By working at this level, power-users have the ability to write custom deobfuscators, that we may not be able to deliver as JEB built-ins for a variety of reasons (e.g. obfuscation specific to a single group of files, custom protection to files under NDA, etc.).
Sample dexdec IR script plugin applying custom deobfuscation to recover strings on a protected sample
A sample dexdec IR plugin
dexdec IR plugins are JEB back-end plugins (not front-end scripts). Therefore, they are to be dropped in the coreplugins folder (or coreplugins/scripts for plugin scripts). They can be written as:
Precompiled jar files: the source language can be anything that compiles to Java bytecode; those plugins cannot be hot-swapped, and therefore are not ideal for prototyping/experimenting; they are great for mature plugins though.
Java plugin scripts: single Java source files. Strong typing and IDE integration (e.g. with Eclipse or IntelliJ) with Javadoc makes it ideal for developing complex plugins. Hot reload is supported. (They can be seamlessly modified while JEB is running, making them great for prototyping.)
Python plugin scripts: written in 2.7 syntax. Hot reload is supported. Restriction: unlike other plugins, an instance of a Python script plugin may be shared by multiple decompilation threads. Therefore, they must be thread-safe and support concurrency.
In this blog, we will show how to write a Python plugin script. Users familiar with JEB client scripting will be in familiar territory.
IMPORTANT! Note that loading such plugins is not enabled by default in JEB. Add the following line to your bin/jeb-engines.cfg file to enable loading Python plugins: .LoadPythonPlugins = true
dexdec ir plugins must implement the IDOptimizer interface. In practice, it is highly recommended to extend the implementing class AbstractDOptimizer, like this:
from com.pnfsoftware.jeb.core.units.code.android.ir import AbstractDOptimizer

# sample IR plugin, does nothing but log the IR CFG
class DOptSamplePython(AbstractDOptimizer):

  # perform() returns the number of optimizations performed
  def perform(self):
    self.logger.info('MARKER - Input IR-CFG: %s', self.cfg)
    return 0
IMPORTANT! All dexdec IR public interfaces and types are located in the com.pnfsoftware.jeb.core.units.code.android.ir package. Keep a tab opened on this page while you develop IR plugins!
The skeleton above:
must have the same filename as the plugin class, therefore DOptSamplePython.py
must be dropped in coreplugins/scripts/
requires Python script plugins to be enabled in your engines configuration
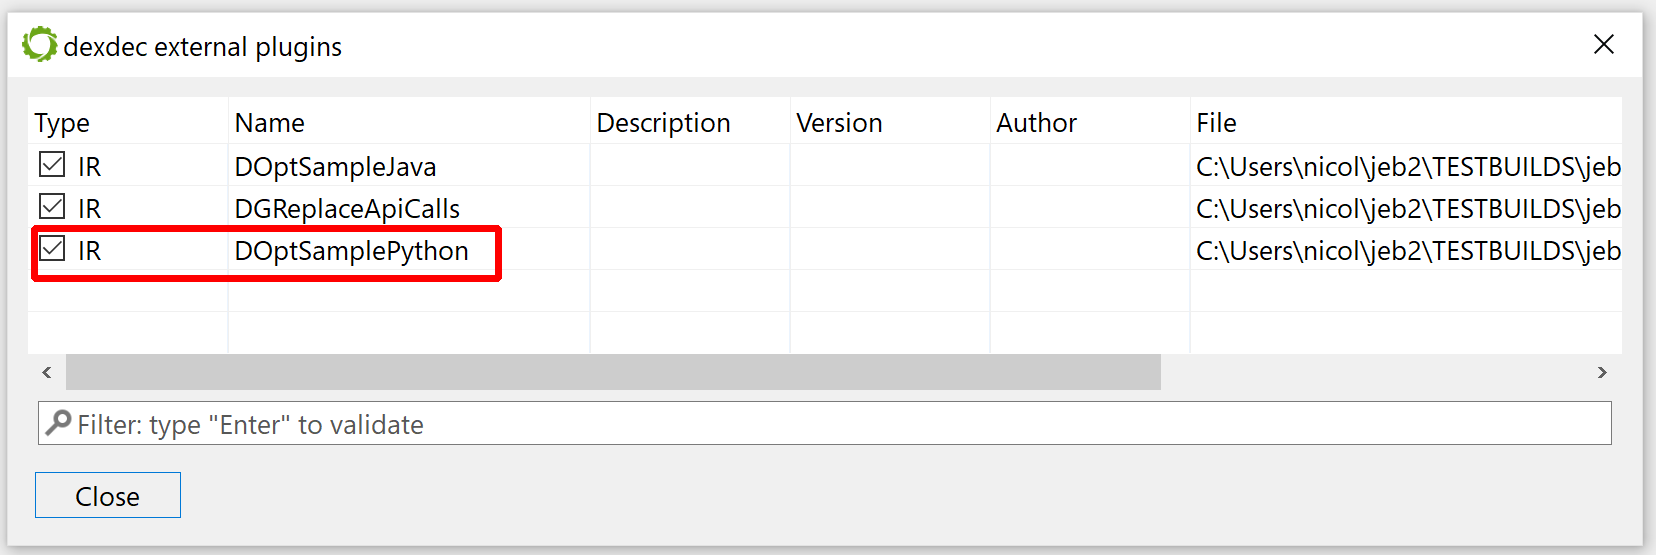
If you haven’t done so, start JEB. Your plugin should appear in the list of dexdec plugins. Check the Android menu, Decompiler Plugins handler:
A list of external Dex decompiler plugins
Now load a dex/apk, and decompile any class. Your plugin will eventually be called. The logger view should attest to that by displaying multiple “MARKER – Input IR-CFG: …” lines.
dexdec Intermediate Representation
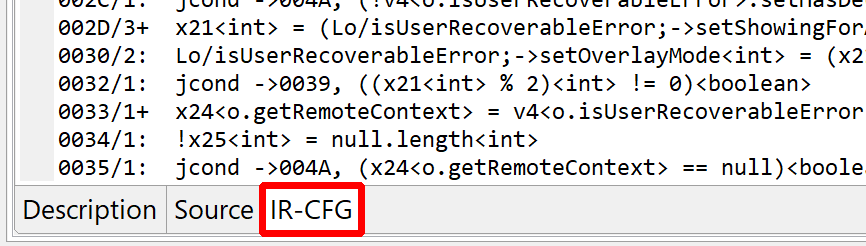
dexdec‘s IR consists of IDElement objects. Every IR statement is an IDInstruction, itself an IDElement. (All those types and their attributes are described in depth in the API doc.) When an IR plugin is called, it “receives” an IDMethodContext (representing a decompiled method), stored in the optimizer’s ctxpublic field. The IR CFG, a control flow graph consisting of IR statements, can be retrieved via ctx.getCfg(). It is also stored in the cfgpublic field, for convenience. A formatted IR CFG may look like this:
Statements (IDInstruction) can have any of the following opcodes (see DOpcodeType): – IR_NOP: no-operation – IR_ASSIGN: assignment – IR_INVOKE: invocation (including new object and new array construction) – IR_JUMP: unconditional jump – IR_JCOND: conditional jump – IR_SWITCH: switch statement – IR_RETURN: return statement – IR_THROW: throw statement – IR_STORE_EXCEPTION: exception retrieval (special) – IR_MONITOR_ENTER: VM monitor acquisition – IR_MONITOR_EXIT: VM monitor release
Statement operands are themselves IDElements, usually IDExpressions. Examples: IDImm (immediate values), IDVar (variables), IDOperation (arithmetic/bitwise/cast operations), IDInvokeInfo (method invocation details), IDArrayElt (representing array elements), IDField (representing static or instance fields), etc. Refer to the hierarchy of IDElement for a complete list.
IR statements can be seen as recursive IR expression trees. They can be easily explored (visitXxx method()) and manipulated. They can be replaced by newly-created elements (see IDMethodContext.createXxx methods). Data-flow analysis can be performed on IR CFG, to retrieve use-def and def-use chains, and other variable liveness and reachability information (see cfg.doDataFlowAnalysis).
Use-case: cleaning useless Android calls
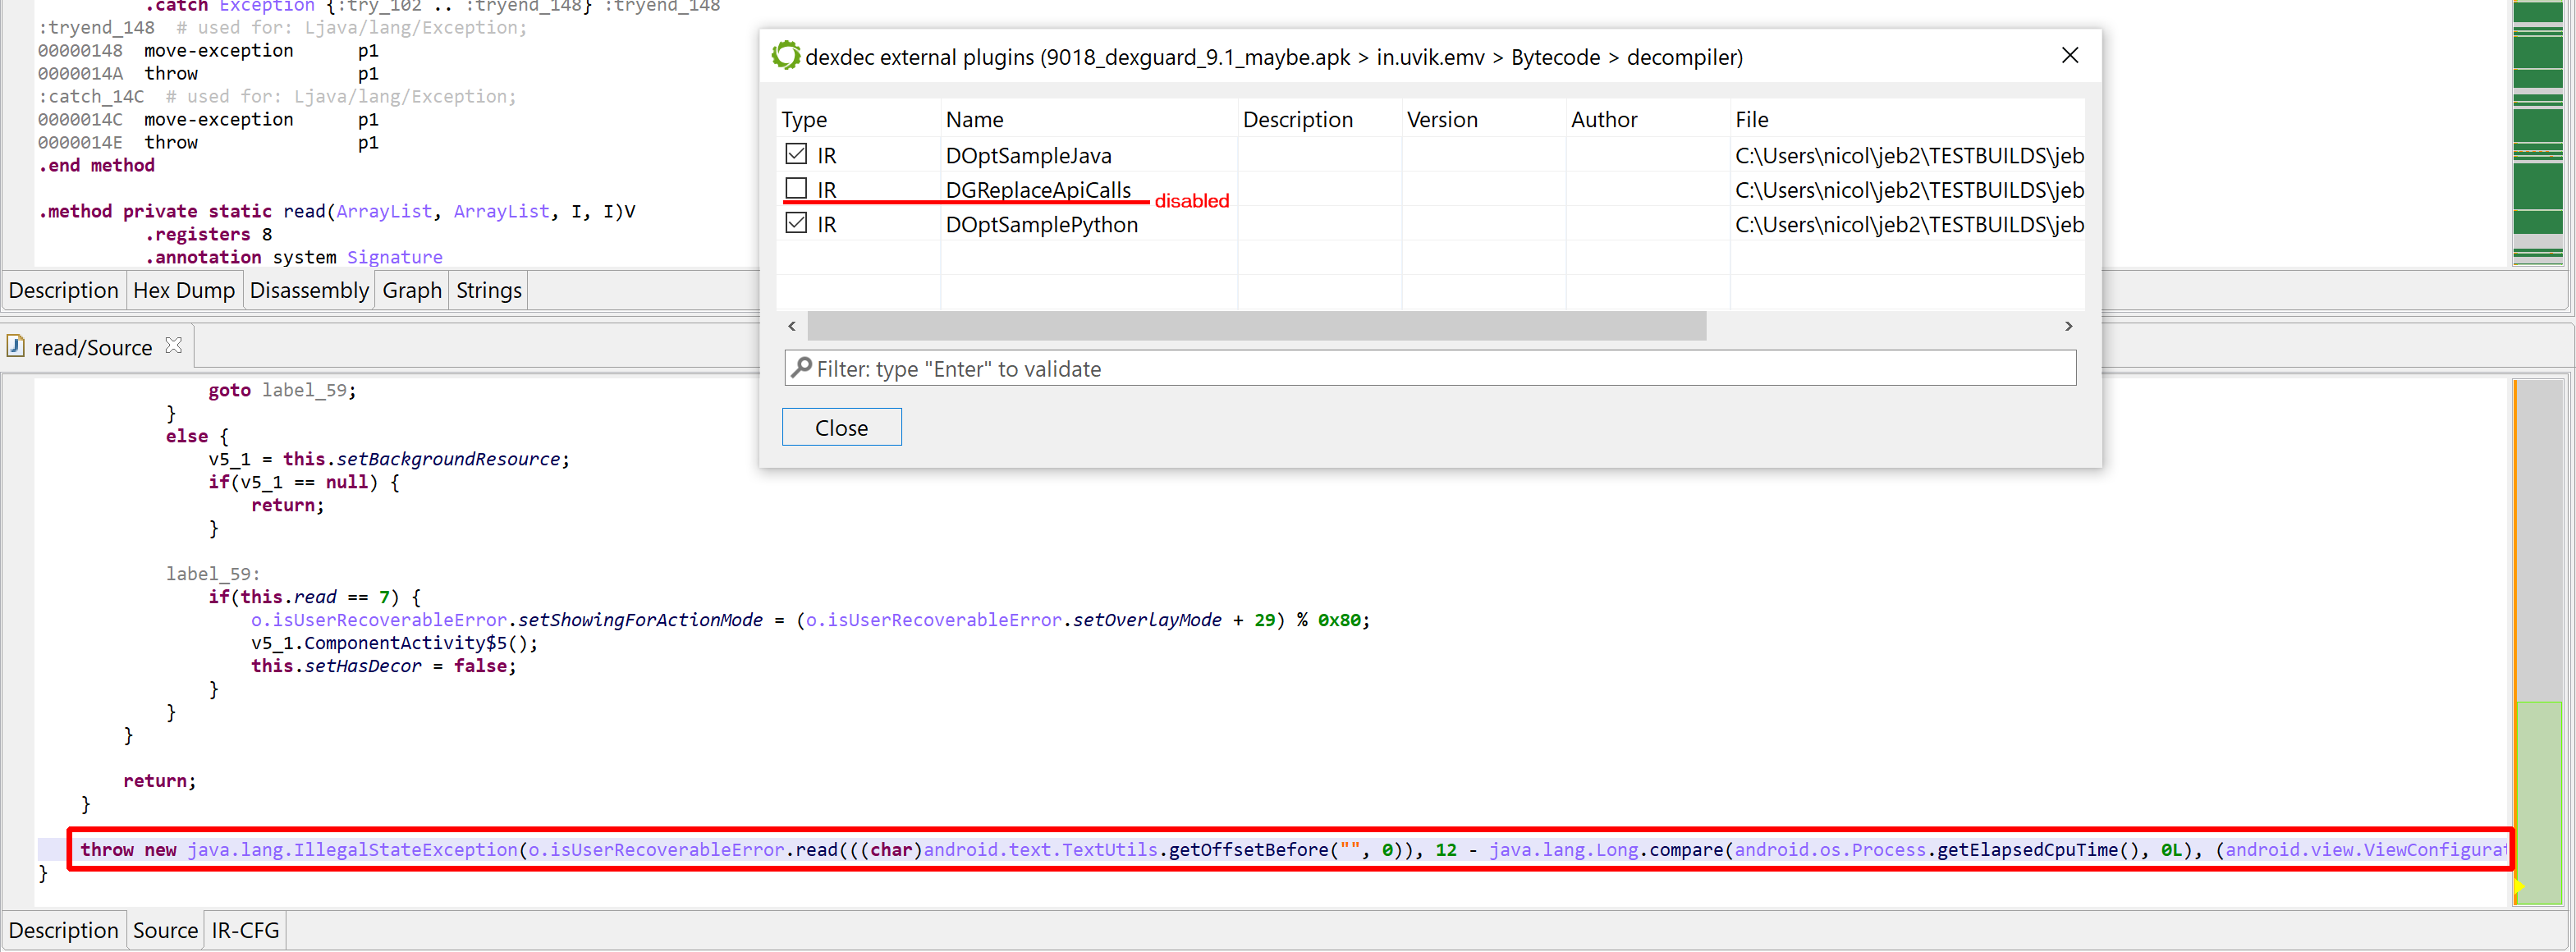
Let’s put this new API to practical, real-world use. First, some background: JEB ships with emulator-backed IR optimizers that attempt to auto-decrypt immediates such as strings. While this deobfuscator generally performs well on protected files, lately, we’ve received samples for which strings were not decrypted. The reason is quite straight-forward, see this example:
In the above code (extracted from a protected method), read is a string decryptor. Alas, the presence of calls such as:
TextUtils.getOffsetBefore(“”, 0))
Long.compare(Process.getElapsedCpuTime(), 0L)
ViewConfiguration.getFadingEdgeLength() >> 16
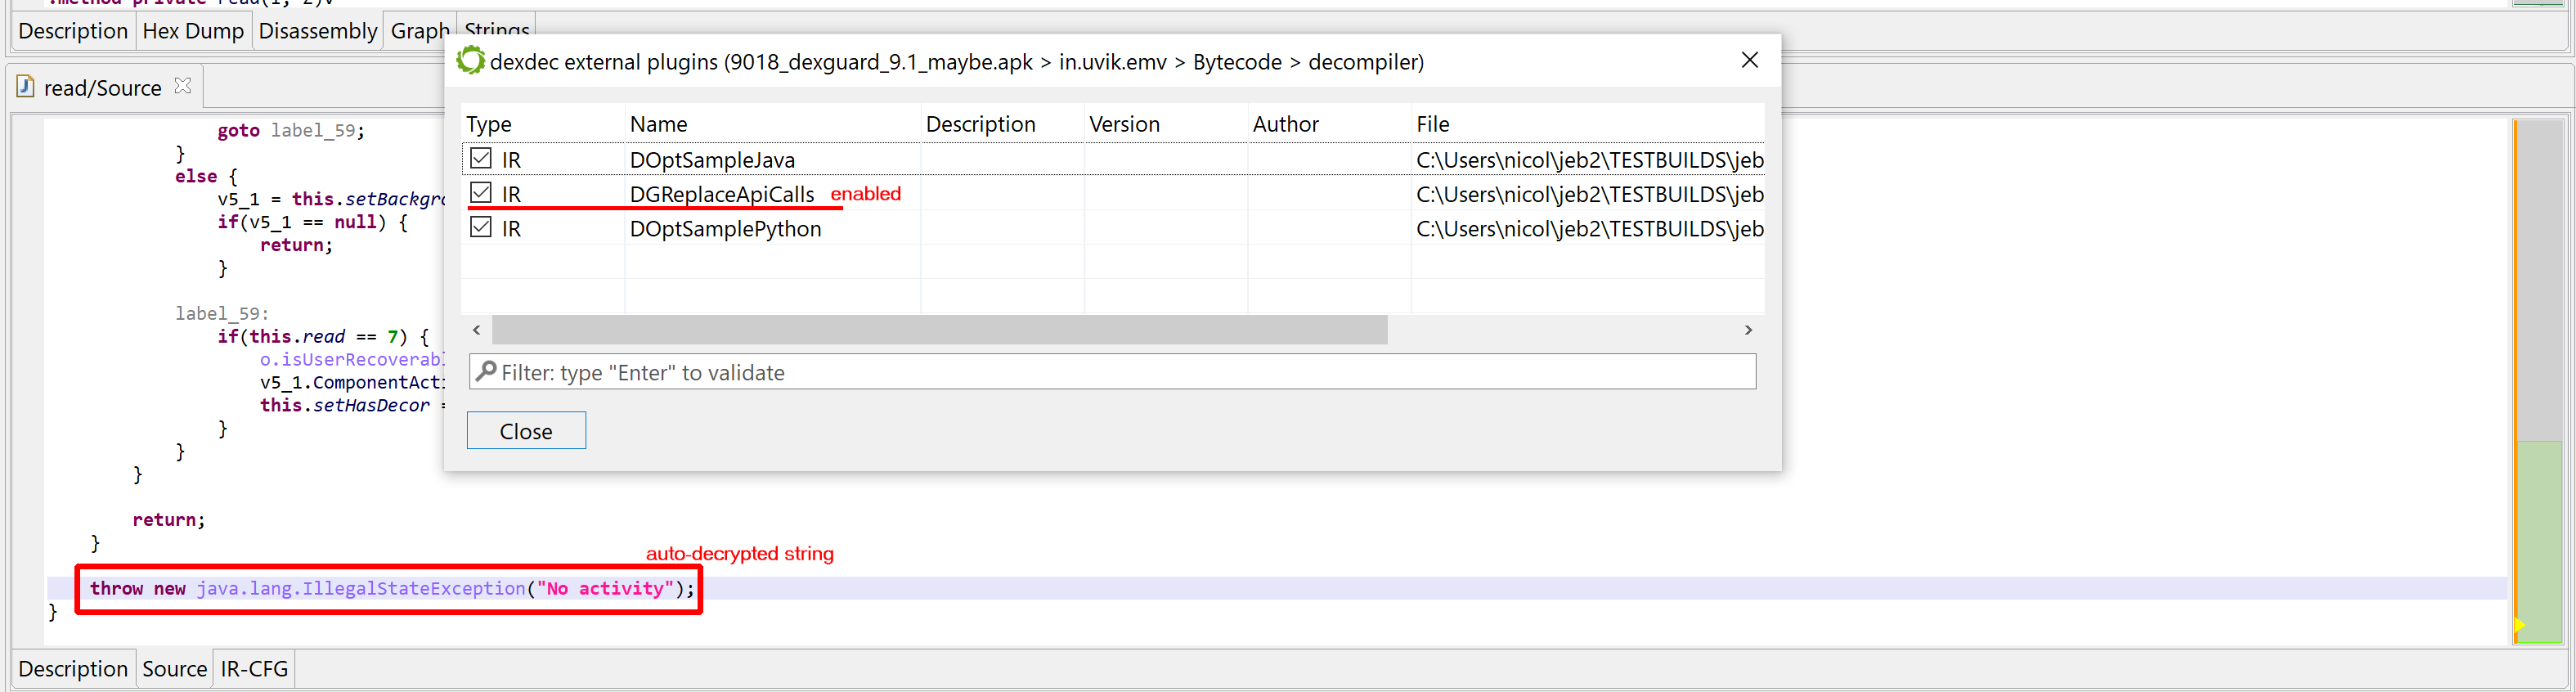
prevent the generic decryptor from kicking in. Indeed, what would an emulator be supposed to make with those calls to external APIs, whose result is likely to be context-dependent? In practice though, they could be resolved by some ad-hoc optimizations:
getOffsetBefore() algorithm is (almost) straightforward
getElapsedCpuTime() also returns strictly positive results, making compare() operation predictable
getFadingEdgeLength() returns small ints, less than 0x10000
We will craft the following IR optimizer: (file RemoveDummyAndroidApiCalls.py)
from com.pnfsoftware.jeb.core.units.code.android.ir import AbstractDOptimizer, IDVisitor

class RemoveDummyAndroidApiCalls(AbstractDOptimizer):  # note that we extend AbstractDOptimizer for convenience, instead of implementing IDOptimizer from scratch
  def perform(self):
    # create our instruction visitor
    vis = AndroidUtilityVisitor(self.ctx)
    # visit all the instructions of the IR CFG
    for insn in self.cfg.instructions():
      insn.visitInstruction(vis)
    # return the count of replacements
    return vis.cnt

class AndroidUtilityVisitor(IDVisitor):
  def __init__(self, ctx):
    self.ctx = ctx
    self.cnt = 0

  def process(self, e, parent, results):
    repl = None

    if e.isCallInfo():
      sig = e.getMethodSignature()

      # TextUtils.getOffsetBefore("", 0)
      if sig == 'Landroid/text/TextUtils;->getOffsetBefore(Ljava/lang/CharSequence;I)I' and e.getArgument(0).isImm() and e.getArgument(1).isImm():
        buf = e.getArgument(0).getStringValue(self.ctx.getGlobalContext())
        val = e.getArgument(1).toLong()
        if buf == '' and val == 0:
          repl = self.ctx.getGlobalContext().createInt(0)

      # Long.compare(xxx, 0)
      elif sig == 'Ljava/lang/Long;->compare(JJ)I' and e.getArgument(1).isImm() and e.getArgument(1).asImm().isZeroEquivalent():
        val0 = None
        arg0 = e.getArgument(0)
        if arg0.isCallInfo():
          sig2 = arg0.getMethodSignature()
          if sig2 == 'Landroid/os/Process;->getElapsedCpuTime()J':
            # elapsed time always >0, value does not matter since we are comparing against 0
            val0 = 1
        if val0 != None:
          if val0 > 0:
            r = 1
          elif val0 < 0:
            r = -1
          else:
            r = 0
          repl = self.ctx.getGlobalContext().createInt(r)

      # ViewConfiguration.getFadingEdgeLength()
      elif sig == 'Landroid/view/ViewConfiguration;->getFadingEdgeLength()I':
        # always a small positive integer, normally set to FADING_EDGE_LENGTH (12)
        repl = self.ctx.getGlobalContext().createInt(12)

    if repl != None and parent.replaceSubExpression(e, repl):
      # success (this visitor is pre-order, we need to report the replaced node)
      results.setReplacedNode(repl)
      self.cnt += 1
What does this code do: – First, it enumerates and visits all CFG instructions. – The visitor checks for IDCallInfo IR expressions matching the kinds of Android framework API calls described above: getOffsetBefore(), compare(getElapsedCpuTime(), 0), getFadingEdgeLength() – It evaluates and calculates the results, and replaces IR call expressions (IDInvokeInfo) by newly-created constants (IDImm).
The resulting IR, which the plugin could print, would look like:
throw new java.lang.IllegalStateException(o.isUserRecoverableError.read(((char)0, 12 - 1, 0 + 798).intern());
Subsequently, other optimizers, built into dexdec, can kick in, clean the code further (e.g. fold constants), and make the read() invocation a candidate for string auto-decryption, yielding the following result:
Our external IR plugin is enabled. The IR can be cleaned, the auto-decryption takes place.
Done!
The sample script can be found in your coreplugins/scripts folder. Feel free to extend it further.
Tips
dexdec IR plugins can also be written as Java source. Have a look at the sample file DOptSampleJava.java, located in coreplugins/scripts. As a plugin grows in size and complexity, working with a strongly-typed language like Java, coupled with excellent javadoc integration in IDE, becomes extremely valuable.
When prototyping IR plugins, the Dalvik code targeted for deobfuscation is oftentimes contained in a single method. In such cases, it may be cumbersome or costly to decompile entire classes. To easily decompile a single method in the GUI, do Decompile with Options (Action menu or right-click), and untick “Decompile top level container class”:
With this option disabled, when your caret is positioned on a method, issuing a decompilation request will only decompile the target method, and nothing else (not even inner classes/methods of the target will be decompiled.)
Using the previous technique, the generated decompiled view represents an AST IJavaMethod — not the usual IJavaClass. Fully-qualified names are used to represent types, since import statements are not specified. An added value to the views associated with such units lies in the “IR-CFG” fragment, representing the final (most refined) IR before the AST generation phase kicked in:
Final IR viewed in the source unit for an IJavaMethod
Many IR utility routines are located in the DUtil class. Generally, explore the ir/ package’s javadoc, you will find plenty useful information in there.
We haven’t talked about accessing and using the emulator and sandbox. The main interface is IDState, and we will detail some of its functionality in a later post. In the meantime, you will find sample code on our GitHub repo.
That’s it for now – Have fun crafting your own IR plugins. As usual, reach us on Twitter’s @jebdec, Slack’s jebdecompiler, or privately over email. Until next time! – Nicolas
dexdec is JEB’s Dex/Dalvik decompiler; gendec is JEB’s generic decompiler for all other architectures (x86, arm, etc.). ↩
Note that gendec has been allowing that for quite some time; its IR is different than dexdec‘s IR though. ↩
JEB version 4 has been in the making for over a year and half! The Beta has been available for all users for the past 5 months. Thank you for the feedback that many of you provided, it helped iron things out. The list below is a non-exhaustive changelog of additions since JEB 3.28.2.
Finally, on a related note: JEB 4.2 is around the corner already, with significant API additions that allow more control over the dex decompilation pipeline, in particular support for dexdec IR (Intermediate Representation) plugins. They unlock the possibility to write IR optimizers to thwart complex obfuscations. Stay tuned!
Now for a list of 3.28-to-4.1 changes:
Core changes (high-level)
gendec: JEB’s generic decompiler for all architectures but dex (i.e. x86, arm, mips, ethereum, wasm, etc.) received many important upgrades, and was one of the major focus for v4
dexdec: JEB’s dex/dalvik decompiler received important additions, most notably an emulator coupled with a custom sandbox that allows the generic auto-decryption and deobfuscation of data and code
native code analysis: upgrades, incl. performance, more analysis options, better switch recognition, tail-calls detection, etc.
debuggers: updates and support for dynamic addition of native code units
siglibs (library code recognition): updates for Android NDK, MSVC
‘codeless’ siglibs: see blog post; added codeless signatures for OpenSSL and libcurl
typelibs (type libraries): updates
x86: added MSVC exception parsing
decompiler API: many additions for scripts/plugins to perform finer-grained decompilations
dex: context-information database to specify context-sensitivity and side-effects for methods, to allow better optimizations
dex: support for method and class moving (to classes/methods), for ex. allowing the creation of anonymous classes (previously, only class-to-package moving was supported)
dex: better obfuscated enum reconstruction
dex API: additions
comment manager: support inline, header (i.e. pre, above) and meta comments
JDB2 databases: upgraded the serialization process, now reliable on very large projects (previously could trigger OOM errors if -Xss had a low value)
Miscellaneous performance improvements, fixes and tweaks
Specific to gendec
x86/x64: decompiler plugin upgrades (incl. support for x87, mmx, sse, and supplementary ISAs)
arm/aarch64: decompiler plugin upgrades (incl. more opcodes and additional ISAs)
mips/mips64: decompiler plugin upgrades (incl. more opcodes and additional ISAs)
One of the new exciting features coming with JEB 4.0 is a set of signatures to identify common native libraries in a compiler-agnostic fashion.
These “codeless” signatures were built to tackle an old reverse-engineering problem: the identification of common open-source libraries in executables. Because such libraries are compiled by the developers themselves, traditional code-based signatures — like our own SigLib — need to be re-generated with the same compiler setup than the developers, otherwise the signatures won’t match because the code differs.
Therefore, identifying open-source libraries with code-based signatures is a lots of effort for a small return, because each set of signatures only matches one compiler setup (compiler’s version, optimization level…), and there is a vast number of them!
We developed codeless signatures to identify open-source libraries without the burden of signatures re-generation for each compiler setup. We are currently shipping signatures for the following libraries:
OpenSSL, versions 0.9.8m to 1.1.1g
libcurl, versions 7.30.0 to 7.71.1
libssh2, versions 1.8.0, 1.8.2 and 1.9.0
bzip2, versions 1.0.6 and 1.0.8
zlib, versions 1.2.3, 1.2.8, 1.2.10 and 1.2.11
The signatures can be applied on any binary opened in JEB, through “Native > Codeless Signatures Libraries” menu.
We also ship an automatic library version identification tool (available from “Codeless Signature Libraries” dialog), which should help to decide which versions of the library was linked, when it not obvious.
In order to build such signatures we made some tradeoffs, notably by accepting to miss some routines and to have a few false positives. We believe JEB’s codeless signatures are particularly suitable when one is not interested into library’s internals, and therefore the only library routines whose name really matter are the ones used by the rest of the code (like when doing malware analysis).
Overall, our current experiments show promising results, for example we usually identify 50-60% of OpenSSL routines, with a false positives ratio of less than 2%, on a variety of architecture/compiler setups.
We will describe in details the internals of JEB’s codeless signatures in an upcoming whitepaper, but in the meantime we made a video to demonstrate how to use them:
We really encourage you to test JEB’s codeless signatures and report feedback through the usual channels:
Under some circumstances, JEB’s generic decompiler is able to detect inline decryptors, and subsequently attempt to emulate the underlying IR to generate plaintext data items, both in the disassembly view and, most importantly, decompiled views.1
This feature is available starting with JEB 4.0.3-beta. It makes use of the IREmulator object, available in the public API for scripting and plugins.
–
Here’s an example of a protected elf file2 (aarch64) that was encountered a few months ago:
Disassembly of the target routine
GENDEC’s unsafe optimizers are enabled by default. Let’s disable them before performing a first decompilation, in order to see what the inline decryptor looks like.
To bring up the decompilation options on-demand, use CTRL+TAB (or Command+TAB), or alternatively, menu Action, command Decompile with OptionsDecompilation #1: unsafe optimizers disabled
That decryptor’s control flow is obfuscated (flattened, controlled by the state variable v5). It is called once, depending on the boolean value at 0x2F227. Here, the decrypted contents is used by system_property_get.
Below, the contents in virtual memory, pre-decryption:
Encrypted contents.
Let’s perform another decompilation of the same routine, with the unsafe optimizers enabled this time. GENDEC now will:
detect something that potentially could be decryption code
start emulating the underlying IR (not visible here, but you can easily read/write the Intermediate Representation via API) portion of code is emulated
collect and apply results
See the decrypted contents below. (An data item existed beforehand at 0x2F137, and the decompiler chose not to erase it.) The decompiled code on the right panel no longer shows the decryption loop: an optimizer has discarded it since it can no longer be executed.
Decompilation #2: unsafe optimizers enabled
We may convert the data item (or bytes) to a string by pressing the A key (menu Native, command Create String). The decompiled code will pick it up and refresh the AST as well.
The final result looks like:
The VM and decompiled view show the decrypted code, “ro.build.version.sdk”
A few additional comments:
This optimizer is considered unsafe3because it is allowed to modify the VM of the underlying native code unit, as seen above.
The optimizer is generic (architecture-agnostic). It performs its work on the underlying IR mid-stage in the decompilation pipeline, when various optimizations are applied.
It makes use of public API methods only, mostly the IREmulator class. Advanced users can write similar optimizers if they choose to. (We will also publish the code of this optimizer on GitHub shortly, as it will serve as a good real-life example of how to use the IR emulator to write powerful optimizers. It’s slightly more than 100 lines of Java.)
We hope you enjoy using JEB 4 Beta. There is a license type for everyone, so feel free to try things out. Do not hesitate to reach out to us on Twitter, Slack, or privately over email! Thanks, and until next time 🙂
Users familiar with JEB’s Dex decompilers will remember that a similar feature was introduced to JEB 3 in 2020, for Android Dalvik code. ↩
sha256 43816c47315aab27e50e6f895774a7b86d591807179e1d3262446ab7d68a56ef also available as lib/arm64-v8a/libd.so in 309d848275aa128ebb7e27e570e5a2876977122625638630a6c61f7434b771c3 ↩
“unsafe” in the context of decompilation; unsafe here is not to be understood as, “could any code be executed on the machine”, etc. ↩