In this series: Part 1, Part 2, Part 3
The third part of this series is about bytecode virtualization. The analyses that follow were done statically.
Bytecode virtualization is the most interesting and technically challenging feature of this protector.
TL;DR:
– JEB Pro can un-virtualize protected methods.
– A Global Analysis (Android menu) will point you to p-code VM routines.
– Make sure to disable Parse Exceptions when decompiling such methods.
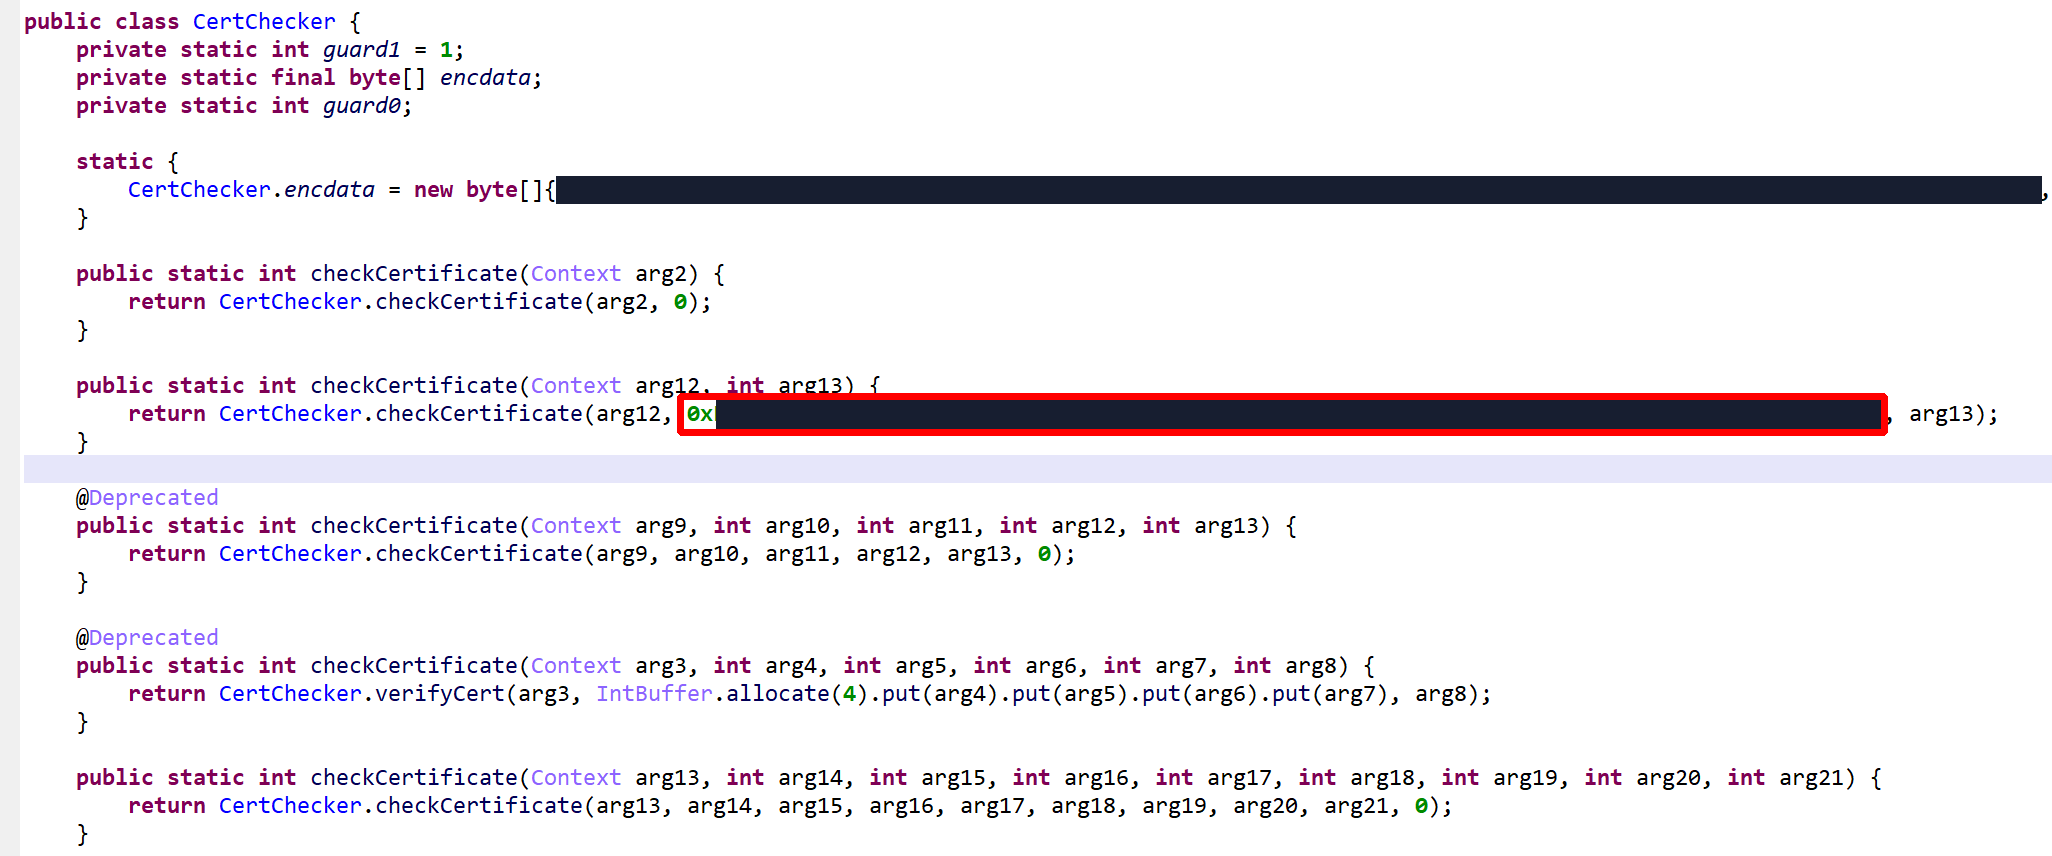
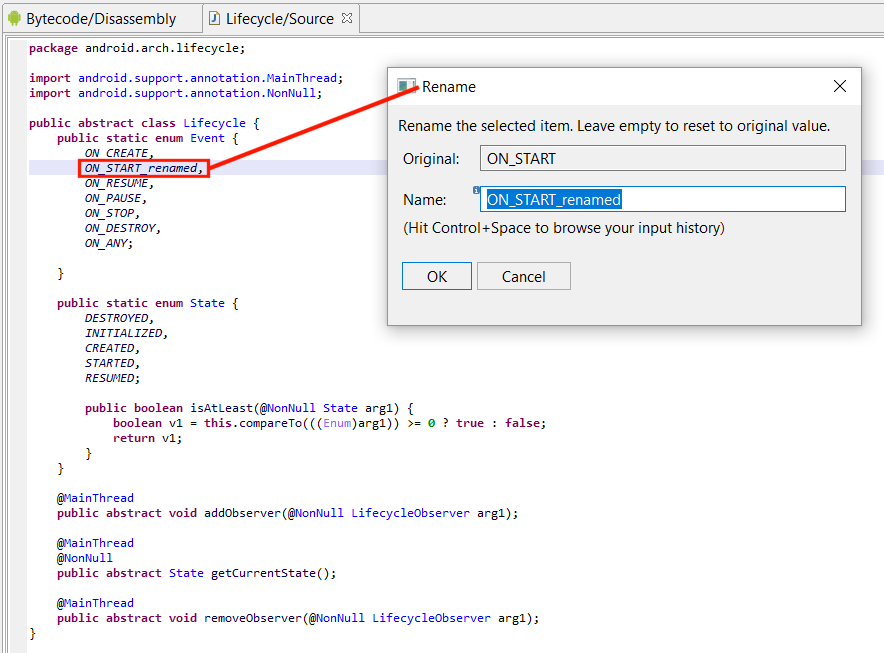
– For even clearer results, rename opaque predicates of the method to guard0/guard1 (refer part 1 of this blog for details)
What Is Code Virtualization
Relatively novel, code virtualization is possibly one of the most effective protection technique there is 1. With it come relatively heavy disadvantages, such as hampered speed of execution 2 and the difficulty to troubleshoot production code. The advantages are heightened reverse-engineering hurdles over other more traditional software protection techniques.
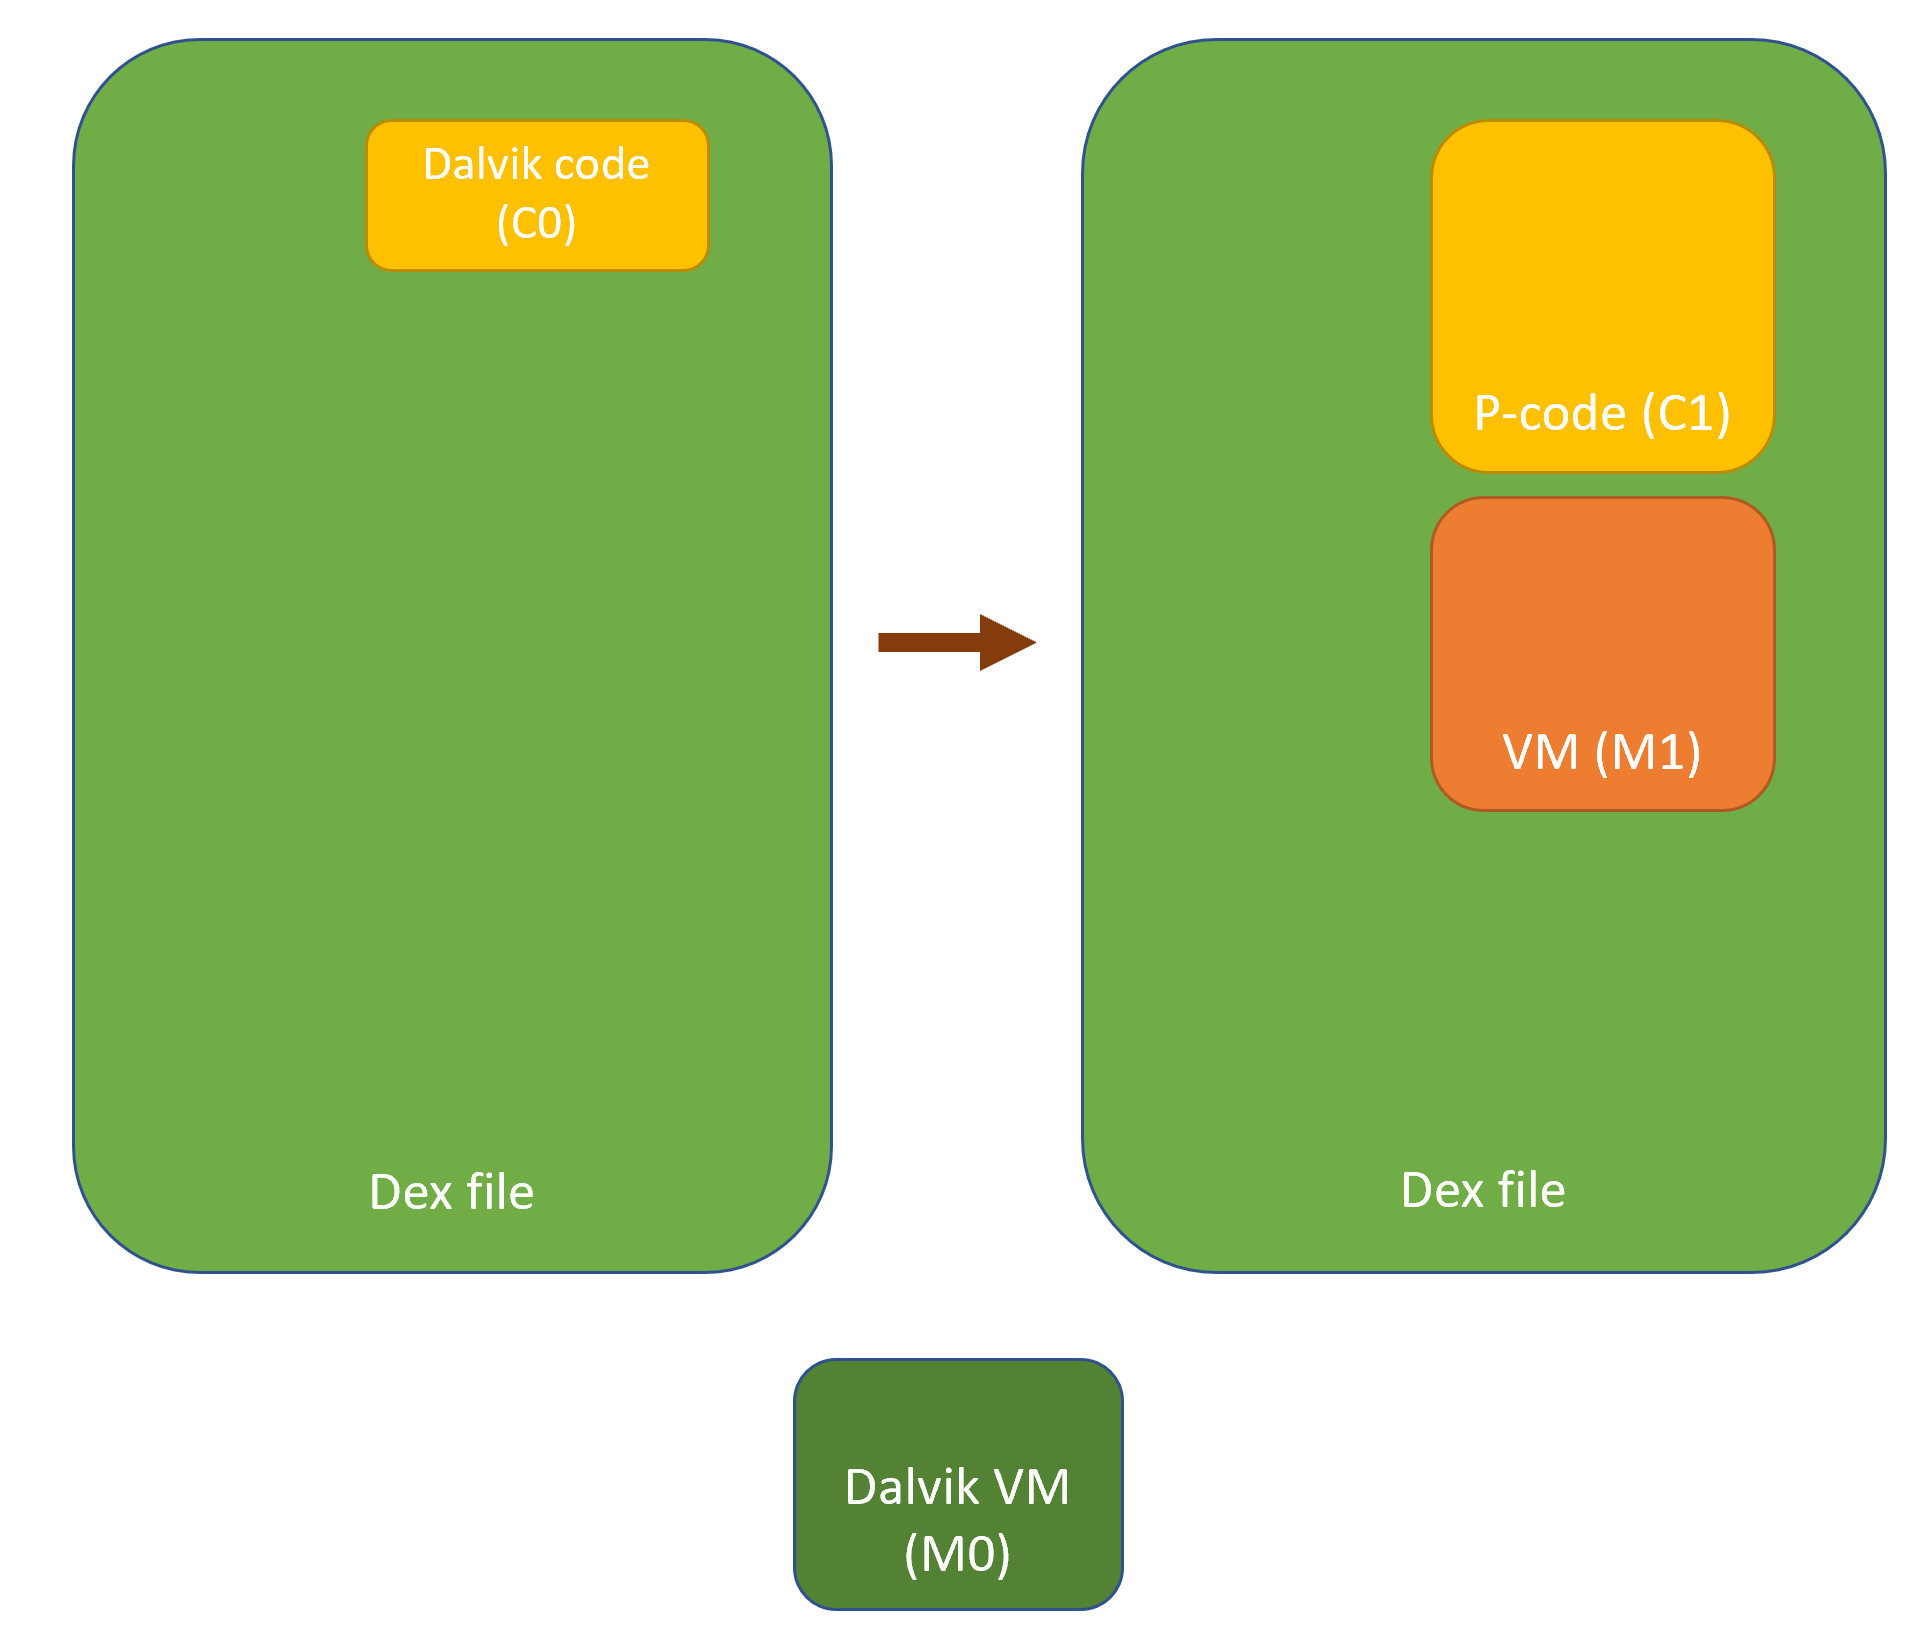
Virtualization in the context of code protection means:
- Generating a virtual machine M1
- Translating an original code object C0 meant to be executed on a machine M0 3, into a semantically-equivalent code object C1, to be run on M1.
While the general features of M1 are likely to be fixed (e.g., all generations of M1 are stack machines with such and such characteristics), the Instruction Set Architecture (ISA) of M1 may not necessarily be. For example, opcodes, microcodes and their implementation may vary from generation to generation. As for C1, the characteristics of a generation are only constrained by the capabilities of the converter. Needless to say, standard obfuscation techniques can be applied on C1. The virtualization process can possibly be recursive (C1 could be a VM implementing the specifications of a machine M2, executing a code object C2, emulating the original behavior of C0, etc.).
All in all, in practice, this makes M1 and C1 unique and hard to reverse-engineer.
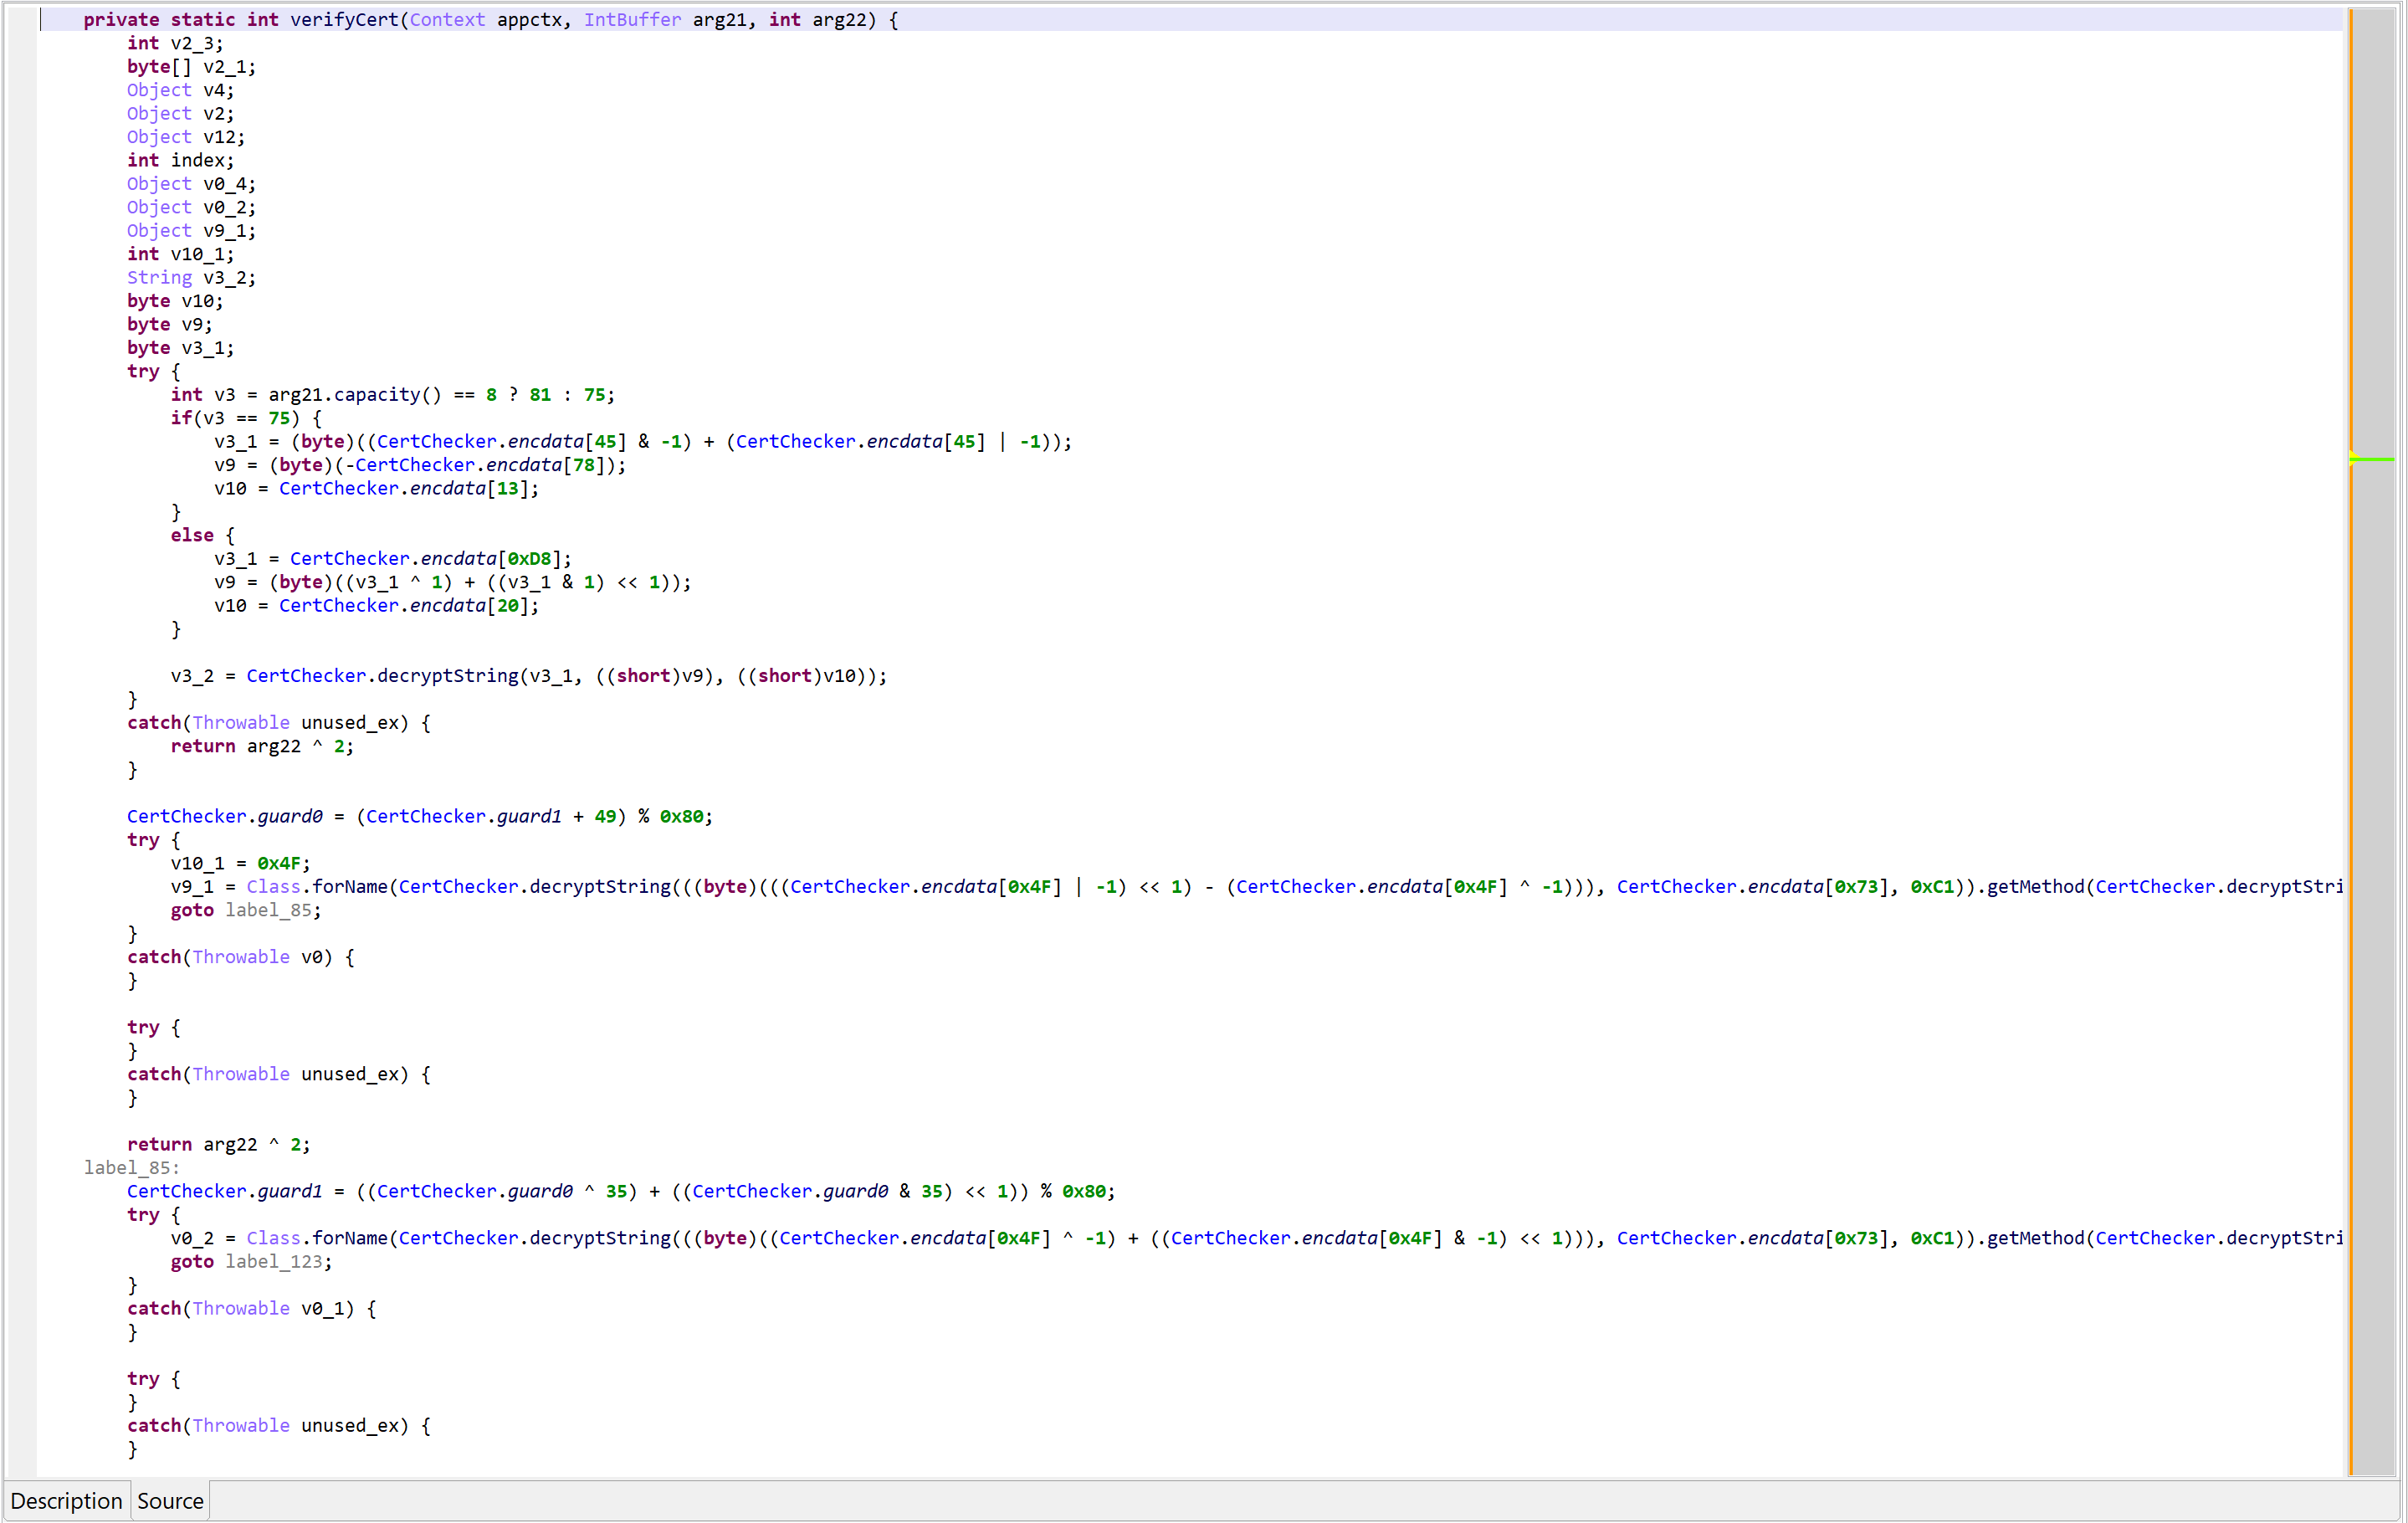
Example of a Protected Method
Note: all identifier names had been obfuscated. They were renamed for clarity and understanding.
Below, the class VClass was found to be “virtualized”. A virtualized class means that all non-constructor (all but <init>(*)V and <clinit>()V) methods were virtualized.
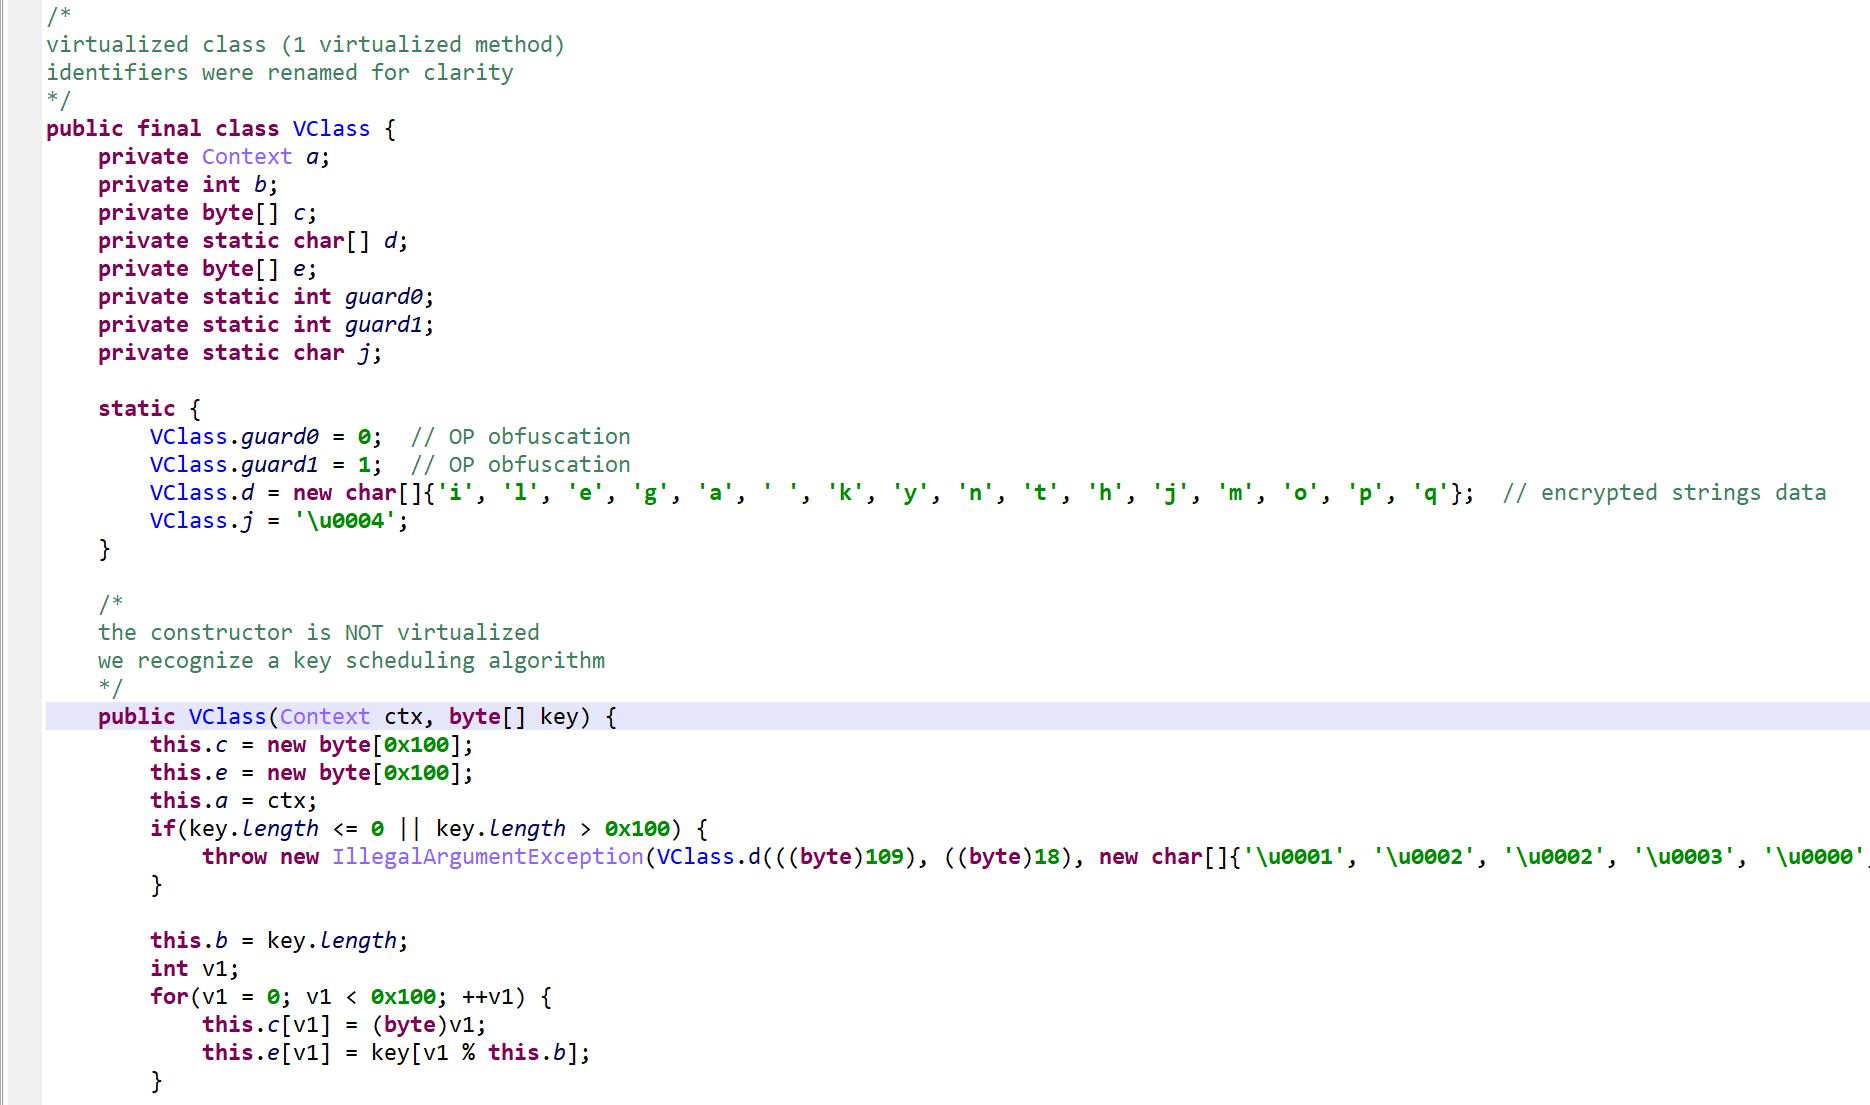
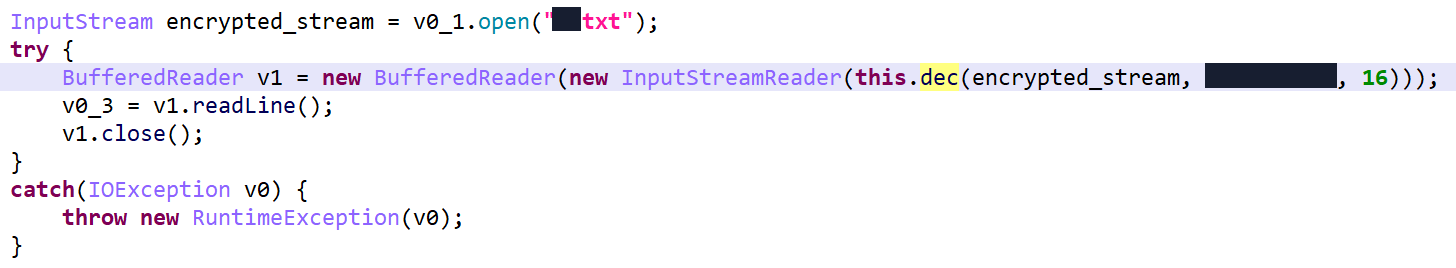
The method d(byte[])byte[] is virtualized:
- It was converted into an interpreter loop over two large switch constructs that branch on pseudo-code entries stored in the local array
pcode. - A
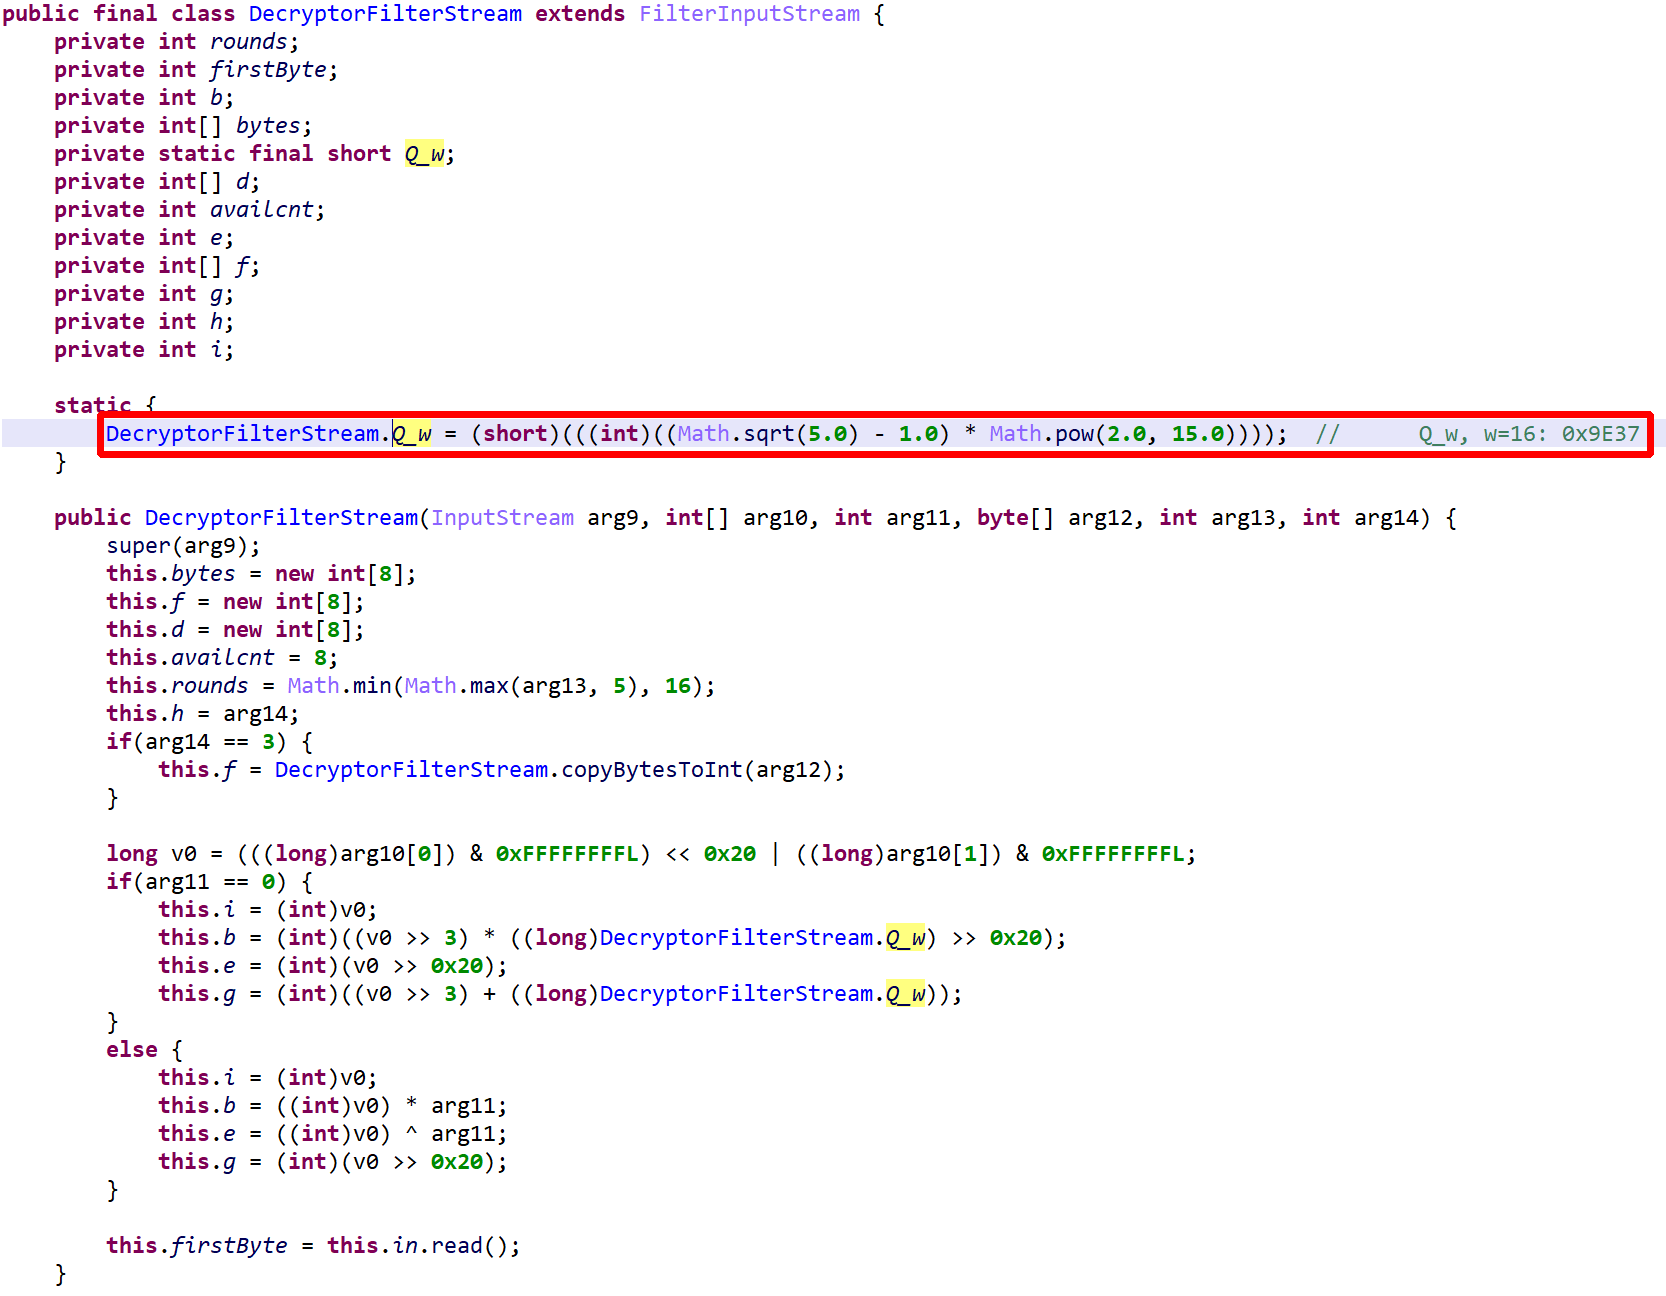
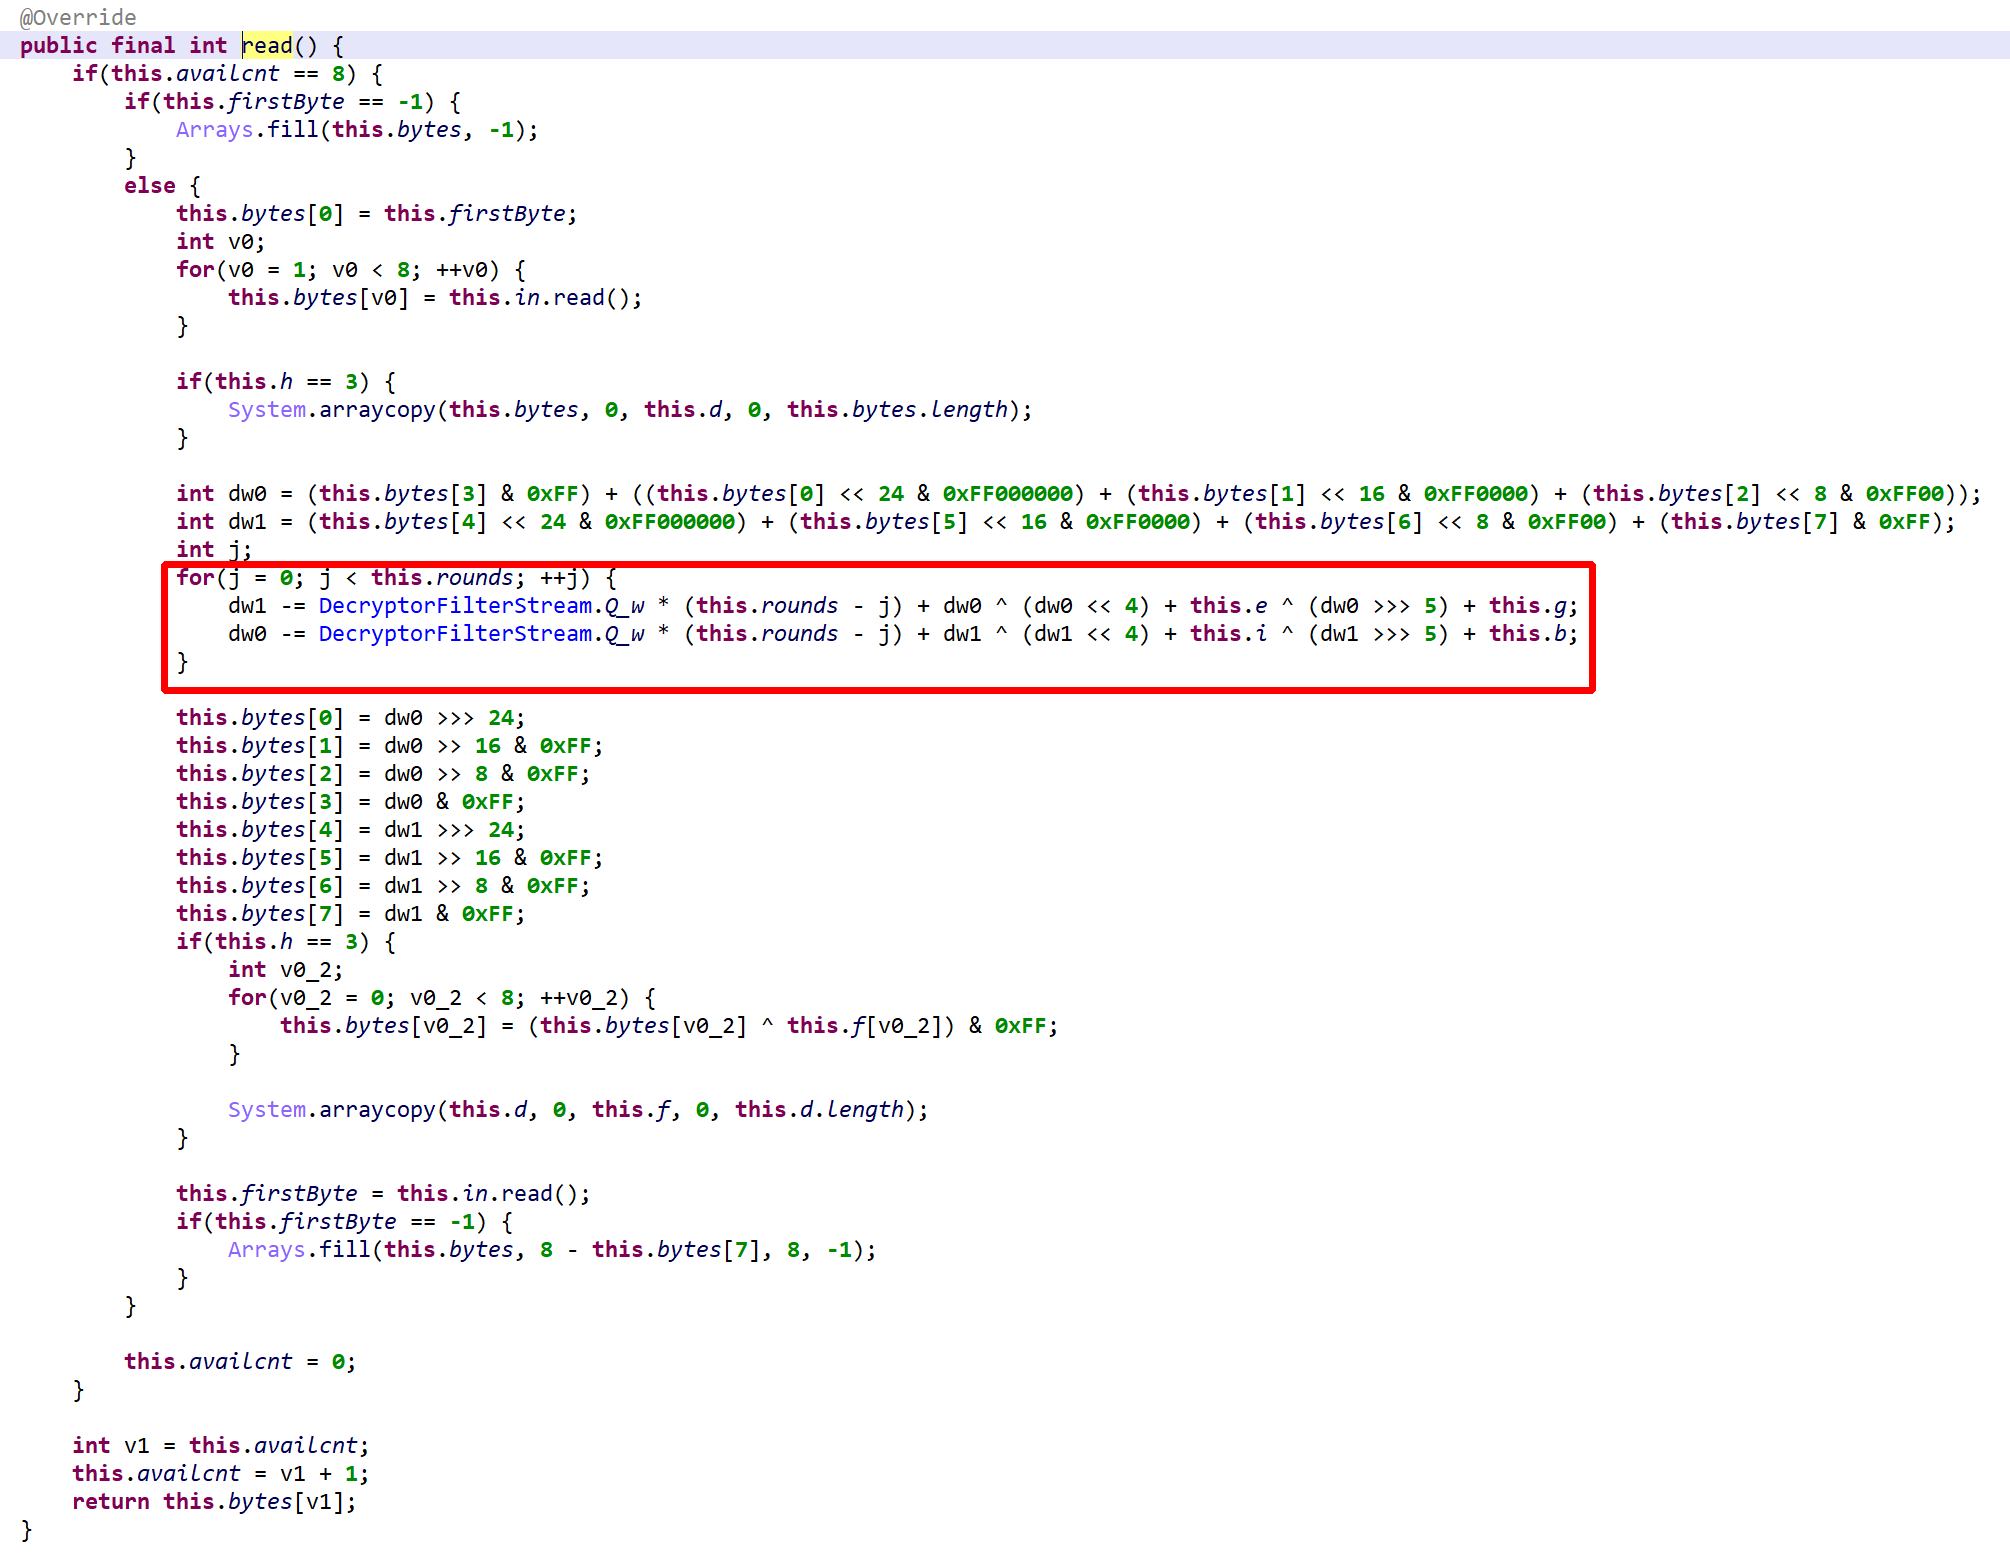
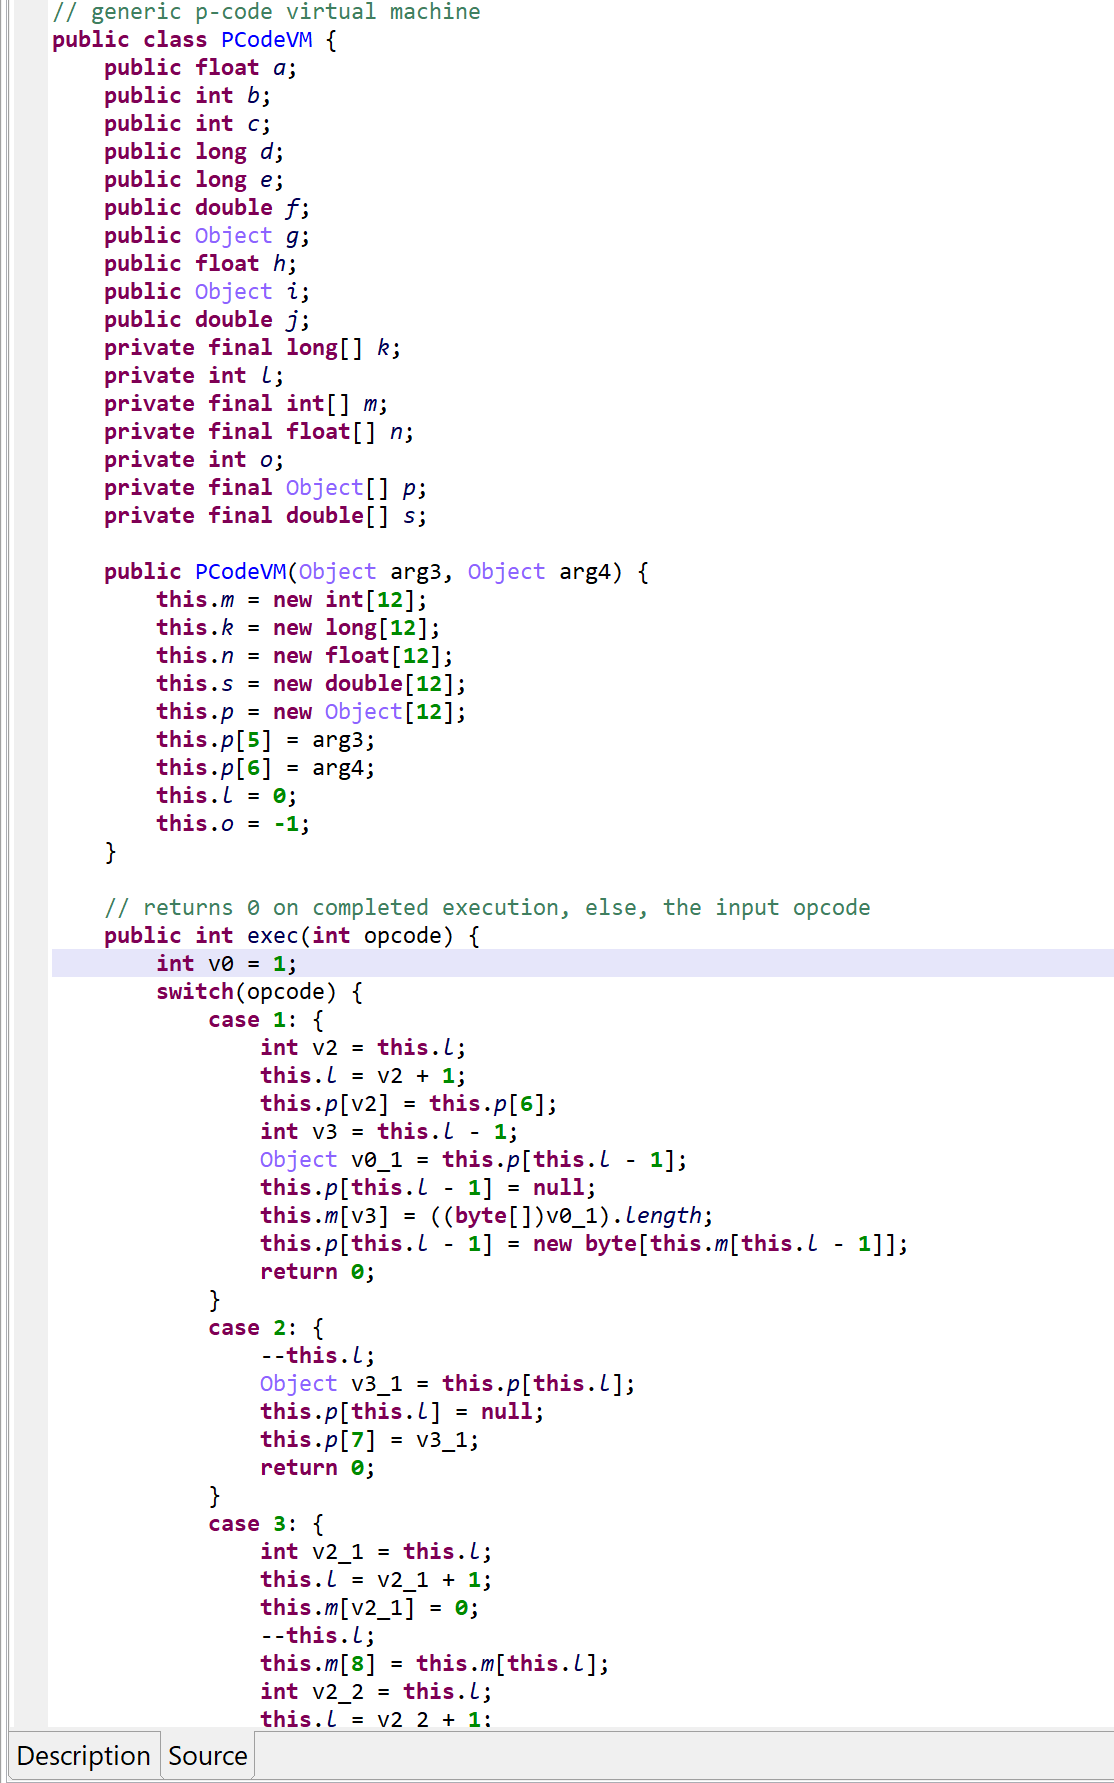
PCodeVMclass was added. It is a modified stack-based virtual machine (more below) that performs basic load/store operations, custom loads/stores, as well as some arithmetic, binary and logical operations.
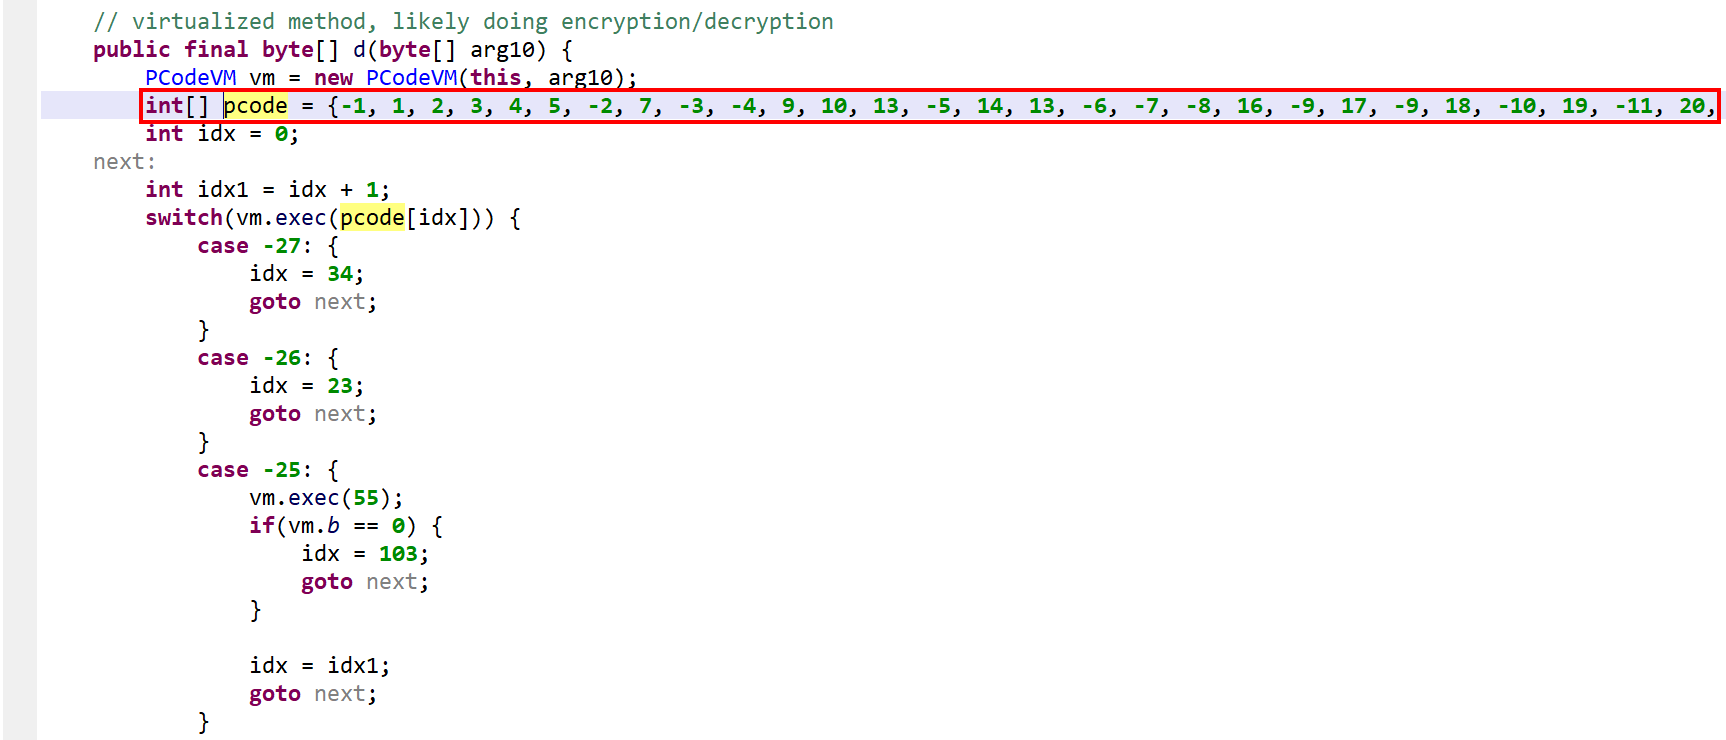
A snippet of the p-code VM class. Full code here, also contains the virtualized class.
vm.exec(opcode). Execution falls back to a second switch entry, in the virtualized method, if the operation was not handled.Please refer to the gist linked above for a full list of “generic” VM operations. Three examples, including one showing that the operations are not as generic as the term implies:


As said, negative opcodes represent custom operations specific to a virtualized method, including control flow changes. An example:
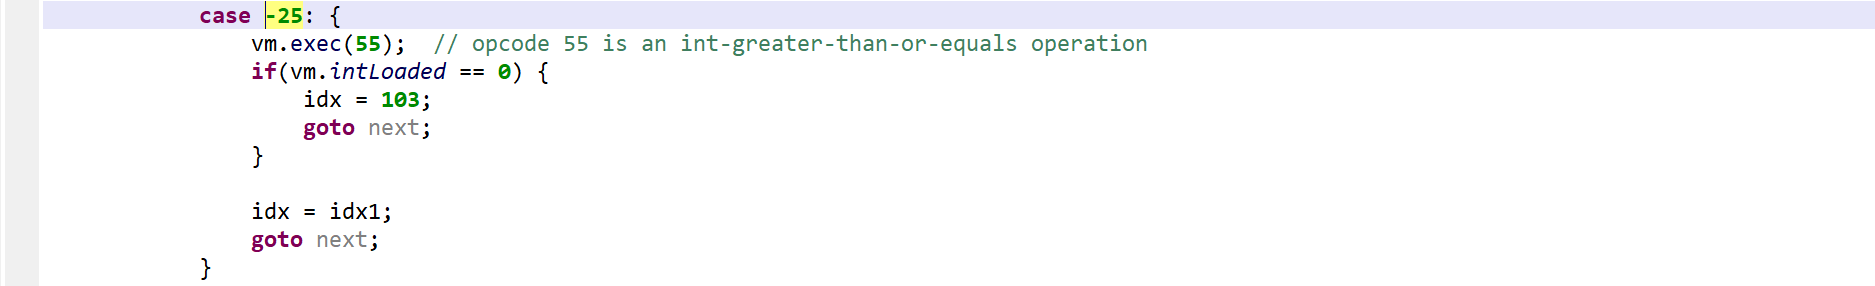
if(a >=b) goto LABEL operation (first, call into opcode 55 to do a GE operation on the top two integers; then, use the result to do conditional branching)Characteristics of the P-code VM
From the analysis of that code as well as virtualized methods found in other binaries, the characteristics of the p-code VM generated by the app protector can be inferred:
- The VM is a hybrid stack machine that uses 5 parallel stacks of the same height, stored in arrays of:
- java.lang.Object (accommodating all objects, including arrays)
- int (accommodating all small integers, including boolean and char)
- long
- float
- double
- For each one of the 5 stack types above, the VM uses two additional registers for storing and loading
- Two stack pointers are used: one indicates the stack TOP, the other one seems to be used more liberally, and is akin to a peek register
- The stack has a reserved area to store the virtualized method parameters (including
thisif the method is non-static) - The ISA encoding is trivial: each instruction is exactly one-word long, it is the opcode of the p-code instruction to be executed. There is no concept of register, index, or immediate value embedded into the instruction, as most stack machine ISA’s have.
- Because the ISA is so simple, the implementation of the semantics of an instruction falls almost entirely on the p-code handler. For this reason, they were grouped into two categories:
- Semi-generic VM operations (load/store, arithmetic, binary, tests) are handled by the VM class and have a positive id. (A VM object is used by every virtualized method in a virtualized class.)
- Operations specific to a given virtualized method (e.g., method invocations) use negative ids and are handled within the virtualized method itself.
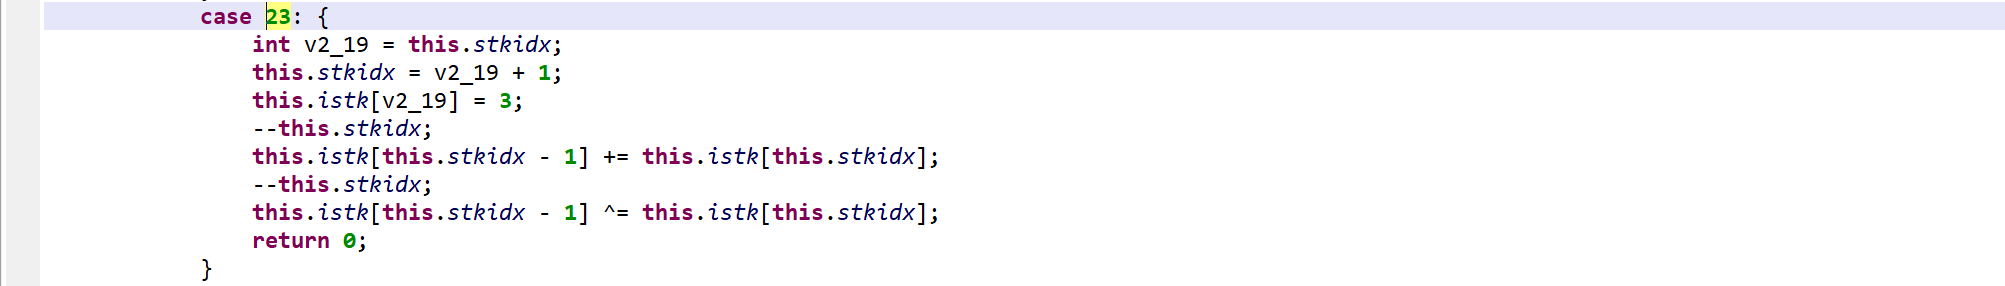
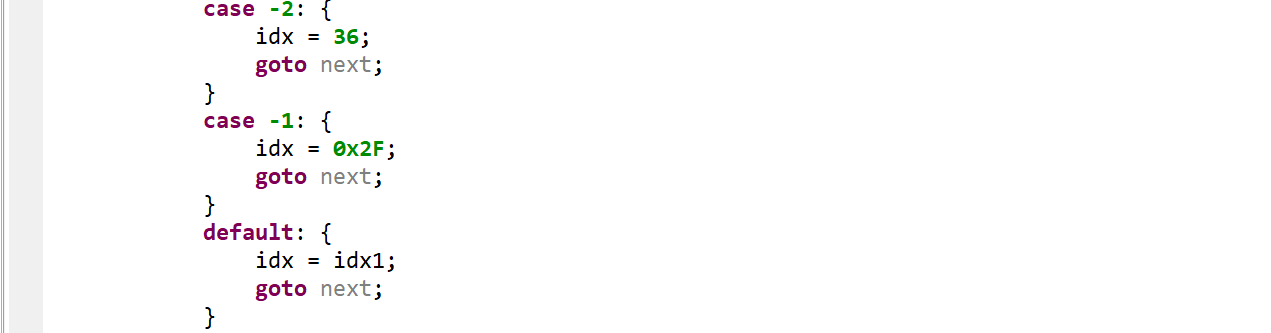
P-code obfuscation: junk insertion, spaghetti code
While the PCodeVM opcodes are all “useful”, many specific opcodes of a virtualized method (negative ids) achieve nothing but the execution of code semantically equivalent to NOP or GOTO.
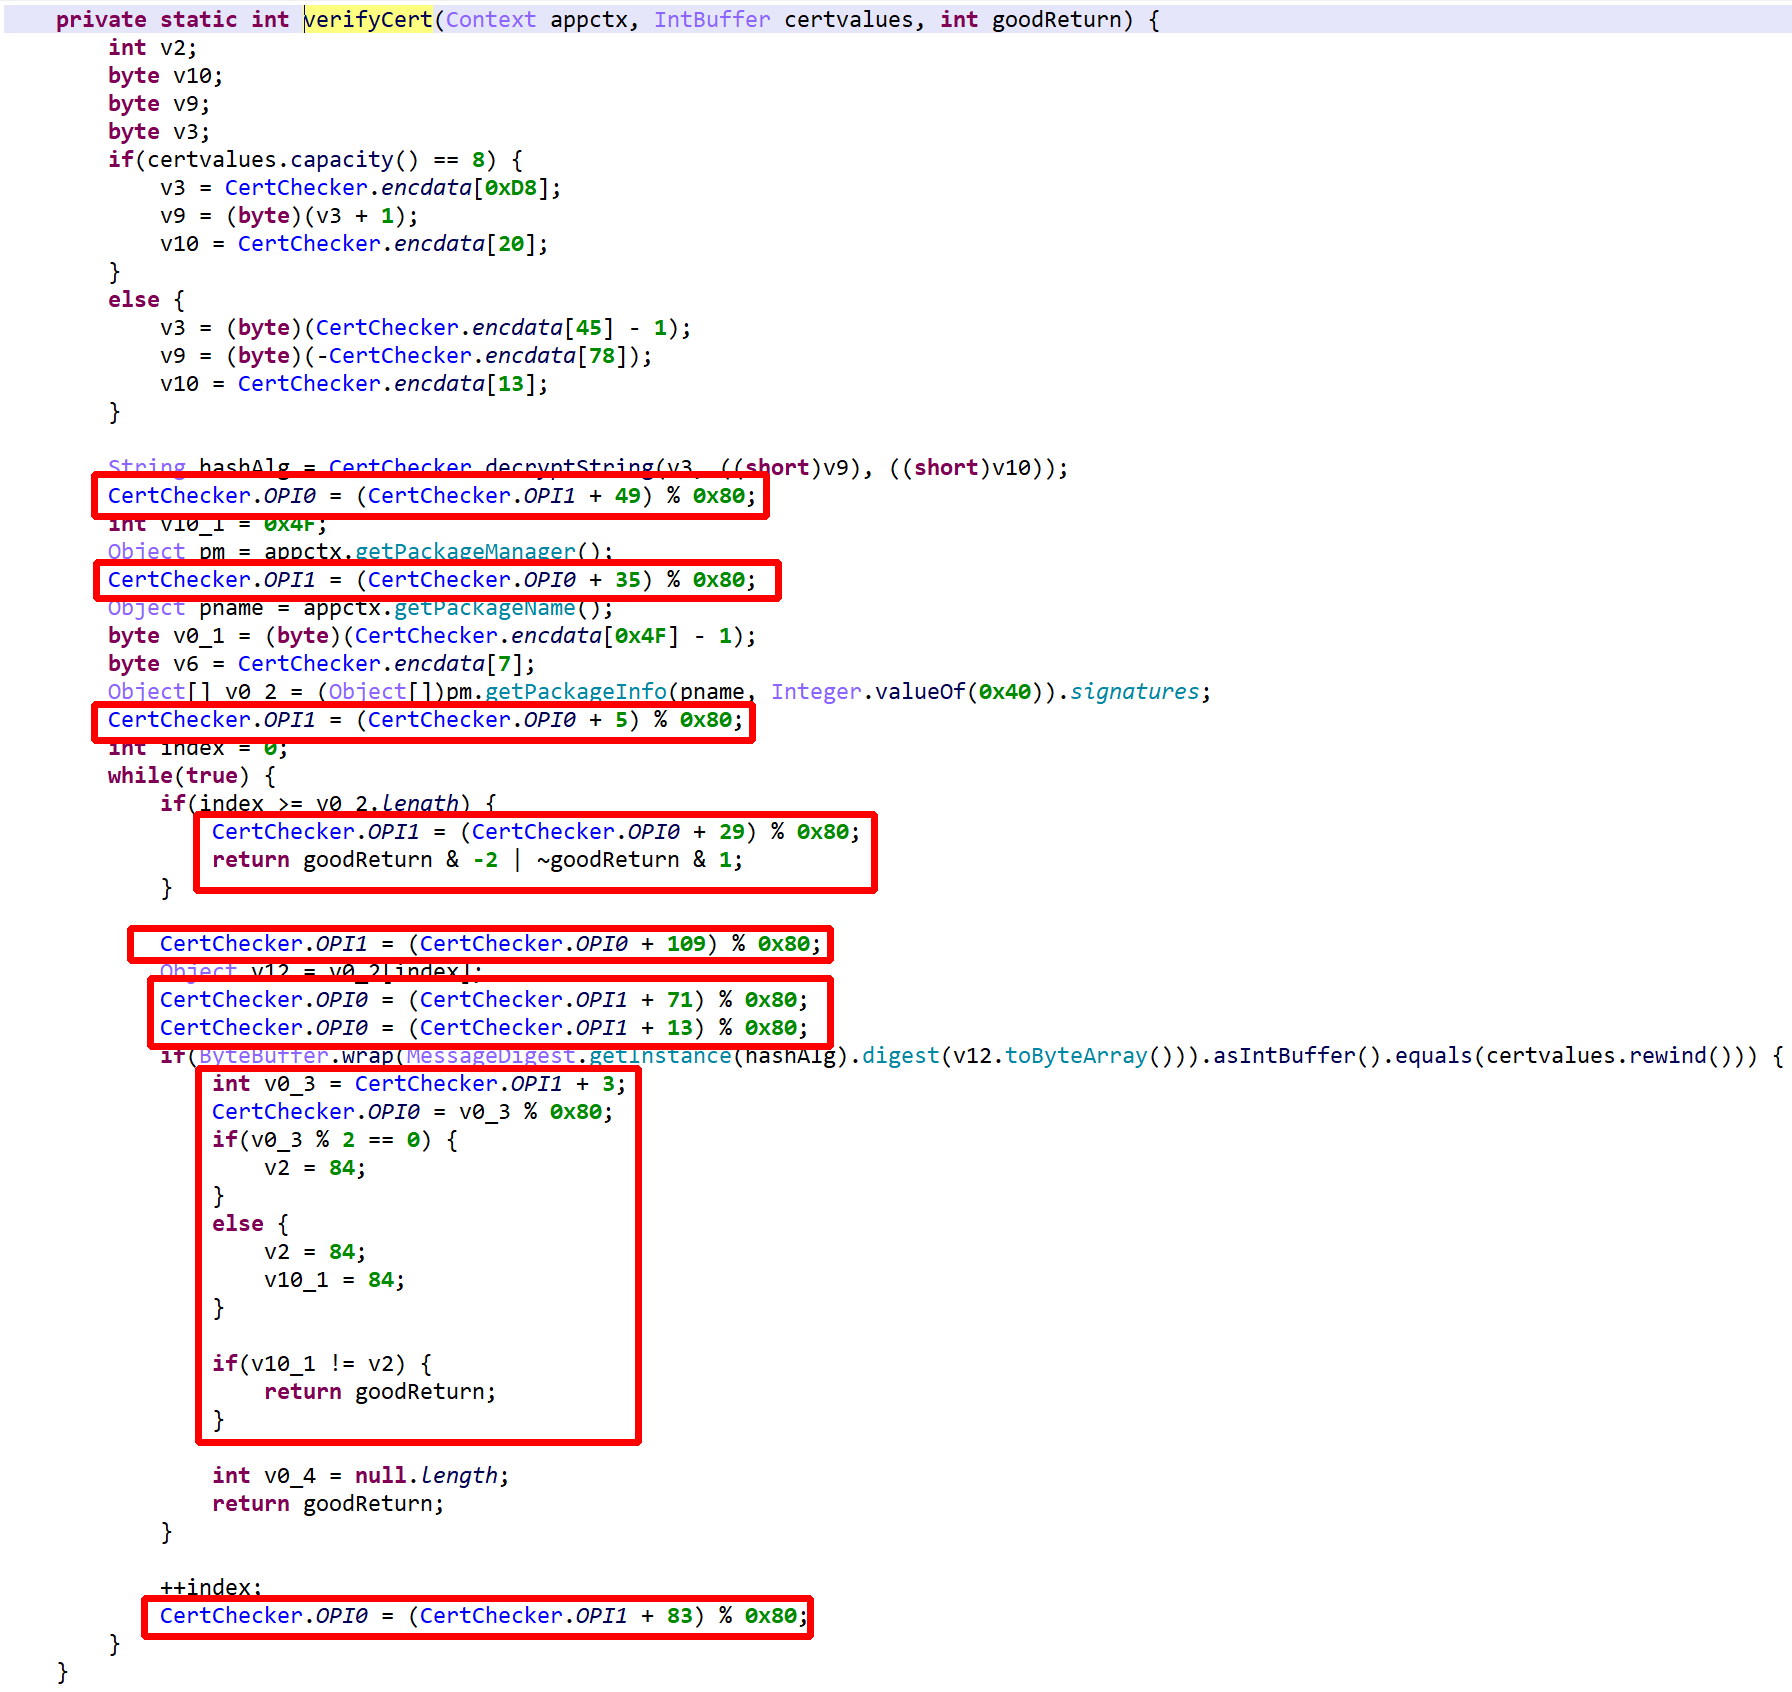
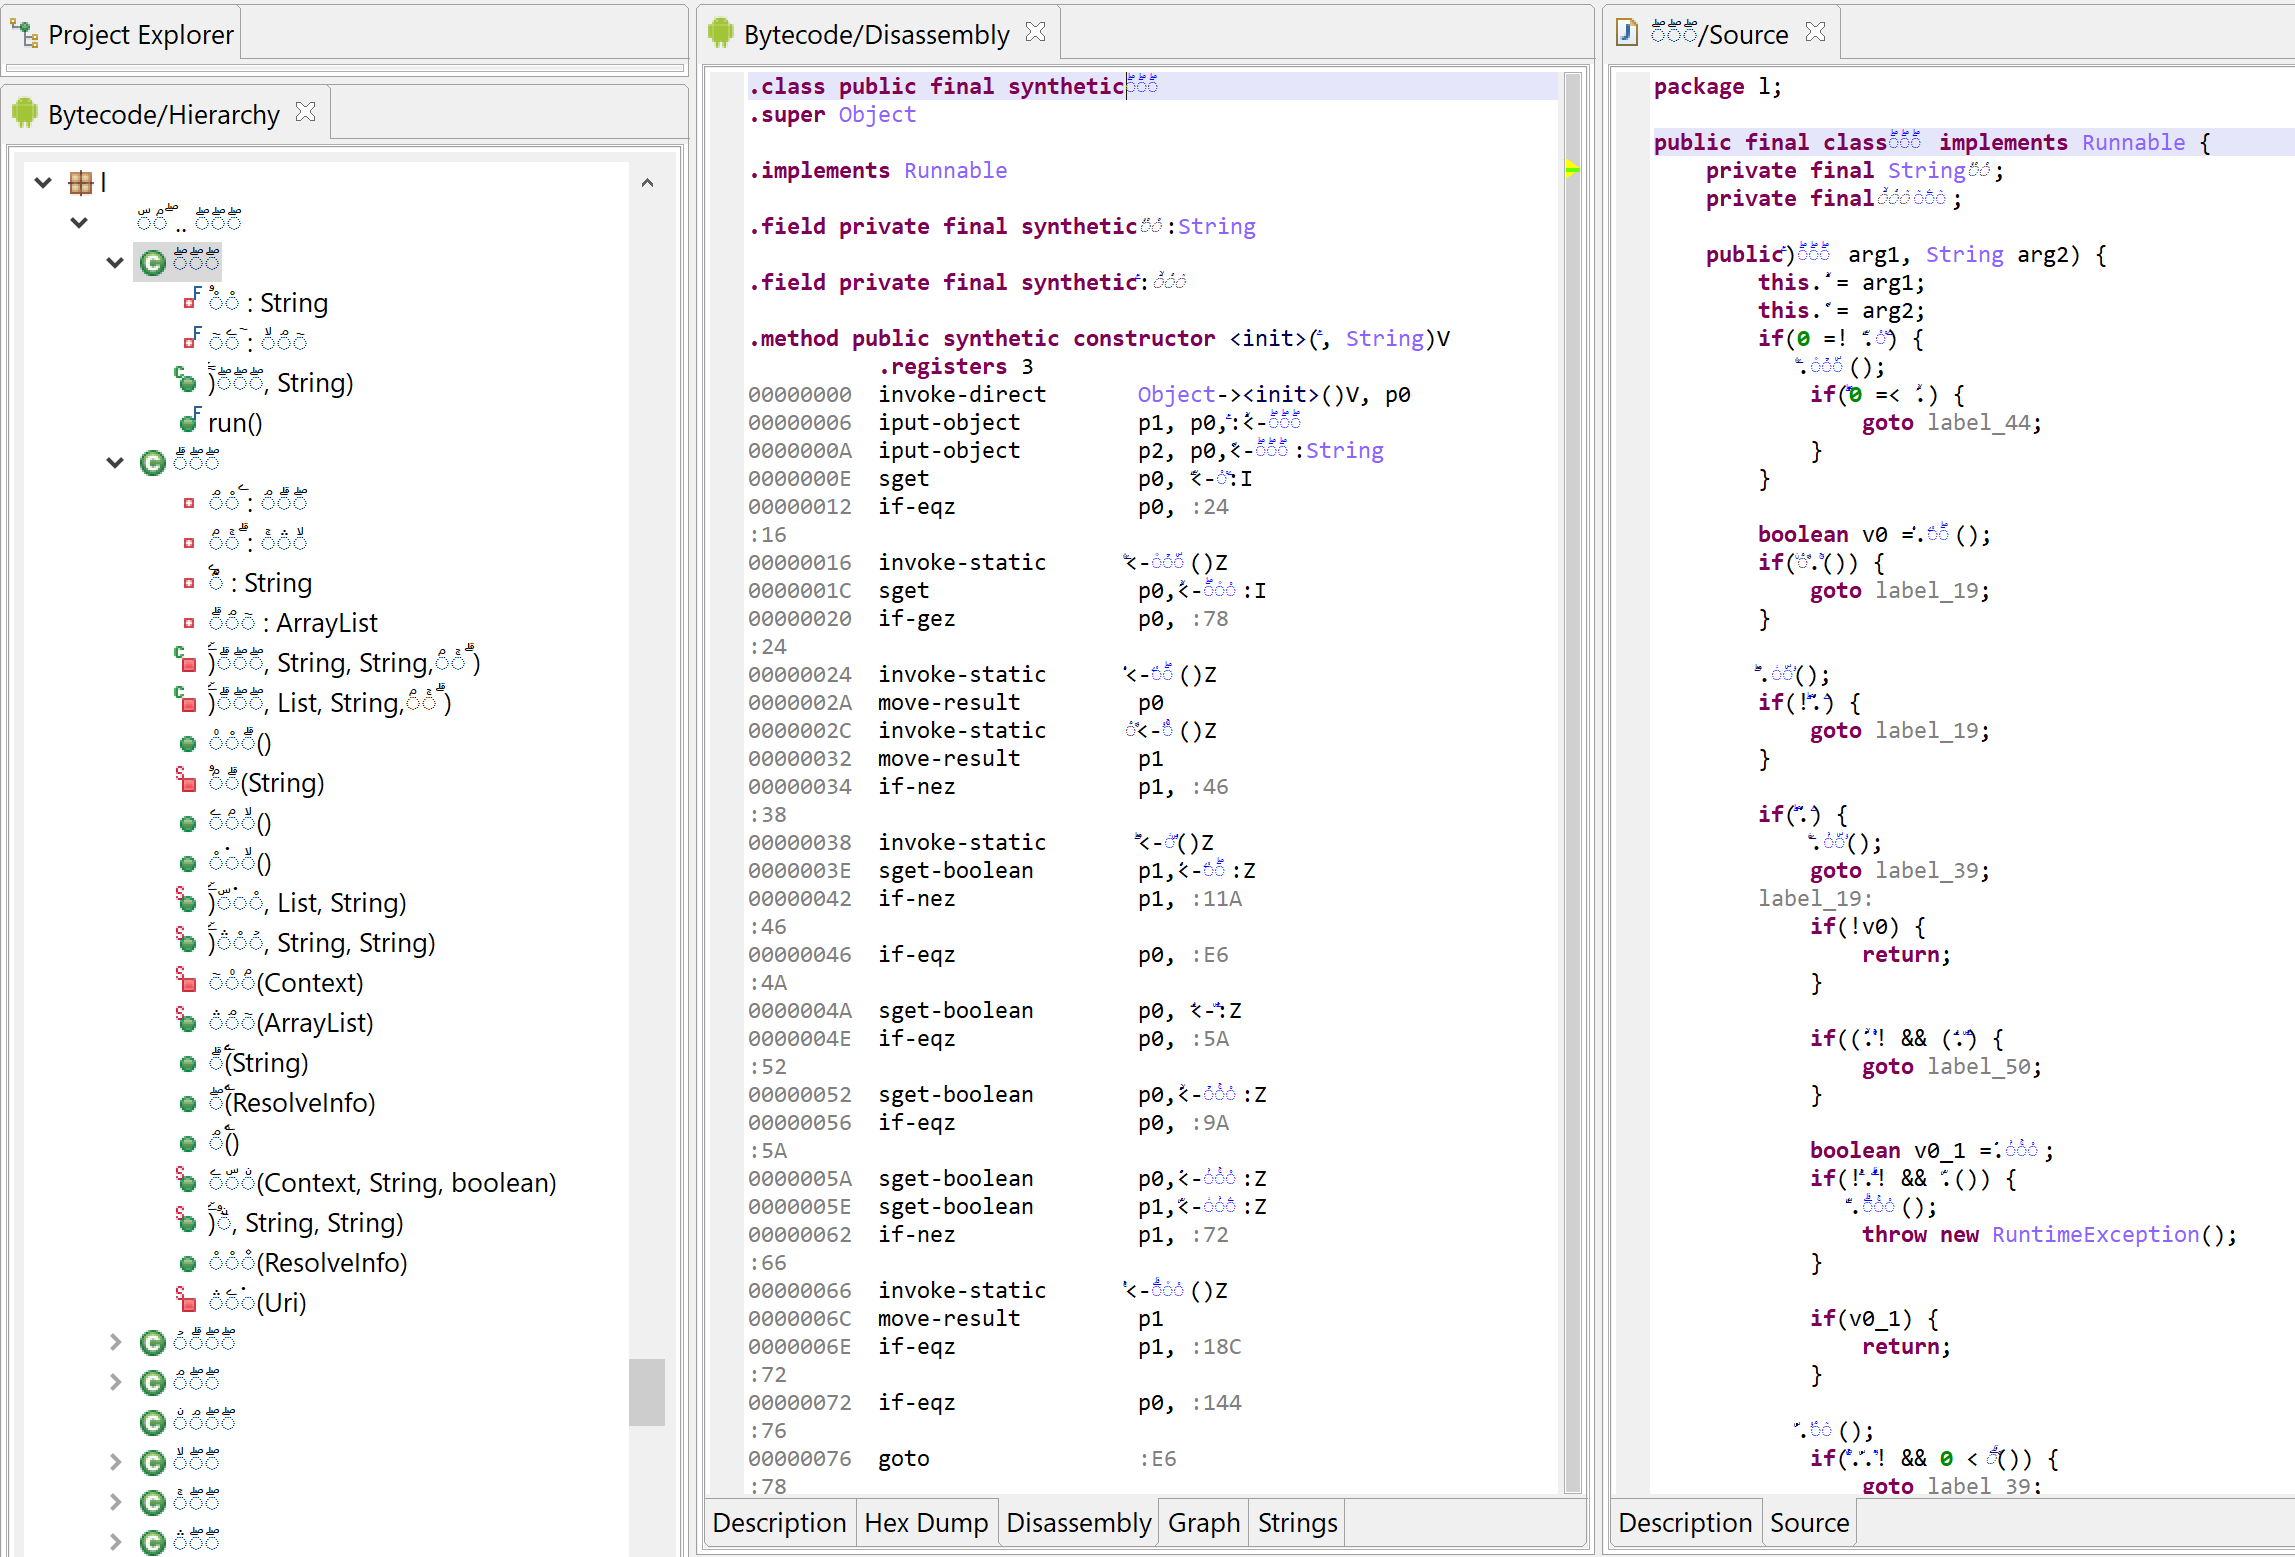
Rebuilding Virtualized Methods
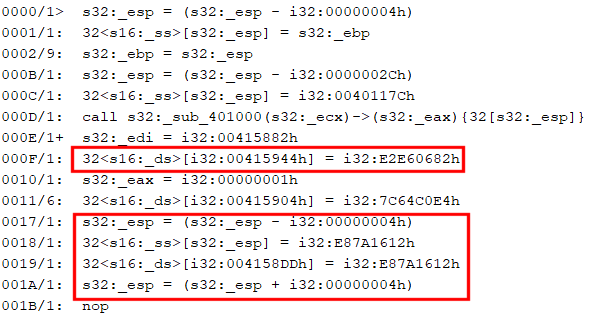
Below, we explain the process used to rebuild a virtualized method. The CFG’s presented are IR-CFG’s (Intermediate Representations) used by the dexdec 4 pipeline. Note that unlike gendec‘s IR 5, dexdec‘s IR is not exposed publicly, but its textual representation is mostly self-explanatory.
Overall, a virtualized routine, once processed by dexdec like any other routine, looks like the following: A loop over p-code entries (stored in x8 below), processed by a() at 0xE first, or by the large routine switch.

The routine a() is PCodeVM.exec(), and its optimized IR boils down to a large single switch. 6

The unvirtualizer needs to identify key items in order to get started, such as the p-code entries, identifiers used as indices into the p-code array, etc. Once they have been gathered, concolic execution of the virtualized routine becomes possible, and allows rebuilding a raw version of the original execution flow. Multiple caveats need to be taken care of, such as p-code inlining, branching, or flow termination. In its current state, the unvirtualizer disregards exceptional control flow.
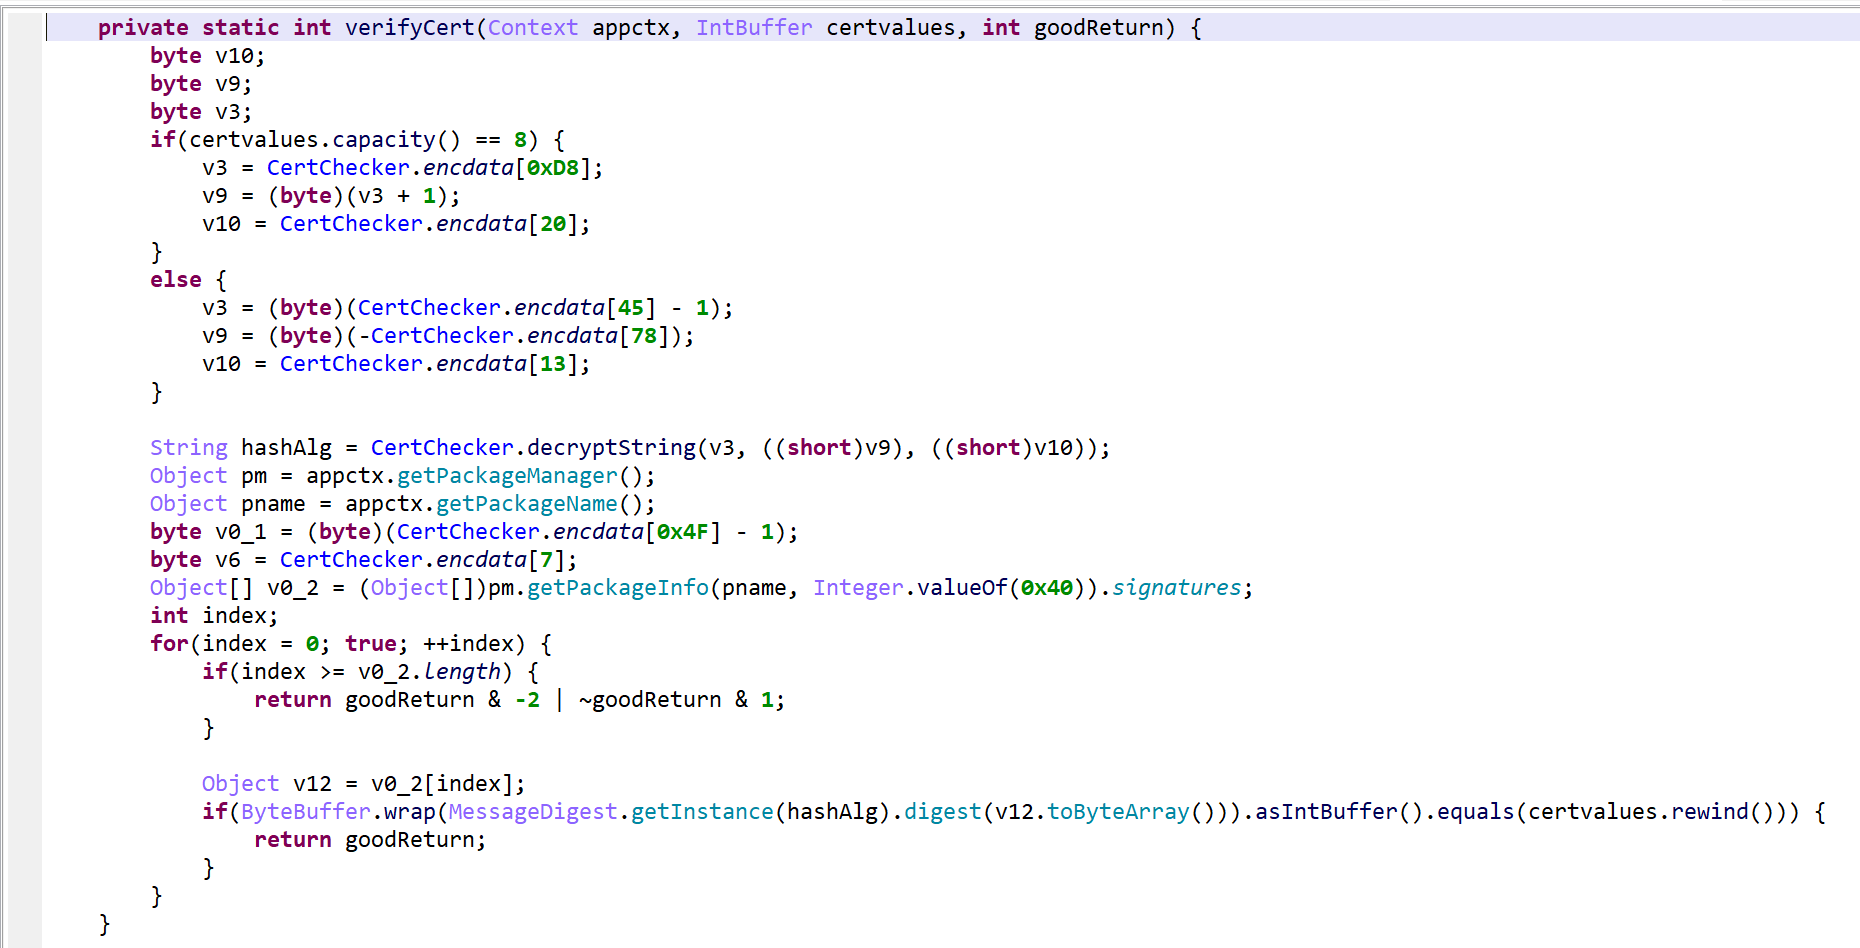
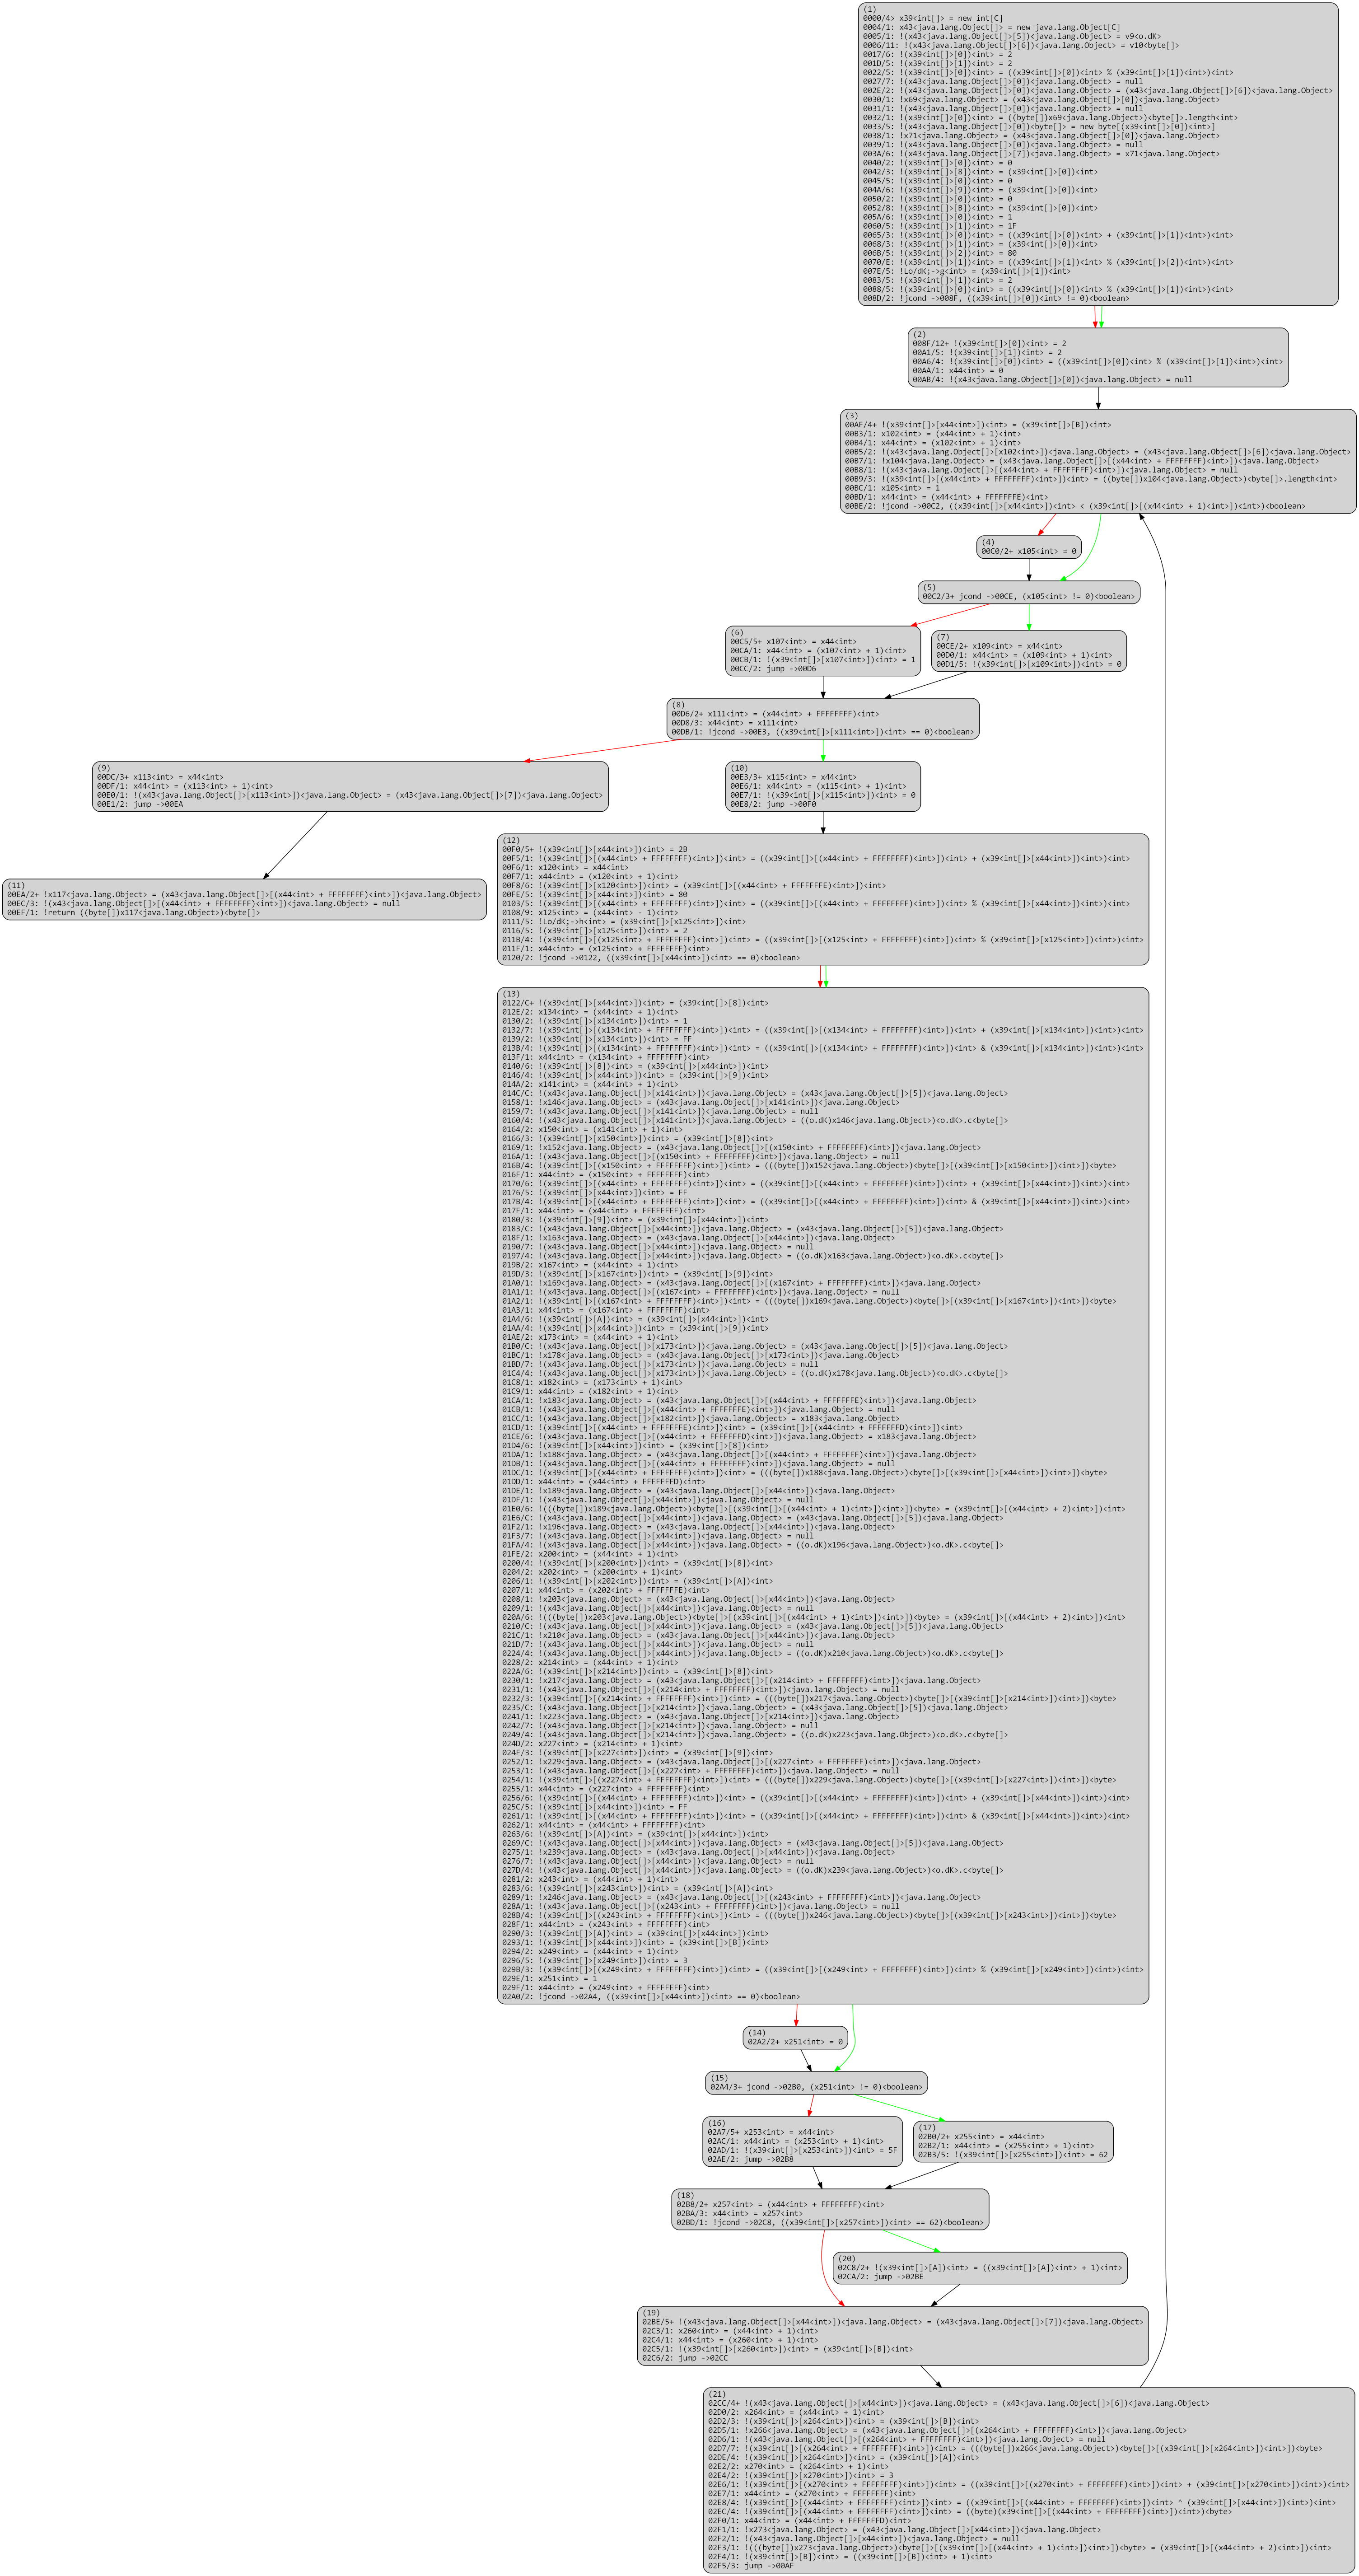
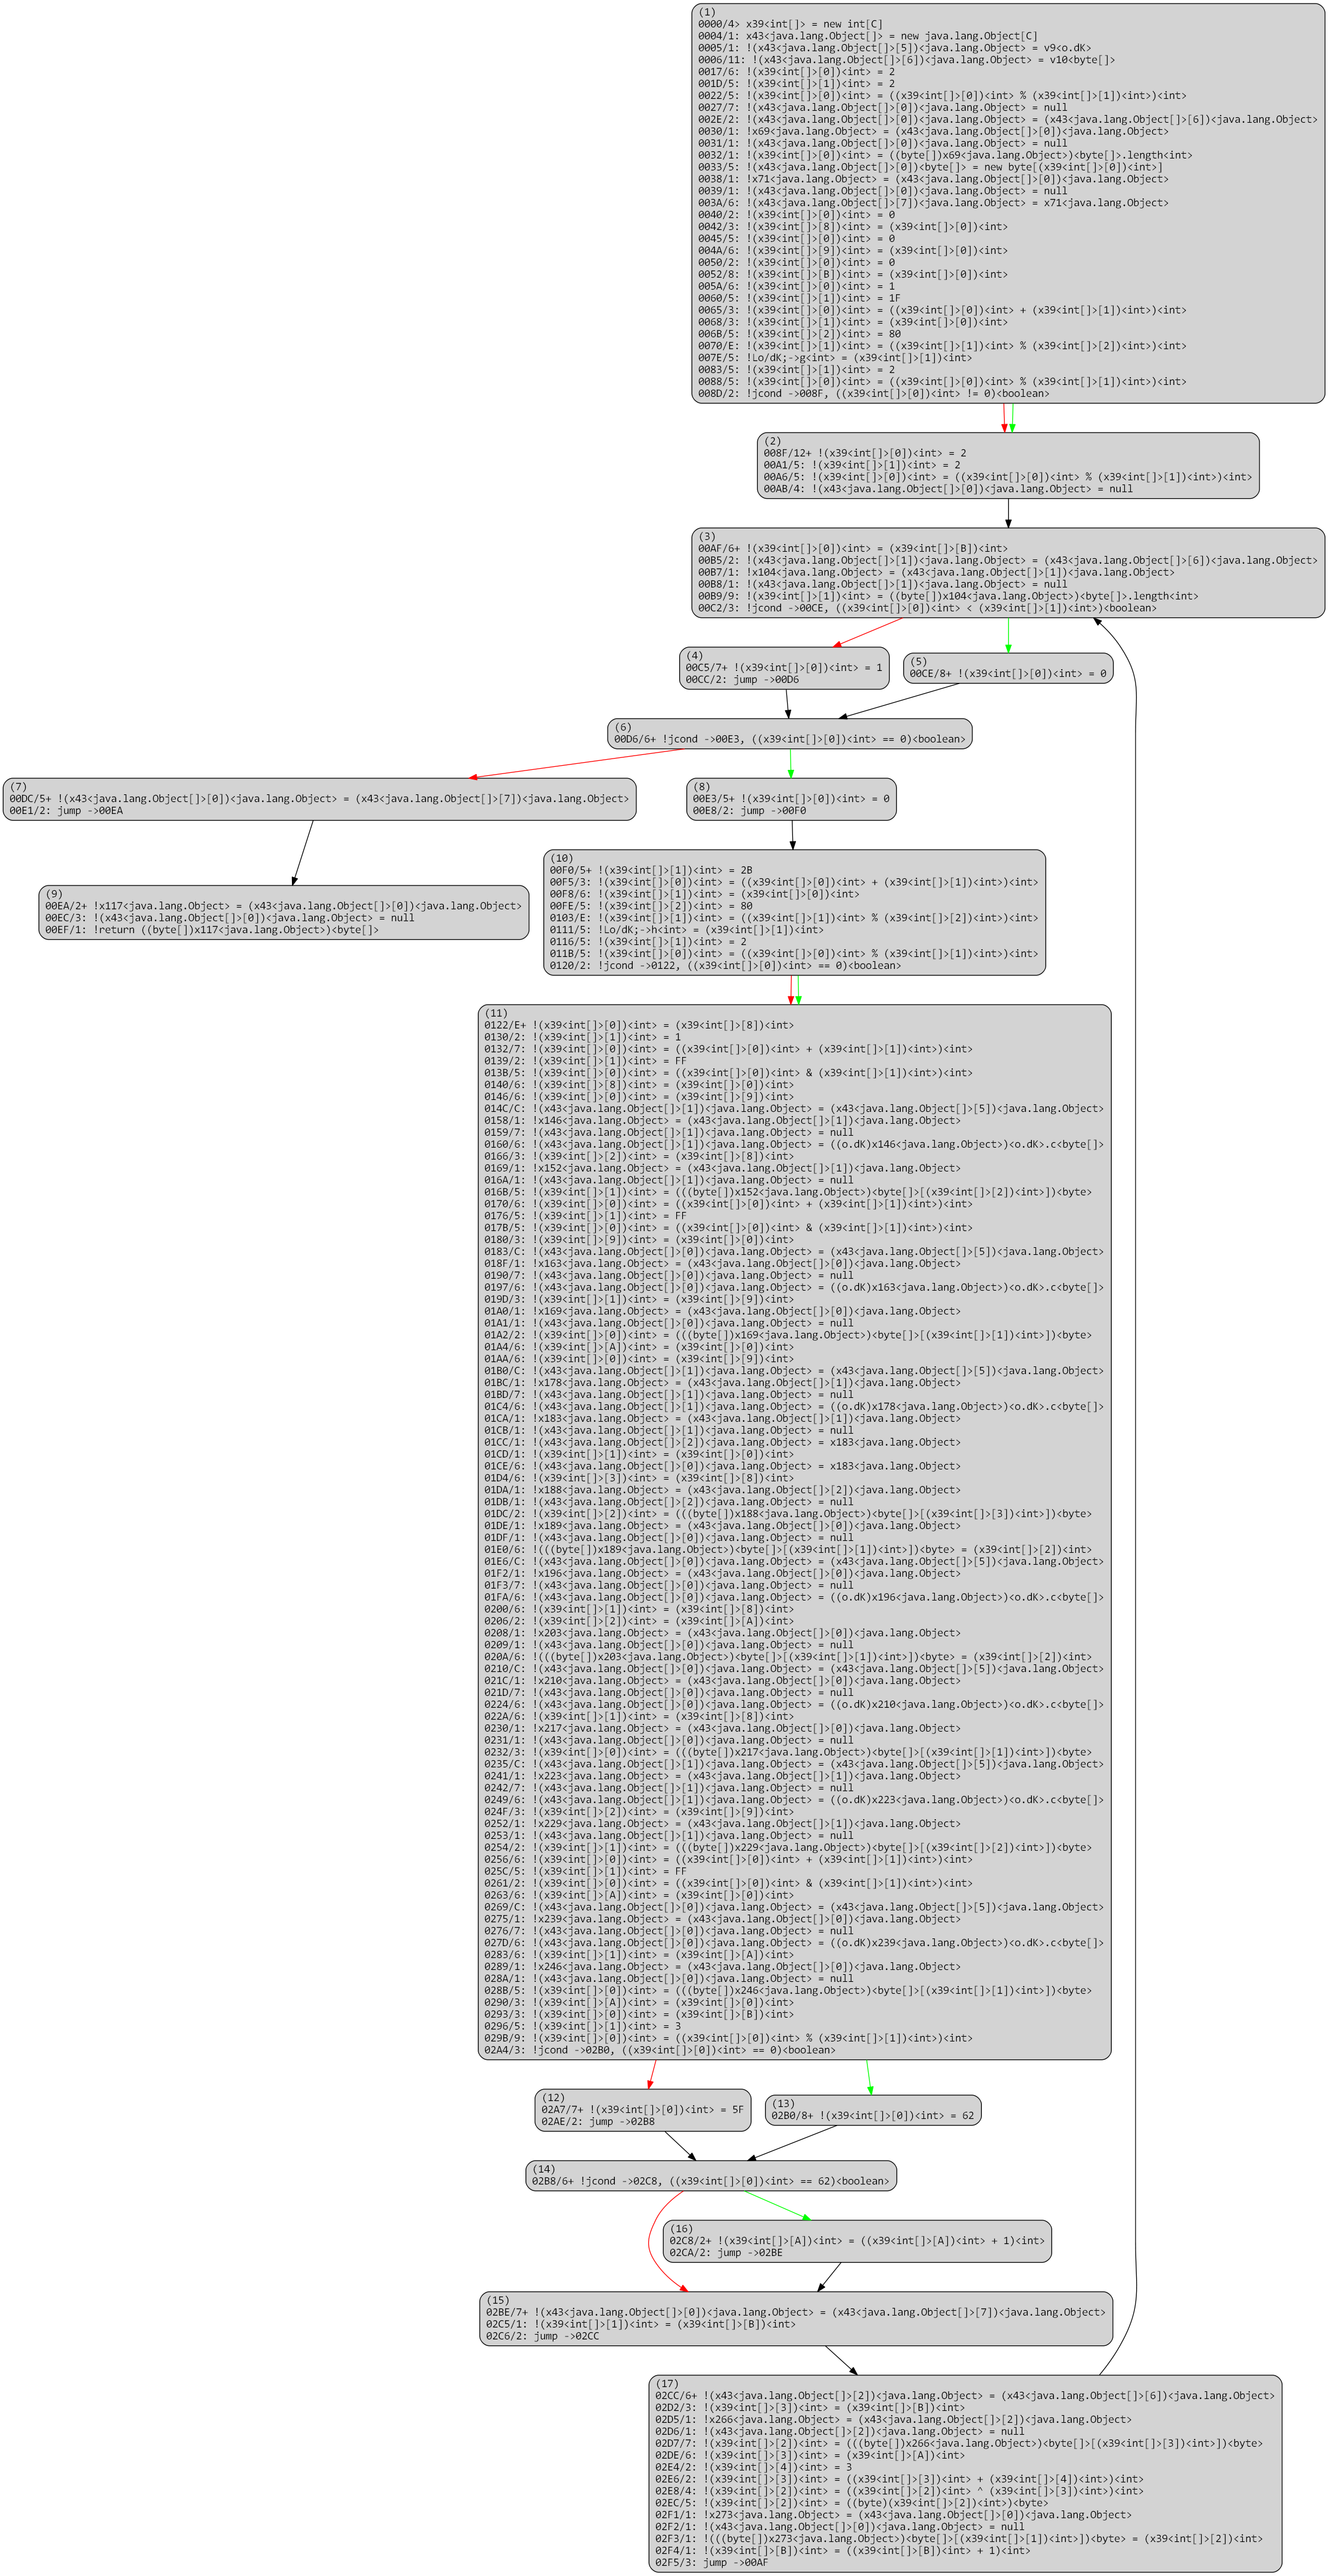
Below, a raw version of the unflattened CFG. Note that all operations are stack-based; the code itself has not been modified at this point, it still consists of VM stack-based operations.

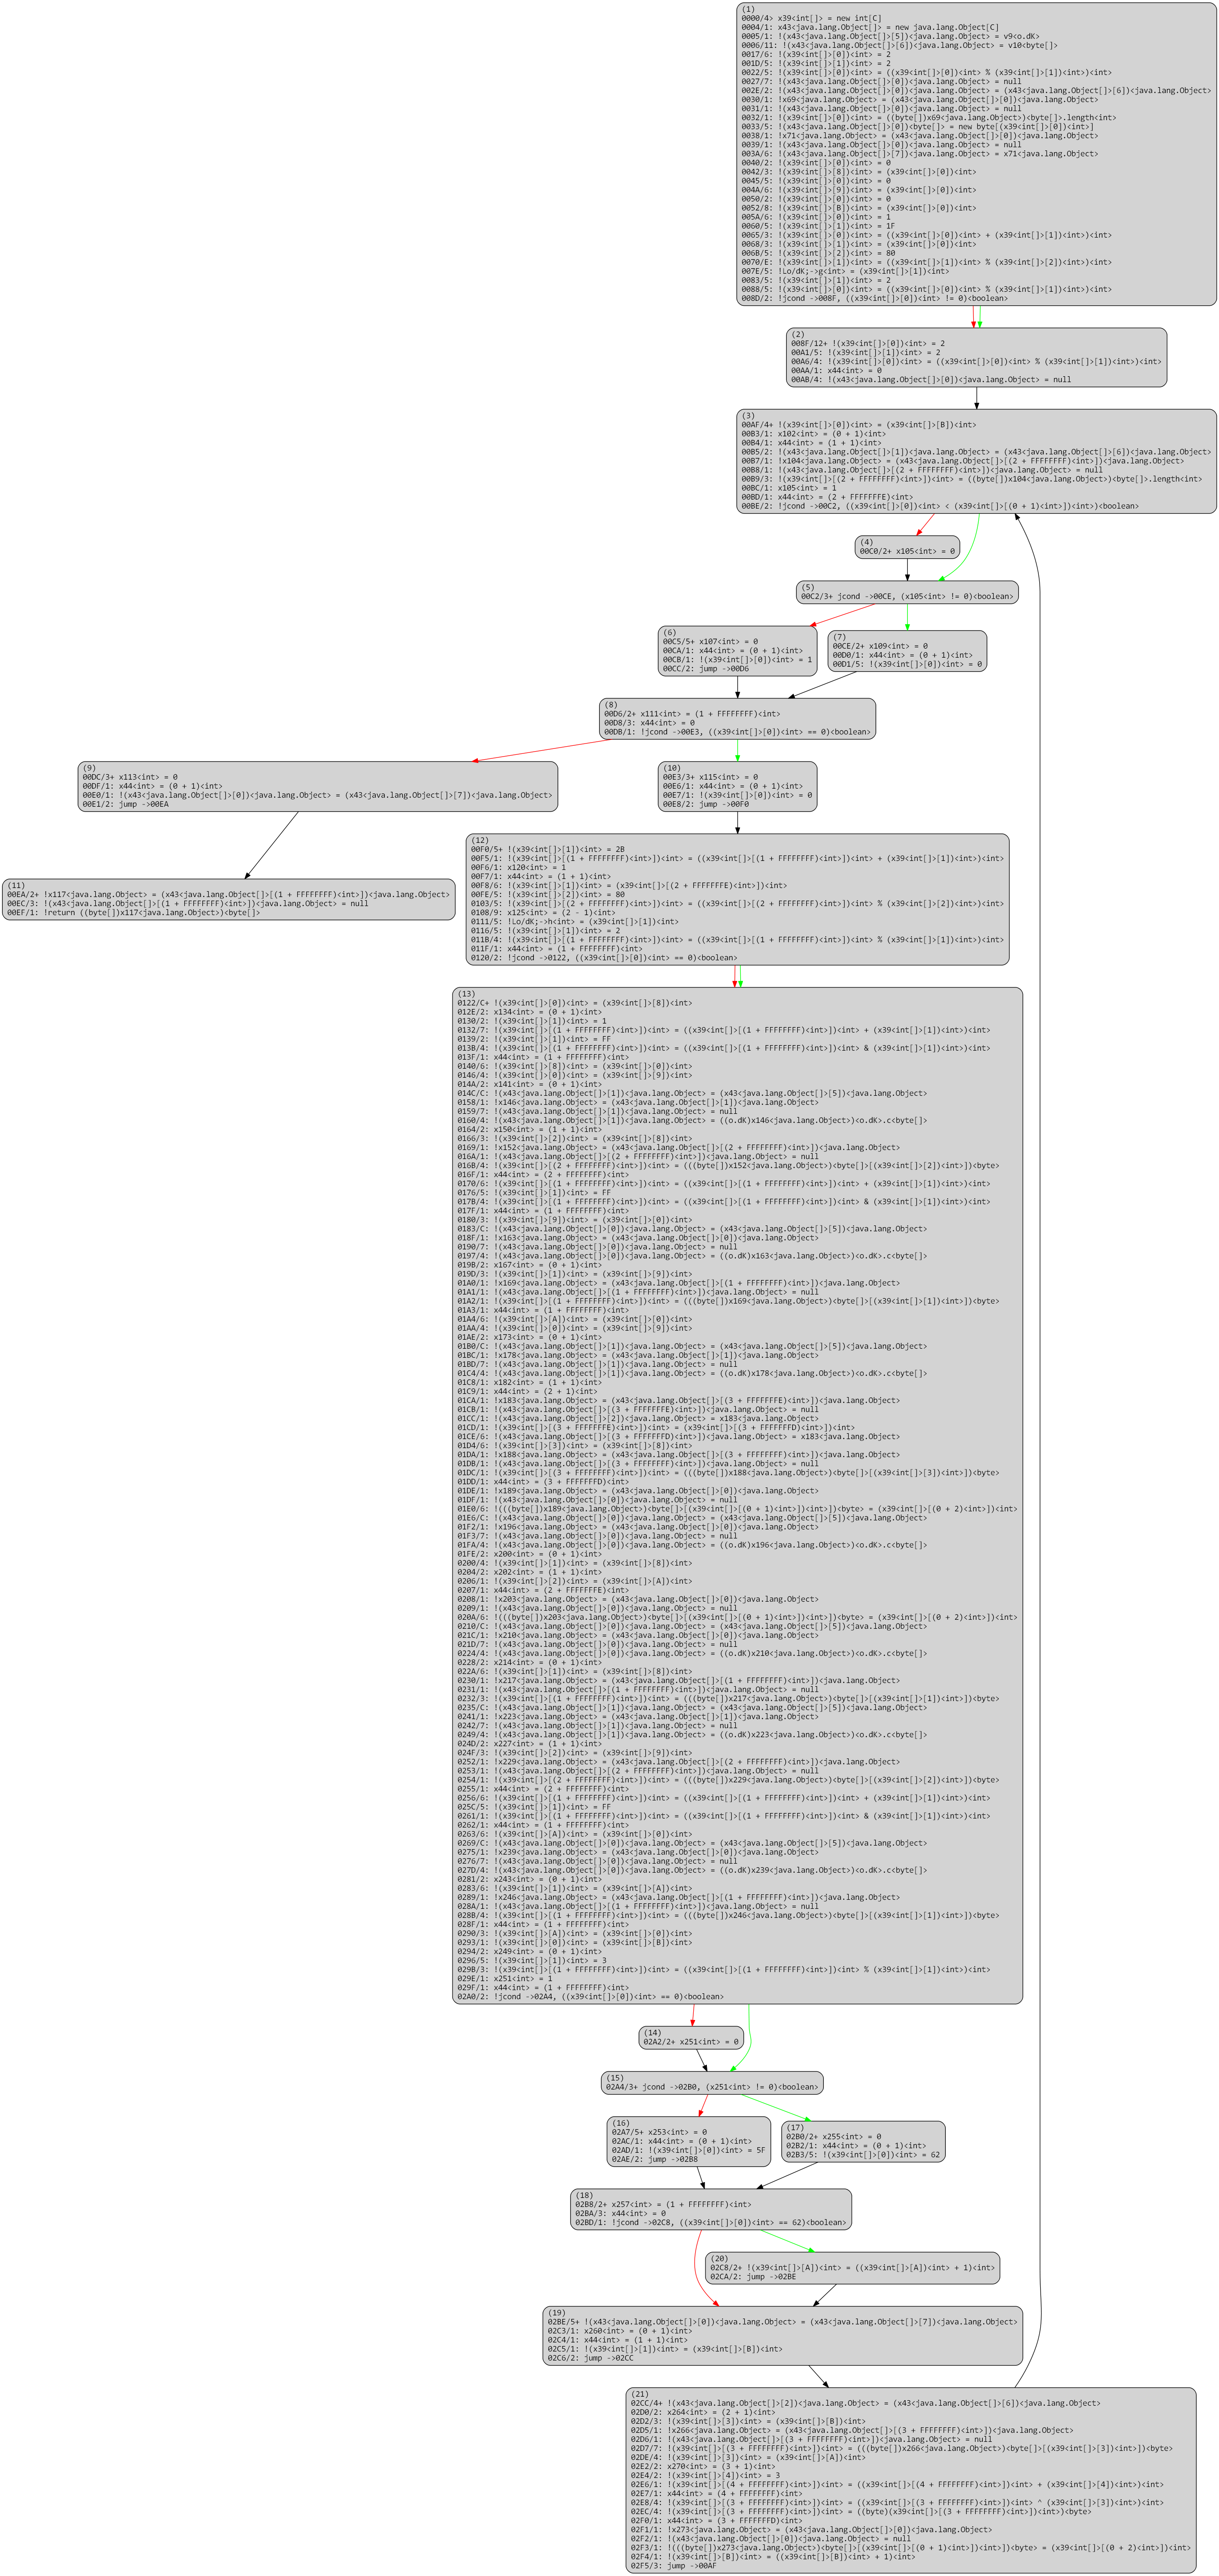
dexdec’s standard IR optimization passes (dead-code removal, constant and variable propagation, folding, arithmetic simplification, flow simplifications, etc.) clean up the code substantially:
At this stage, all operations are stack-based. The high-level code generated from the above would be quite unwieldy and difficult to analyze, although substantially better than the original double-switch.
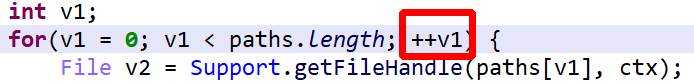
The next stage is to analyze stack-based operations to recover stack slots uses and convert them back to identifiers (which can be viewed as virtual registers; essentially, we realize the conversion of stack-based operations into register-based ones). Stack analysis can be done in a variety of ways, for example, using fixed-point analysis. Again, several caveats apply, and the need to properly identify stacks as well as their indices is crucial for this operations.
After another round of optimizations:
Once the stack analysis is complete, we can replace stack slot accesses by identifier accesses.
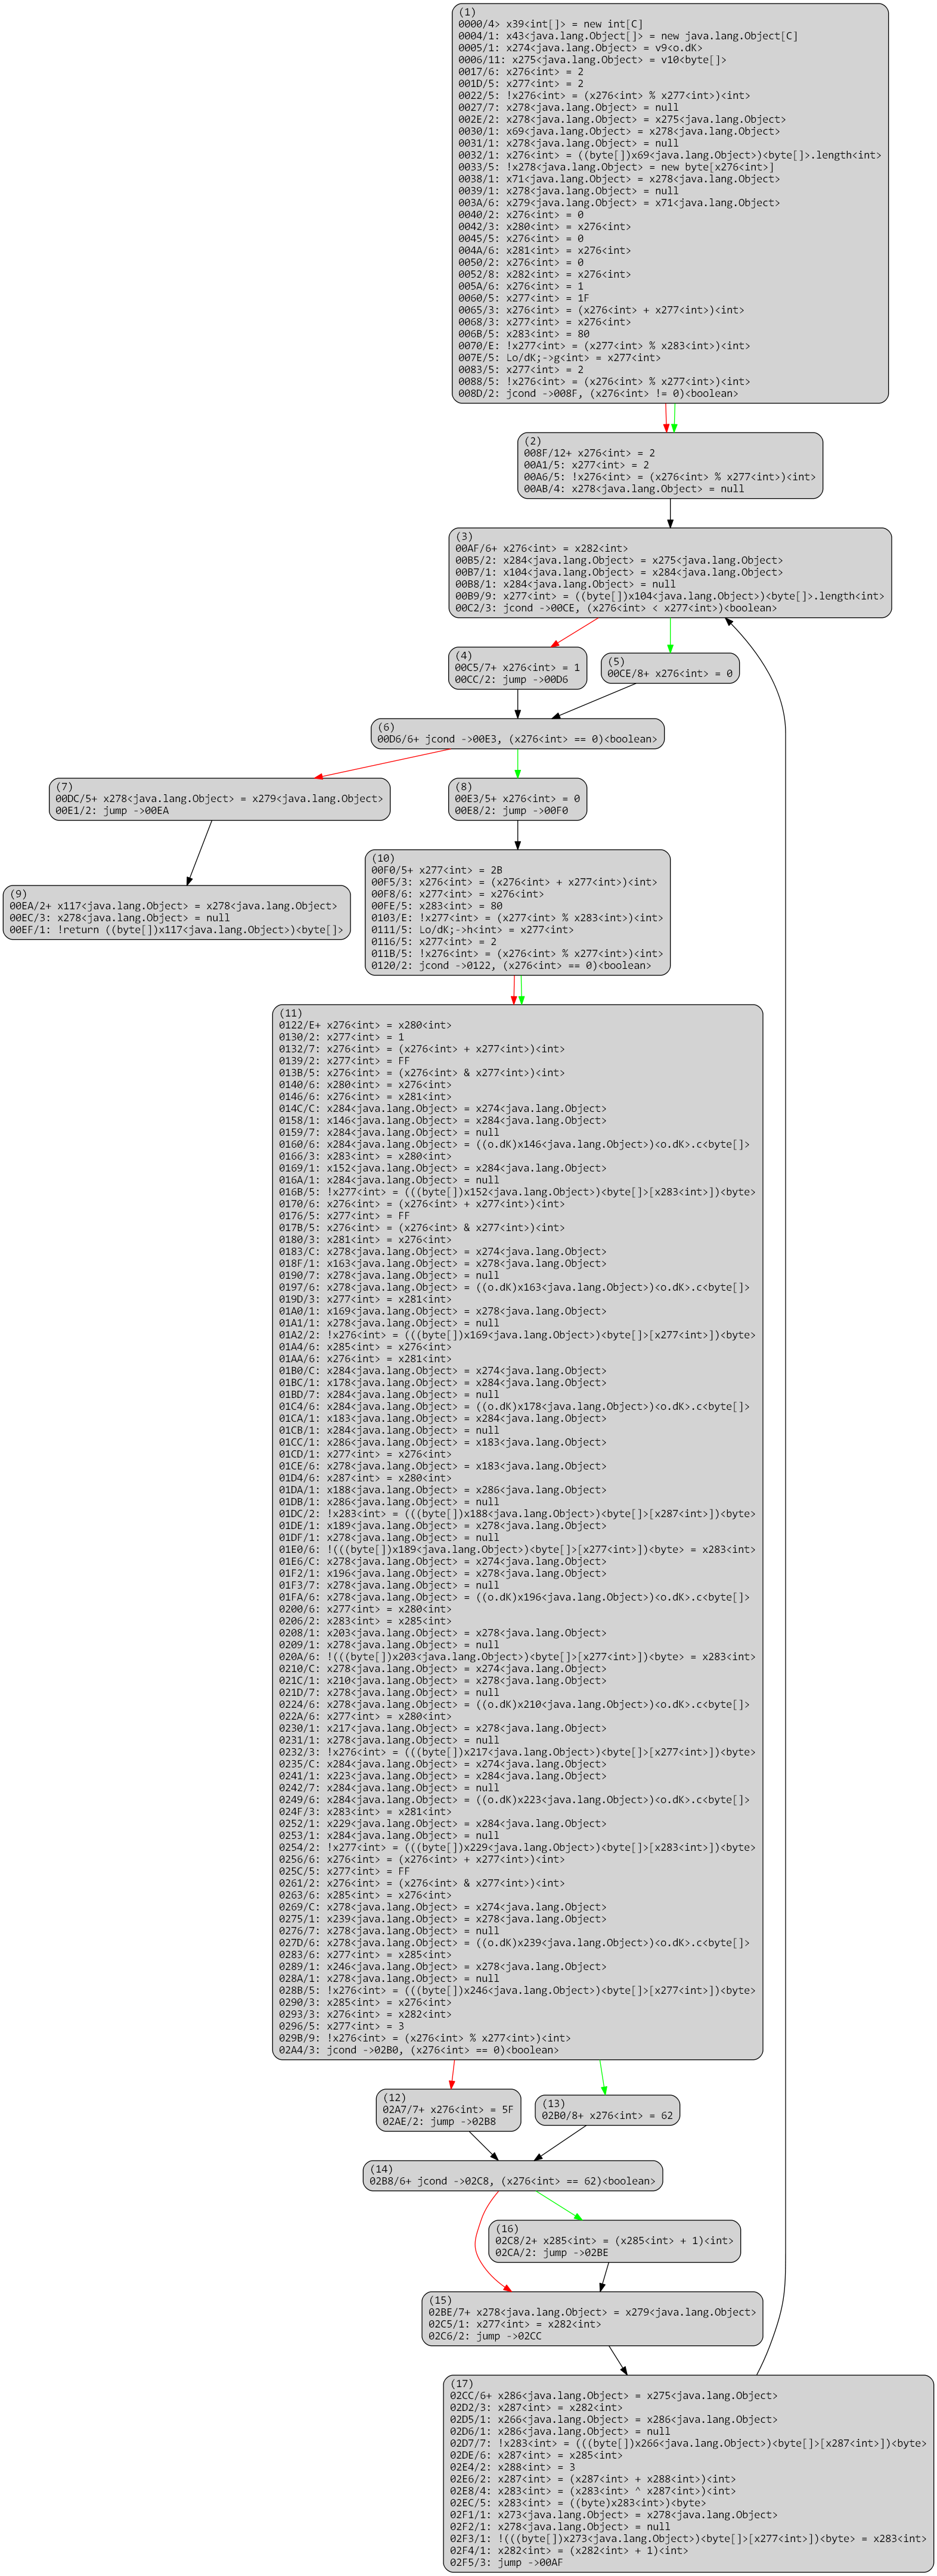
After a round of optimizations:
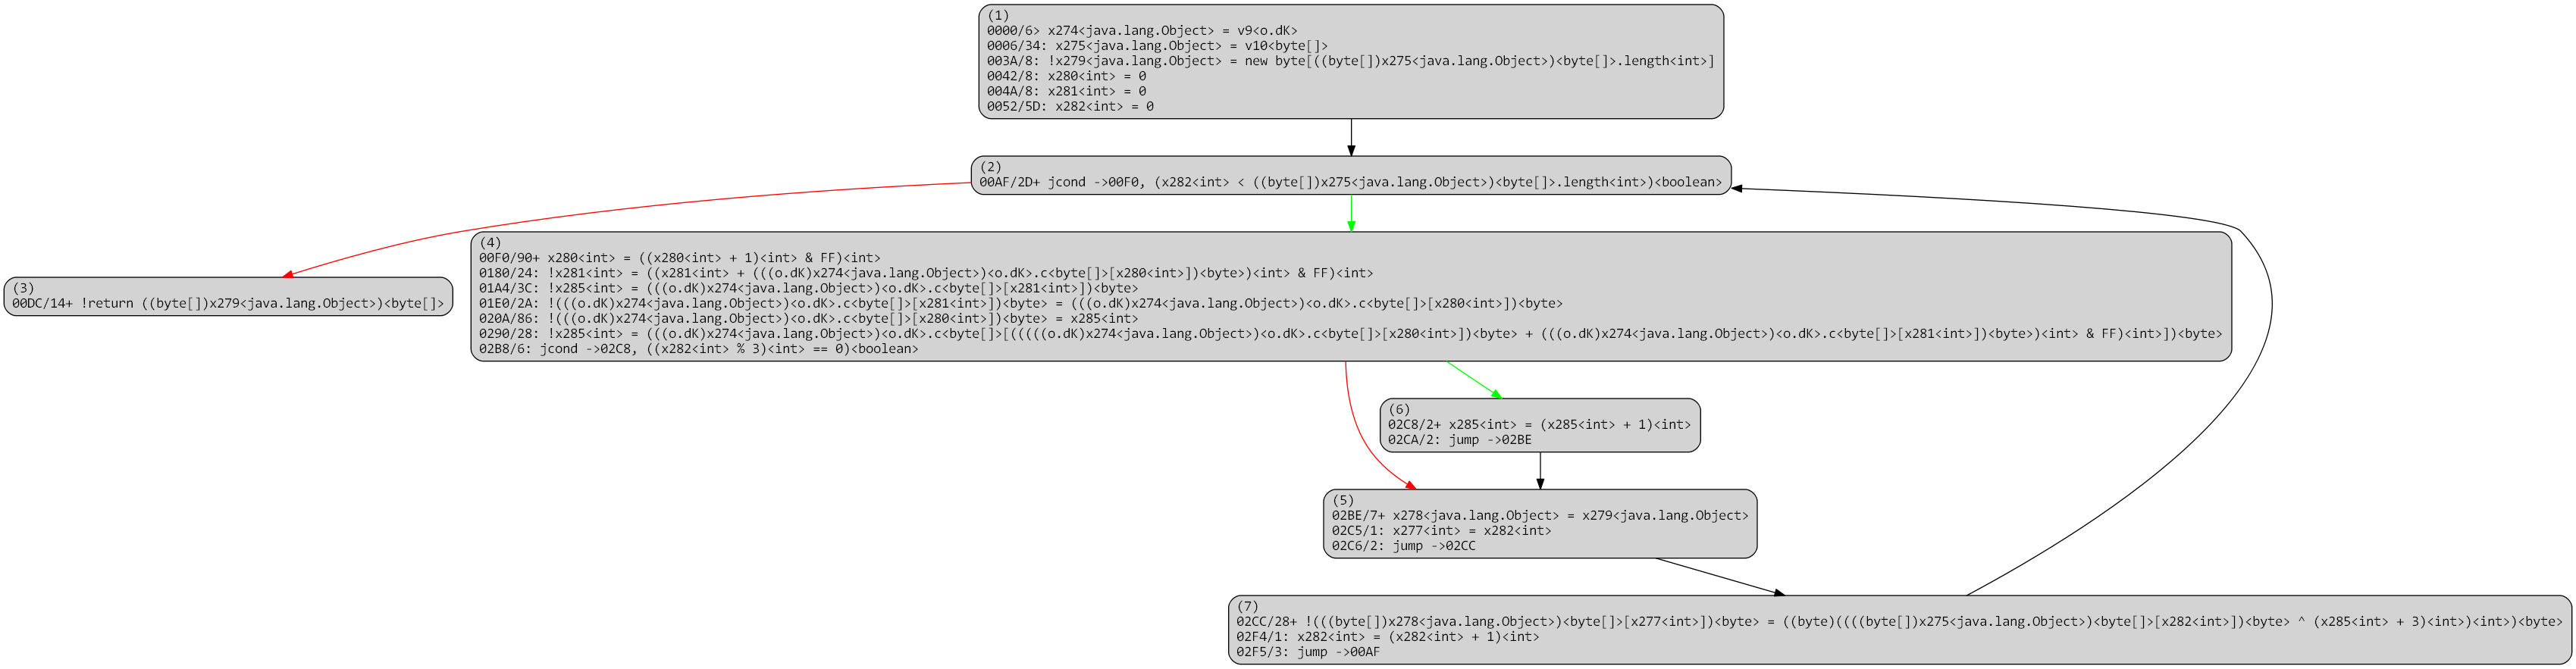
At this point, the “original” CFG is essentially reconstructed, and other advanced deobfuscation passes (e.g., emulated-based deobfuscators) can be applied.
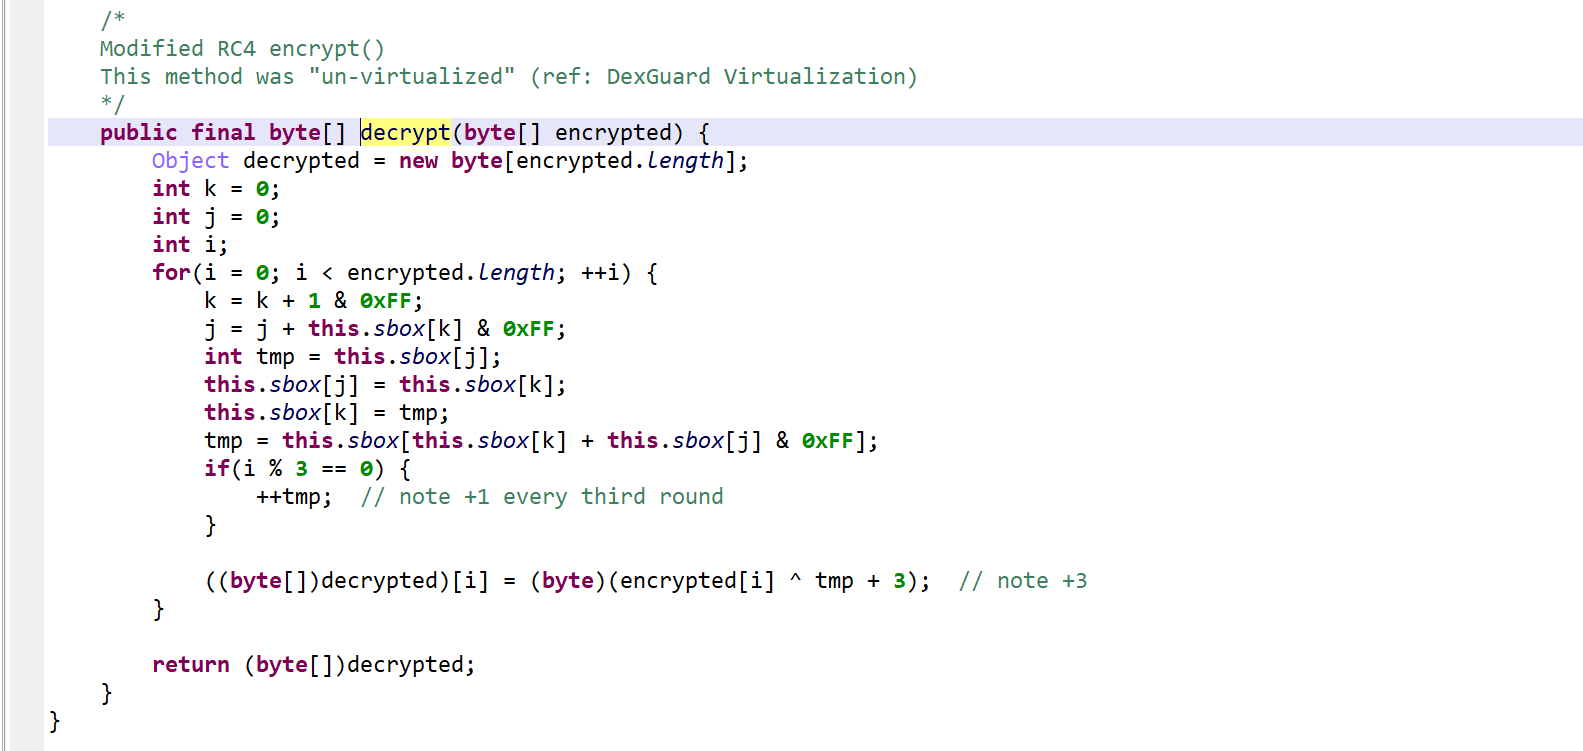
The high-level code generation yields a clean, unvirtualized routine:
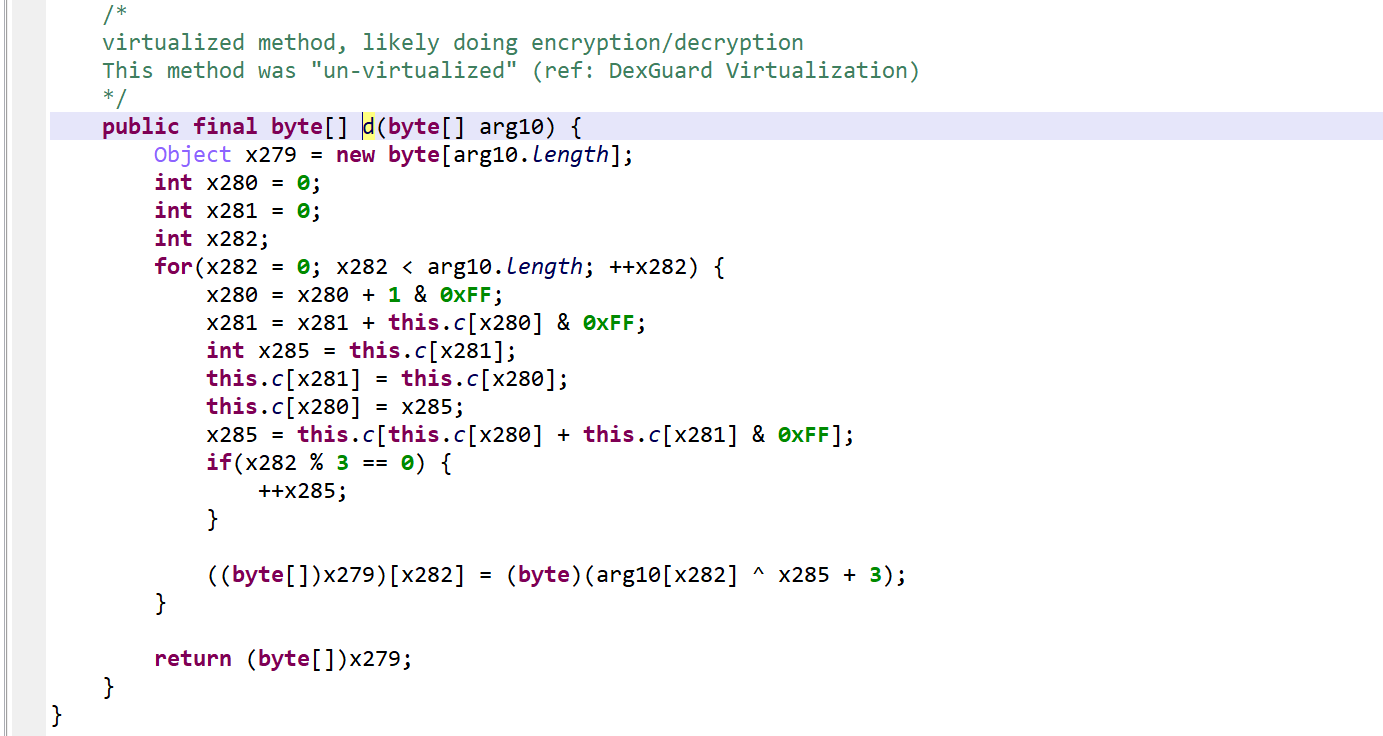
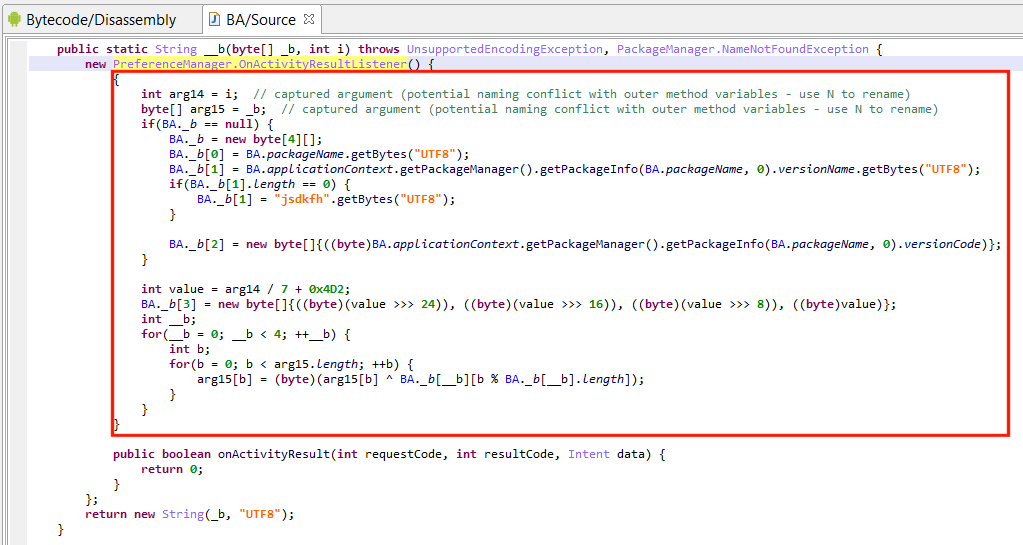
After reversing, it appears to be a modified RC4 algorithm. Note the +3/+4 added to the key.
Detecting Virtualized Methods
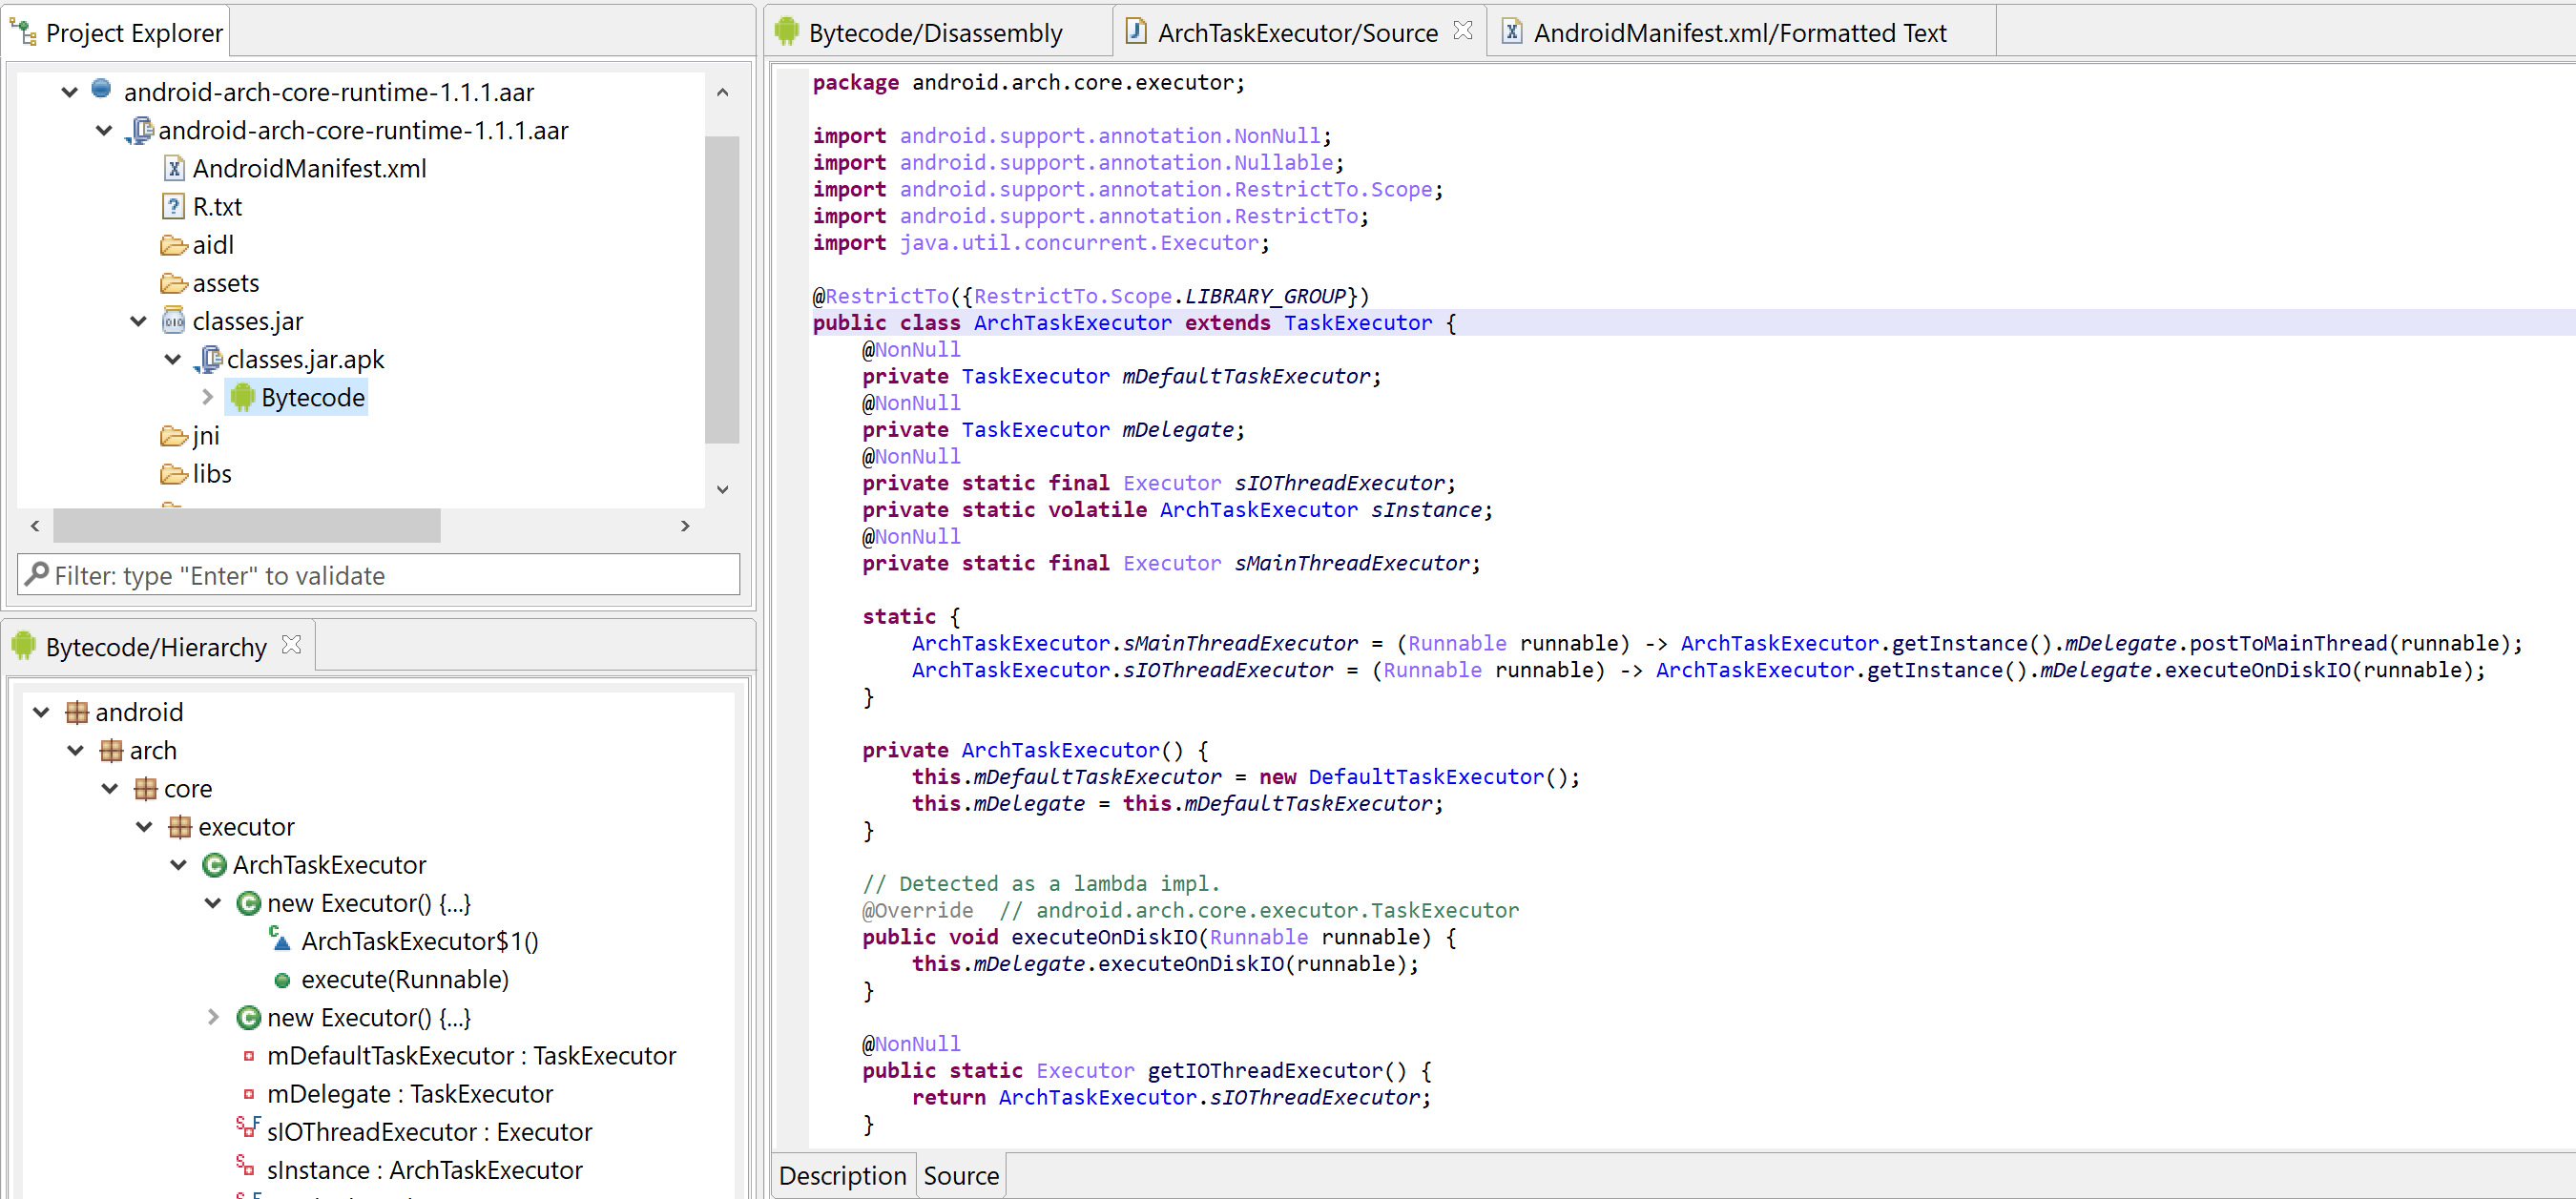
All versions of JEB detect virtualized methods and classes: run Global Analysis (GUI menu: Android) on your APK/DEX and look for those special events:
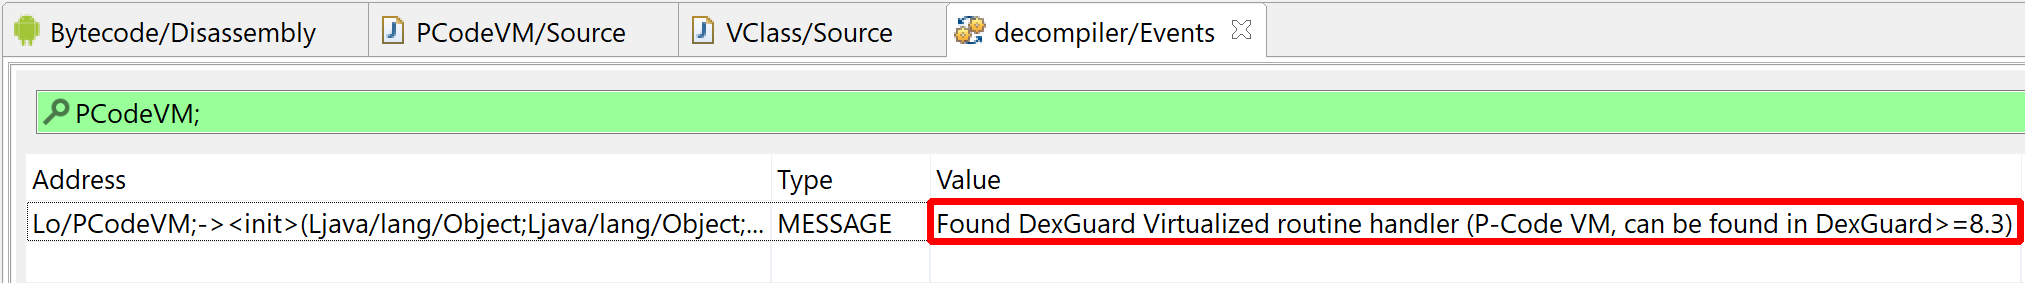
“Found Virtualized routine handler (P-Code VM)”
JEB Pro version 3.22 7 ships with the unvirtualizer module.
Tips:
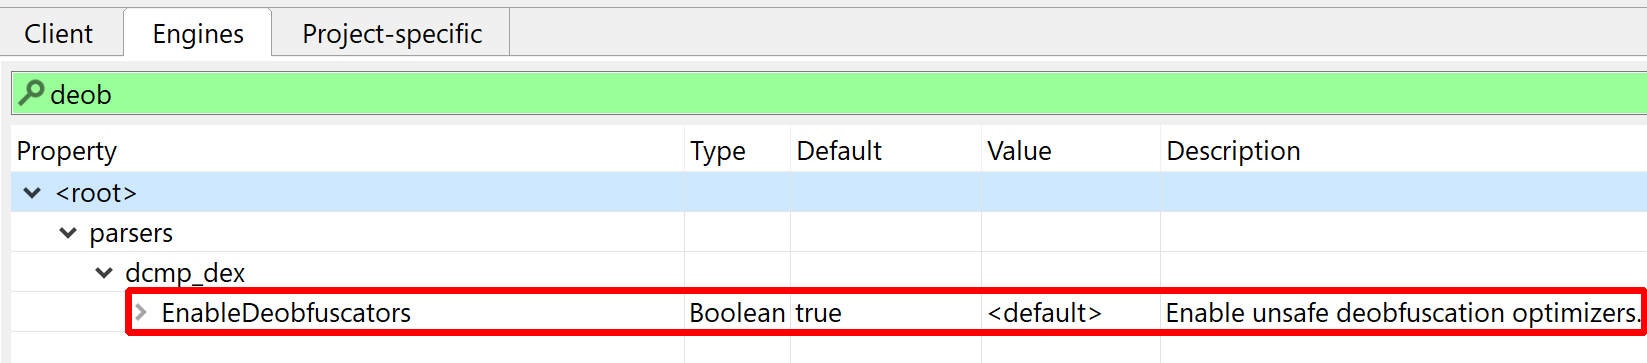
- Make sure to enable the Obfuscators, and enable Unvirtualization (enabled by default in the options).
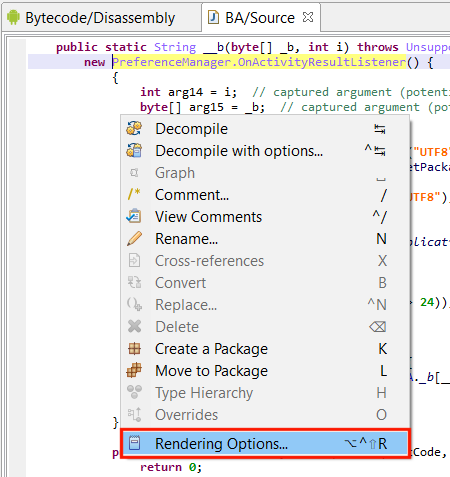
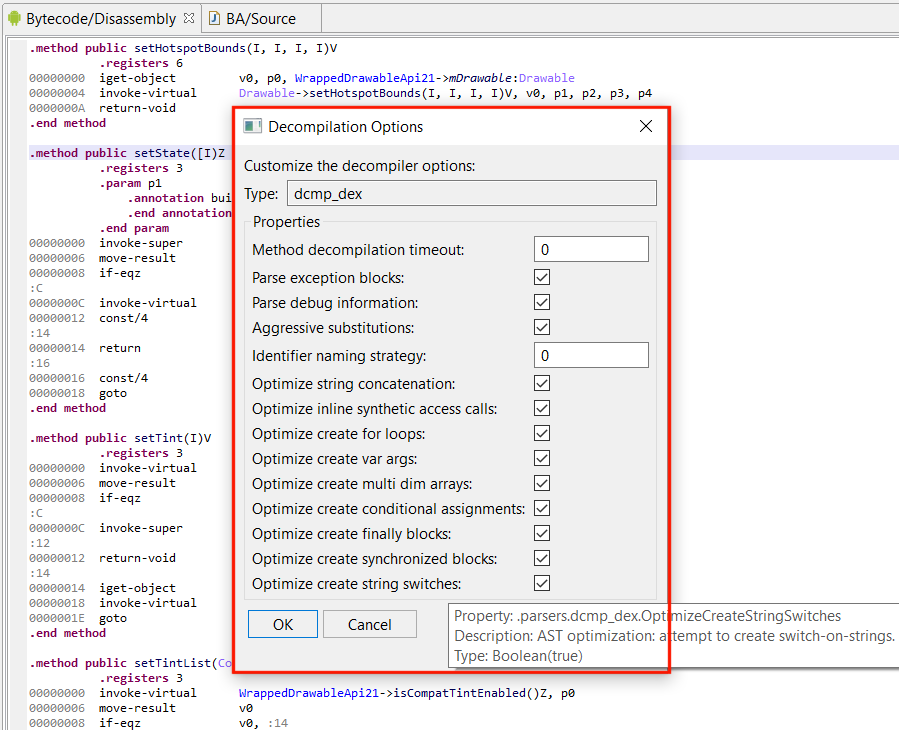
- The try-blocks analysis must be disabled for the class to unvirtualize. (Use MOD1+TAB to redecompile, untick “Parse Exception Blocks”).
- After a first decompilation pass, it may be easier to identify guard0/guard1, rename, and recompile, else OP obfuscation will remain and make the code unnecessarily difficult to read. (Refer to part 1 of this series to learn about what renaming those fields to those special names means and does when a protected app is detected.)
Conclusion
We hope you enjoyed this third installment on code (un)virtualization.
There may be a fourth and final chapter to this series on native code protection. Until next time!
—
- On a personal note, my first foray into VM-based protection dates back to 2009 with the analysis of Trojan.Clampi, a Windows malware protected with VMProtect ↩
- Although one could argue that with current hardware (fast x64/ARM64 processors) and software (JIT’er and AOT compilers), that drawback may not be as relevant as it used to be. ↩
- Machine here may be understood as physical machine or virtual machine ↩
- dexdec is JEB’s dex decompiler engine ↩
- gendec is JEB’s generic decompilation pipeline ↩
- Note the similarities with CFG flattened by chenxification and similar techniques. One key difference here is that the next block may be determined using the p-code array, instead of a key variable, updated after each operation. I.e., is the FSM – controlling what the next state (= the next basic block) is – embedded in the flattened code itself, or implemented as a p-code array. ↩
- JEB Android and JEB demo builds do not ship the unvirtualizer module. I initially wrote this module as a proof-of-concept not intended for release, but eventually decided to offer it to our professional users who have legitimate (non malicious) use cases, e.g. code audits and black-box assessments. ↩